WATER QUALITY 2021 ANNUAL - Presented By - City of Northglenn
←
→
Page content transcription
If your browser does not render page correctly, please read the page content below
Public Water System
ID CO0101115

                                    2021 ANNUAL
                                      WATER
                                    QUALITY
                                               REPORT
                                         Water Testing Performed in 2020

Este informe contiene informaciόn muy       Presented By
   importante sobre su agua potable.
 Tradúzcalo o hable con alguien que lo
            entienda bien.
GENERAL INFORMATION
NORTHGLENN is proud to present its Annual
Water Quality Report covering the period between
January 1 through December 31, 2020.
CONTACT INFORMATION
John Winterton, Laboratory Supervisor 303.450.4074
Jason Hensel, Utilities Manager 303.450.4050 IMPORTANT HEALTH INFORMATION
Water/Sewer Line Issues 303.280.7803 Drinking water, including bottled water, may reasonably
be expected to contain at least small amounts of some
After Hour Water/Sewer Line Issues 303.451.1289 contaminants. The presence of contaminates does not
Utility Billing 303.450.8700 necessarily indicate that water poses a health risk.
More information about contaminants and potential health
INTRODUCTION effects can be obtained by calling the Environmental
Protection Agency’s Safe Drinking Water Hotline at
Our mission is to provide you and your 800.426.4791 or visiting EPA.org.
family with safe and reliable drinking
water. Your high quality water starts
with snowmelt sourced from the top of
Berthoud Pass and concludes when it
reaches your tap.
Through hard work and dedication,
state licensed operators ensure your
drinking water meets or is better than
all state and federal drinking water
standards. Investing in plant upgrades, new treatment
technologies and operator continuing education ensures
that the highest quality water is delivered to your home.
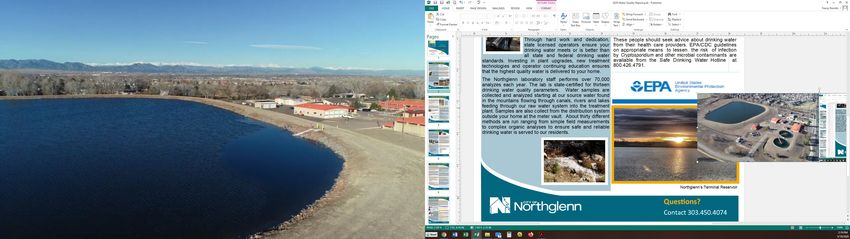
The Northglenn laboratory staff performs over 70,000
tests each year. The lab is state-certified for thirteen
drinking water quality parameters. Water samples are
collected and analyzed starting at our source water found
in the mountains flowing through canals, rivers and lakes
feeding through our raw water system into the treatment
plant. Samples are also collected from the distribution
system outside your home at the meter vault. About thirty
different methods are run ranging from simple field
measurements to complex organic analyses to ensure safe
and reliable drinking water is served to our residents.
Questions?
Contact 303.450.4074
COMMUNITY PARTICIPATION
PARTICIPATION OPPORTUNITIES WATER REBATES
Council Meetings are held on the 2nd and 4th Rebates Include:
Monday of the month at 7:00 pm at City Hall in Council Water-Efficient Toilets
Chambers. Residents have the opportunity to attend Water-Efficient Washing
meetings and communicate directly to council with Machines
questions or concerns about their community. Agendas Rotary Sprinkler Heads
are available at northglenn.org. All Council meetings are Irrigation Timers
televised on Channel 8 or can be viewed online. Rain Barrels
Turf Replacement
Unable to attend a council meeting? Ward meetings are
held regularly or you can directly contact your elected
Ward Council Members. Conservation Programs:
Garden in a Box Program,
STORMWATER MANAGEMENT offering discounts on water
efficient garden kits
Did you know that stormwater runoff is NOT treated, Slow the Flow, offering free
but flows directly into our streams? indoor and outdoor water
The Stormwater Management Program works to reduce use consultations
the amount of pollutants entering our streams, rivers,
lakes and reservoirs. Oil, grease, fluids from vehicles, soil WATER CONSERVATION
runoff during construction and other debris on the ground Residents are encouraged to use water wisely. Here
are just a few things that get washed away during storms are a few easy to implement conservation methods:
and into the very water that we use for drinking and
recreation. Water your lawn only two days per week, especially
during droughts. Your lawn will use water more
Properly maintaining your vehicle, efficiently, develop deeper roots, and become more
picking up after your pets and limiting tolerant to dry conditions.
use of lawn fertilizers and chemicals, Water between 6 p.m. and 10 a.m. and break the
are some of the ways you can help to amount of watering time into 2-3 shorter cycles. This
reduce pollution. will allow water to soak deeper into the soil between
cycles. Watering during the heat of the day may
cause you to lose up to 50% of your water application
Pet Waste Pollutes Our Watersheds! to evaporation.
Pet waste left on lawns does not fertilize grass. Bacteria Regularly check your pipes, hoses, valves and
in pet waste washes down storm drains into streams, faucets for leaks.
traveling for miles, potentially entering drinking water Use a bucket to wash your car. Use a shut-off nozzle
down river. on the hose to save water when not actively in use.
Use a broom to clean sidewalks, garages, patios and
driveways instead of a hose.
Use drought tolerant plants and grasses in your
landscaping.
Mulch your garden to reduce evaporation.
Set your lawn mower one notch higher. Longer grass
means less evaporation.
Reduce your watering in the spring and fall. Lawns
need less than one-third as much water in the spring
You can make a difference in preventing
and fall as it does during the summer.
stormwater pollution.
Find Out How Need more information on water rebates or conservation?
Visit northglenn.org
Questions?
Contact 303.450.4074
WATER SOURCE
STANDLEY LAKE: SURFACE WATER SWAP
Your water supply originates as The Colorado Department of
runoff from snowmelt and rain in Public Health and Environment provides a
the Clear Creek Watershed. Water Source Water Assessment Report for our water supply.
travels down Clear Creek then The Source Water Assessment Report provides a
through a network of canals and screening-level evaluation of potential contamination that
ditches to Standley Lake where it could occur. It does not mean that the contamination
is stored until treated. has or will occur.
This information is used to evaluate the need to improve
Water Quality is monitored at each stage of the journey our current water treatment capabilities and prepare for
from Clear Creek to Standley Lake. As well as throughout future contamination threats. This can help us ensure
the treatment process and the distribution system until that quality finished water is delivered to your home.
high quality water is delivered to your home. Source water assessment results also provide a starting
point for developing source water protection plans.
Drinking water sources are susceptible to
contamination from a wide variety of natural and
man-made origins. Improperly disposing of chemicals,
animal wastes, pesticides, human wastes, wastes
injected deep underground and naturally occurring
substances can all contaminate drinking water. Potential
contaminant sources for Northglenn include: anything
likely to manufacture, produce, use, store, dispose, or
transport regulated and unregulated contaminants of
concern. These sources are divided into discrete or
dispersed contaminate sources.
DISCRETE CONTAMINANT DISPERSED CONTAMINANT
SOURCES SOURCES
Generally, include facility-related operations from which Generally, include broad-based land uses and
the potential release of contamination would be confined miscellaneous sources from which the potential release of
to a relatively small area. contamination would be spread widely over a relatively
Potential discrete contaminant sources are identified as: large area.
Superfund Sites Potential dispersed contaminant sources are identified as:
Abandoned Contaminated Sites Commercial/Industrial/Transportation
Hazardous Waste Generators High Intensity and Low Intensity Residential
Chemical Inventory/Storage Sites Urban Recreational Grasses or Fallows
Toxic Release Inventory Sites Quarries/Strip Mines/Gravel Pits
Permitted Wastewater Discharge Sites Row Crops
Aboveground, Underground, and Pasture/Hay
Leaking Storage Tank Sites Forests
Solid Waste Sites Septic Systems
Existing/Abandoned Mine Sites Oil/Gas Wells
Road Miles
Questions?
Contact 303.450.4074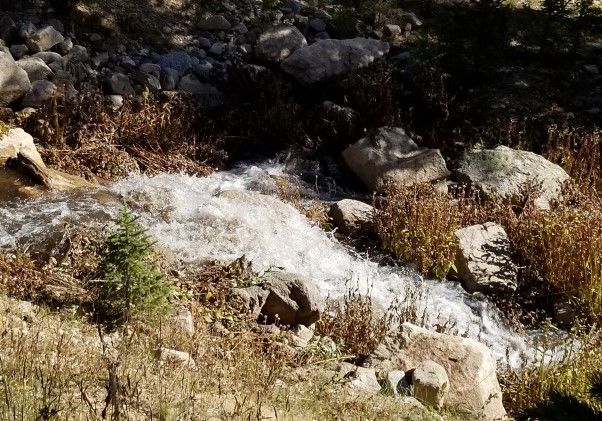
POSSIBLE SUBSTANCES IN WATER
If present, elevated levels of lead can cause serious
health problems (especially for pregnant women and
young children). It is possible that lead levels at your
home may be higher than other homes in the community
as a result of materials used in your home’s plumbing.
If you are concerned about lead in your water, you may
wish to have your water tested. When your water has
been sitting for several hours, you can minimize the
potential for lead exposure by flushing your tap for 30
seconds to 2 minutes before using water for drinking or In order to ensure that tap water is safe to drink, the
cooking.                                                  Colorado Department of Public Health & Environment
Additional information on lead in drinking water, testing prescribes regulations that limit the amount of certain
                                                          contaminants in water provided by public water systems.
methods and steps you can take to minimize exposure is
available from the EPA website or the Safe Drinking The Food and Drug Administration regulations establish
Water Hotline 800.426.4791.                               limits for contaminants in bottled water that must provide
                                                          the same protection for public
   NO LEAD LINES are present in city owned
         and maintained systems.
 Private residential or commercial lines running from the
 meter pit to houses or buildings, may be tested for lead
 at the individual owner’s expense. Interested in testing
 for lead, contact John Winterton at 303.450.4074.

                                                            Microbial Contaminants, such as pathogens and
                                                            bacteria, which may come from sewage treatment plants,
                           Fluoride, a mineral naturally septic systems, agricultural livestock operations or
                           present in source water, can wildlife.
                           be a benefit to dental health,
                           with an optimal range of 0.7-
                           1.2 mg/L. Many communities
                           add fluoride to their drinking
                           water to help promote good
                           dental health. The City of
                           Northglenn does not add flu- Pesticides and Herbicides, which may come from a
                           oride beyond what is natu- variety of sources such as agriculture, urban stormwater
                           rally found in our source wa- runoff and residential uses.
ter. The EPA has set a maximum level for fluoride
of 4 mg/L in drinking water. Some people who drink
water that contains fluoride in excess of this level can be
at risk for bone disease.
A secondary level of 2 mg/L has been set to help protect
    against dental fluorosis, which can cause stains and
            pitting in developing teeth. Children who are
            under 9 years of age should not drink water
                   that has more than 2 mg/L of fluoride.

                                                                                  Questions?
                                                                                  Contact 303.450.4074
DETECTED CONTAMINANTS
The City of Northglenn routinely monitors for contaminants in your drinking water according to
Federal and State laws. The following tables show all detections found in the period of January 1 to
December 31, 2020 unless otherwise noted. The State of Colorado requires the monitoring for certain
contaminants less than once per year because the concentrations of these contaminants are not expected to vary
significantly from year to year, or the system is not considered vulnerable to this type of contamination. Therefore,
some of our data, though representative, may be more than one year old. Violations and Formal Enforcement
Actions, if any, are reported in the next section of this report.
    Note: Only detected contaminants sampled within the last 5 years appear in this report. If certain results do not
              appear in this section then those contaminants were not detected in the last round of monitoring.

                               Disinfectants Sampled in the Distribution System
      TT Requirement: At least 95% of samples per period (month or quarter) must be at least 0.2 ppm OR
                      If sample size is less than 40 no more than 1 sample is below 0.2 ppm
                           Typical Sources: Water additive used to control microbes

Disinfectant                                  Sample                                                  Number of Samples              TT
                      Time Period                                          Results                                                                 MRDL
   Name                                        Size                                                      Below Level              Violation

                                                             Lowest period percentage of samples
   Chlorine               April 2020              51                                                           0                      No           ppm
                                                               meeting TT requirement: 100%

                                             Lead and Copper Sampled in the Distribution System

Contaminant                          Sample   90th       Unit of       90th                     Sample Sites 90th Percentile
                 Time Period                                                                                                        Typical Sources
   Name                               Size  Percentile Measurement Percentile AL                 Above AL    AL Exceedance
                                                                                                                                Corrosion of household
                  06/01/2020
                                                                                                                                plumbing systems;
  Copper              to               35          0.1             ppm               1.3             0                  NO
                                                                                                                                Erosion of natural
                  07/14/2020
                                                                                                                                deposits
                                                                                                                                Corrosion of household
                  06/01/2020
                                                                                                                                plumbing systems;
   Lead               to               35          2.3             ppb               2.3              0                 NO
                                                                                                                                Erosion of natural
                  07/14/2020
                                                                                                                                deposits

                                       Disinfection Byproducts Sampled in the Distribution System
                                                                Range
                                        Sample                               Unit of
        Name                  Year             Average          Low-                       MCL      MCLG MCL Violation            Typical Sources
                                         Size                              Measurement
                                                                 High
                                                       11.       8.2 to                                                      Byproduct of drinking water
Haloacetic Acids (HAA5)       2020           16                                ppb         60        N/A           No
                                                       09         15.1                                                       disinfection

Total Trihalo-Methanes                                           6.8 to                                                      Byproduct of drinking water
                              2020           16        41.11                   ppb         80       N/A            No
        (TTHM)                                                    73.7                                                       disinfection

      Total Organic Carbon (Disinfection Byproducts Precursor) Removal Ration of Raw and Finished Water
                 *If minimum ratio not met and no violation identified then the system achieved compliance using alternative criteria.

 Contaminant                         Sample                       Range        Unit of       TT Minimum     TT
                       Year                        Average                                                                      Typical Sources
    Name                              Size                       Low-High    Measurement        Ratio   Violations

 Total Organic                                                      1 to                                                 Naturally preset in the
                      2020              12             1.1                        Ratio            1.00       No
 Carbon Ratio                                                       1.25                                                 environment
Summary of Turbidity Sampled at Entry Point to the Distribution System
 Contaminant     Sample                                                                                                       TT          Typical
                                              Level Found                                 TT Requirement
    Name         Month                                                                                                     Violation      Sources

    Turbidity      Sept.         Highest Single Measurement: 0.077 NTU           Maximum 1 NTU for any Single Unit            NO         Soil Runoff

                              Lowest Monthly Percentage of Samples Meeting        In any month, at least 95% of the
    Turbidity      Dec.                                                                                                       NO         Soil Runoff
                                TT Requirement for our Technology: 100%          samples must be less than 0.3 NTU

                           Inorganic Contaminants Sampled at Entry Point to the Distribution System

 Contaminant                  Sample  Range                      Unit of                             MCL
                   Year                             Average                      MCL      MCLG                           Typical Sources
    Name                       Size  Low-High                  Measurement                         Violation
                                           0.04                                                                Discharge of drilling wastes; dis-
    Barium         2020          1          to        0.04           ppm           2           2       NO      charge from metal refineries; erosion
                                           0.04                                                                of natural deposits

                                           0.39                                                                Erosion of natural deposits; water
                                                                                                               additive which promotes strong teeth;
    Fluoride       2020          1          to        0.39           ppm           4       4           NO      discharge from fertilizer & aluminum
                                           0.39                                                                factories

                                                       Secondary Contaminants**
     **Secondary standards are non-enforceable guidelines for contaminants that may cause cosmetic effects (such as tooth discoloration)
                                    or aesthetic effects (such as taste, odor, or color) in drinking water.

   Contaminant                    Sample Size       Range Low-High                                                         Secondary Standard
                       Year                                                  Average           Unit of Measurement
      Name

      Sodium           2020            1                  25 to 25               25                    ppm                             N/A

                               Unregulated Contaminants Present in the Distribution System***
    EPA has implemented the Unregulated Contaminant Monitoring Rule (UCMR) to collect data for contaminants that are suspected to be
 present in drinking water and do not yet have health-based standards set under the Safe Drinking Water Act. EPA uses the results of UCMR
 monitoring to learn about the occurrence of unregulated contaminants in drinking water and to decide whether or not these contaminants will
          be regulated in the future. We performed this monitoring throughout 2018 and results are submitted and reviewed by EPA.
   Once EPA finalizes review, the results will be made available in the EPA’s National Contaminant Occurrence Database (NCOD), where
                                                       consumers can access the data.
               Contaminants that were detected during our UCMR4 sampling and the corresponding results are provided below.
Contaminants sampled at the entry point were all non-detects (including 10 cyanotoxins, 2 metals, 8 pesticides, 3 alcohols and 3 semi-volatiles).

                Contaminant Name                        Year     Sample Size       Range Low-High           Average       Unit of Measurement

HAA9 (includes the HAA5 already regulated, plus 4
      additional brominated haloacetic acids)           2018           16              19.7 to 28.4            22.5                 ppb
   Tested Every 5 Years—Next Test Year 2023

                       *More information about contaminants that were included in UCMR monitoring can be found at:
                       drinktap.org/Water- Info/What's-in-My-Water/Unregulated-Contaminant-Monitoring-Rule-UCMR.
                    Learn more about EPA UCMR at: epa.gov/dwucmr/learn-about-unregulated-contaminant-monitoring-rule
                          Contact the Safe Drinking Water Hotline at (800) 426-4791 or water.epa.gov/drink/contact.cfm.

                                                                                                        Questions?
                                                                                                        Contact 303.450.4074
Violations, Deficiencies, Enforcement
Backflow and/or Cross-Connection Health-Based Violations
We have an inadequate backflow prevention and cross-connection control program.
Uncontrolled cross connections can lead to inadvertent contamination of the drinking water.
MAXIMUM CONTAMINANT LEVEL (MCL) VIOLATION
Test results for this contaminant show that the level was too high for the time period show.
This is likely the same violation disclosed in 2020.
Evaluations are being performed to reduce or remove the contaminant.
Quarterly updates will be provided if the solution takes an extended period to resolve.
TREATMENT TECHNIQUE (TT) VIOLATION
Failure to complete an action that could potentially affect water quality.
This is likely the same violation disclosed in 2020.
Failures may include one or more of the following during the time period shown below.
Not meeting minimum operation/treatment standards.
Not making required upgrades to the system.
Not evaluating system for potential sanitary defects
Information provided below describes potential health effects for vulnerable populations.
Additional Violation Information
*Please share this information with others who drink this water, especially those who may not have received notice directly (for example, people
in apartments, nursing homes, schools and businesses). Do this by posting this notice in a public place or distributing copies by hand or mail.*
Explanation of the violation (s), the steps taken to resolve them and the anticipated resolved date.
The City of Northglenn received violations for 6 locations that failed to retest cross-connection control devices within 90 days of the testing date.
In addition, 4 locations had uncontrolled cross-connections that did not repair the problem within 120 days of being noticed of the violation.
These violations occurred during the period of August 2019 through August 2020.
At this time, all violations, but one, have been corrected.
Northglenn is working with the state to ensure the remaining violation is resolved in the timeliest manner
possible.
It is anticipated that this issue will be resolved by December 31, 2021.
Violation Questions?
Contact 303.450.4022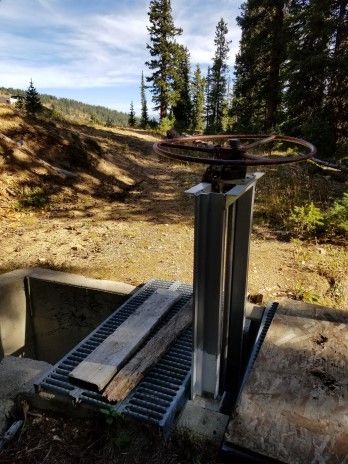
TERMS, ABBREVIATIONS & SYMBOLS
Action Level (AL)
                                                               Maximum Contaminant Level Goal (MCLG)
The concentration of a contaminant which, if exceeded,
triggers treatment and other regulatory requirements.          The level of a contaminant in drinking water below
                                                               which there is no known or expected risk to health.
Average (x-bar)                                                MCLGs allow for a margin of safety.
The calculated central value of a set of numbers.
                                                               Nephelometric Turbidity Unit (NTU)
Compliance Value (No Abbreviation)                             Measure of the clarity or cloudiness of water. Turbidity in
Single or calculated value used to determine if regulatory     excess of 5 NTU is just noticeable to the typical person.
contaminant level (e.g. MCL) is met. Examples of
                                                               Not Applicable (N/A)
calculated values are the 90th Percentile, Running
Annual Average (RAA) and Locational Running Annual             Does not apply or not available.
Average (LRAA).
                                                               Non-Health-Based (No Abbreviation)
Distribution System (DS)                                       A violation that is not MCL or TT.
The series of pipes the city maintains that deliver finished
                                                               Parts per million = Milligrams per liter (ppm = mg/L)
drinking water to our residents and businesses.                One part per million corresponds to one minute in two
Entry Point to the Distribution System (EPTDS)                 years or a single penny in $10,000.
The point at the water treatment facility that treatment is    Parts per billion = Micrograms per liter (ppb = µg/L)
complete (finished), but prior to being pumped out to the      One part per billion corresponds to one minute in 2,000
system.                                                        years, or a single penny in $10,000,000.
Formal Enforcement Action (No Abbreviation)                    Picocuries per liter (pCi/L)
Escalated action taken by the State (due to the risk to        Measure of the radioactivity in water.
public health, or number or severity of violations) to
bring a non-compliant water system back into                   Range (R)
compliance.                                                    Lowest value to the highest value.
Gross Alpha (No Abbreviation)                                  Running Annual Average (RAA)
Gross alpha particle activity compliance value. It includes    An average of monitoring results for the previous twelve
radium-226, but excludes radon 222, and uranium.               calendar months or previous four quarters.
Health-Based (No Abbreviation)                                 Sample Size (n)
A violation of either an MCL or TT.                            Number or count of values (i.e. number of water samples
Location Running Annual Average (LRAA)                         collected).
The average of results for samples collected at a              Treatment Technique (TT)
particular location during the most recent four calendar       A required process intended to reduce the level of a con-
quarters.                                                      taminant in drinking water.
Maximum Contaminant Level (MCL)                                Variance and Exemptions (V/E)
The highest level of a contaminant allowed in drinking         Department of Public Health & Environment permission
water.                                                         not to meet an MCL or treatment technical technique
                                                               under certain conditions.
                                                               Violation (No Abbreviation)
                                                               Failure to meet a Colorado Primary Drinking Water
                                                               Regulation.

                                                                                       Questions?
                                                                                       Contact 303.450.4074
FREQUENTLY ASKED QUESTIONS
What is the hardness of Northglenn’s water?
Total hardness in drinking water is caused by calcium and
magnesium carbonate, which occur naturally in our water
source. When high levels of these two minerals are
present in the water supply, build-up of mineral deposits
or scaling can occur. A level of 75 mg/L or less of these
minerals is considered “soft” water, while a level of 300 Why do I taste chlorine in my water?
mg/L or more is considered “very hard” water. In the Chlorine, a disinfectant, is added to the water in its
distribution system, Northglenn’s average level of total final treatment stage to kill bacteria and viruses. This is
hardness in 2019 was 120 mg/L (or 7.01 grains per the most efficient and cost-effective method of disinfection
gallon), which falls within the moderate range. available. The amount used is well below a level that
would harm humans, but some people are more sensitive
How much sodium is in water? to the taste and odor of chlorine than others and may find
At this time, sodium is not a regulated contaminant in it objectionable.
drinking water. The EPA recognizes that high levels of An inexpensive way to minimize this is to keep a jug of
salt are associated with hypertension, but that sodium water in the refrigerator for drinking; the colder the water,
levels in drinking water are usually low and unlikely to the less noticeable the taste and odor of chlorine.
contribute to adverse health effects. Most Americans
consume between 4000-6000 mg of sodium a day from
their diet. What causes rusty colored water?
Periodically, city crews may flush every fire hydrant along
In a study conducted by the EPA, 75% of the water the 110 miles of water mains in Northglenn to remove
systems tested had concentrations less than 50 mg/L of debris in the form of sand particles or pipe scale. Small
sodium. At this level, drinking 2 liters (about 8 glasses) of amounts of iron and manganese may temporarily discolor
water per day would contribute less than 100 mg of your water during this process, but this is not harmful.
sodium per day.
If you notice a rusty tinge to your water, open all your
What causes the odors from sink drains? faucets at the same time for a few minutes until the water
Sometimes unpleasant odors can rise from the sink drain runs clear.
in your kitchen or bathroom, usually caused by bacterial
growth. What is the black color in my water?
Suggestions to minimize drain odors: Check the washers and O-rings inside your faucet
Put orange or lemon peels in your garbage disposal. fixtures as they can break down and ooze black.
Pour water with some bleach down the drain.
Put baking soda in the drain, followed by a few cups of Why does my water appear muddy or sandy?
boiling water. Flushing all your taps for 10 minutes should help alleviate
Pour hot vinegar down the drain, followed by cold the issue.
water.
Repeat as needed. Fixtures getting plugged with sand-like particles?
Even in the toilet?
Why does the water appear cloudy at times? The most probable source is a water softener. Zeolite, or
This seems to happen more often in winter when the resin beads, can escape from the water softener into the
drinking water is colder, but may also happen if you have internal plumbing. This can happen even if the softener is
an aerator attached to your faucet. not in use. Proper maintenance should prevent this issue.
There is no cause for alarm; tiny air bubbles in the water (Northglenn has only moderately hard water and in most
cause the milky or cloudy appearance. If the water is instances, a water softener is not necessary.)
left to stand for a short while, the bubbles will rise
to the surface and dissipate.
Questions?
Contact 303.450.4074You can also read