Vertical stratification of insect abundance and species richness in an Amazonian tropical forest - Nature
←
→
Page content transcription
If your browser does not render page correctly, please read the page content below

www.nature.com/scientificreports

                OPEN             Vertical stratification of insect
                                 abundance and species richness
                                 in an Amazonian tropical forest
                                 Dalton de Souza Amorim1*, Brian V. Brown2, Danilo Boscolo1, Rosaly Ale‑Rocha3,
                                 Deivys Moises Alvarez‑Garcia4, Maria Isabel P. A. Balbi1, Alan de Marco Barbosa1,
                                 Renato Soares Capellari5, Claudio José Barros de Carvalho6, Marcia Souto Couri7,
                                 Rodrigo de Vilhena Perez Dios8, Diego Aguilar Fachin1, Gustavo B. Ferro9,
                                 Heloísa Fernandes Flores1, Livia Maria Frare1, Filipe Macedo Gudin8, Martin Hauser10,
                                 Carlos José Einicker Lamas11, Kate G. Lindsay12, Marco Antonio Tonus Marinho13,
                                 Dayse Willkenia Almeida Marques3, Stephen A. Marshall12, Cátia Mello‑Patiu7,
                                 Marco Antônio Menezes7, Mírian Nunes Morales14, Silvio S. Nihei8, Sarah Siqueira Oliveira15,
                                 Gabriela Pirani1, Guilherme Cunha Ribeiro16, Paula Raille Riccardi1,
                                 Marcelo Domingos de Santis8, Daubian Santos16, Josenilson Rodrigues dos Santos7,
                                 Vera Cristina Silva1, Eric Matthew Wood17,18 & José Albertino Rafael3

                                 Tropical forests are among the most biodiverse biomes on the planet. Nevertheless, quantifying the
                                 abundance and species richness within megadiverse groups is a significant challenge. We designed
                                 a study to address this challenge by documenting the variability of the insect fauna across a vertical
                                 canopy gradient in a Central Amazonian tropical forest. Insects were sampled over two weeks using
                                 6-m Gressitt-style Malaise traps set at five heights (0 m–32 m–8 m intervals) on a metal tower in a
                                 tropical forest north of Manaus, Brazil. The traps contained 37,778 specimens of 18 orders of insects.
                                 Using simulation approaches and nonparametric analyses, we interpreted the abundance and richness
                                 of insects along this gradient. Diptera, Hymenoptera, and Coleoptera had their greatest abundance
                                 at the ground level, whereas Lepidoptera and Hemiptera were more abundant in the upper levels
                                 of the canopy. We identified species of 38 of the 56 families of Diptera, finding that 527 out of 856
                                 species (61.6%) were not sampled at the ground level. Mycetophilidae, Tipulidae, and Phoridae were
                                 significantly more diverse and/or abundant at the ground level, while Tachinidae, Dolichopodidae, and
                                 Lauxaniidae were more diverse or abundant at upper levels. Our study suggests the need for a careful
                                 discussion of strategies of tropical forest conservation based on a much more complete understanding
                                 of the three-dimensional distribution of its insect diversity.

                                 Tropical forests are the most diverse biome on the planet and also among the most endangered. Habitat loss
                                 due to anthropogenic commercial activities threatens the future of the plants and animals that inhabit these

                                 1
                                  Entomology Grad Program, Department of Biology, FFCLRP, University of Sao Paulo, São Paulo, SP, Brazil. 2Urban
                                 Nature Research Center and Entomology Section, Natural History Museum of Los Angeles County Los Angeles,
                                 Los Angeles, CA, USA. 3Coordenação de Biodiversidade, Instituto Nacional de Pesquisas da Amazônia, Manaus,
                                 AM, Brazil. 4University of Sucre, Sincelejo, Colombia. 5Instituto Federal do Triângulo Mineiro-Campus Uberaba,
                                 Uberaba, MG, Brazil. 6Departamento de Zoologia, Universidade Federal do Paraná, Curitiba, PR, Brazil. 7Museu
                                 Nacional, Universidade Federal do Rio de Janeiro, Rio de Janeiro, RJ, Brazil. 8Departamento de Zoologia, Instituto
                                 de Biociências, Universidade de São Paulo, Sao Paulo, SP, Brazil. 9Universidade Federal da Paraíba, João Pessoa,
                                 PB, Brazil. 10Plant Pest Diagnostics Branch, California Department of Food and Agriculture, Sacramento, MG,
                                 Brazil. 11Museu de Zoologia, University of Sao Paulo, São Paulo, SP, Brazil. 12School of Environmental Sciences,
                                 University of Guelph, Guelph, Canada. 13Departamento de Ecologia, Zoologia e Genética, Instituto de Biologia,
                                 Universidade Federal de Pelotas, Capão do Leão, RS, Brazil. 14Programa de Pós‑Graduação em Entomologia,
                                 Universidade Federal de Lavras, Lavras, MG, Brazil. 15Department of Ecology, Institute of Biological Sciences,
                                 University of Goiás, Goiás, GO, Brazil. 16Centro de Ciências Naturais e Humanas, Universidade Federal do ABC,
                                 Santo André, SP, Brazil. 17California State University Los Angeles, Los Angeles, CA, USA. 18Ornithology Section,
                                 Natural History Museum of Los Angeles County Los Angeles, Los Angeles, CA, USA. *email: dsamorim@usp.br

Scientific Reports |   (2022) 12:1734                | https://doi.org/10.1038/s41598-022-05677-y                                                1

                                                                                                                                            Vol.:(0123456789)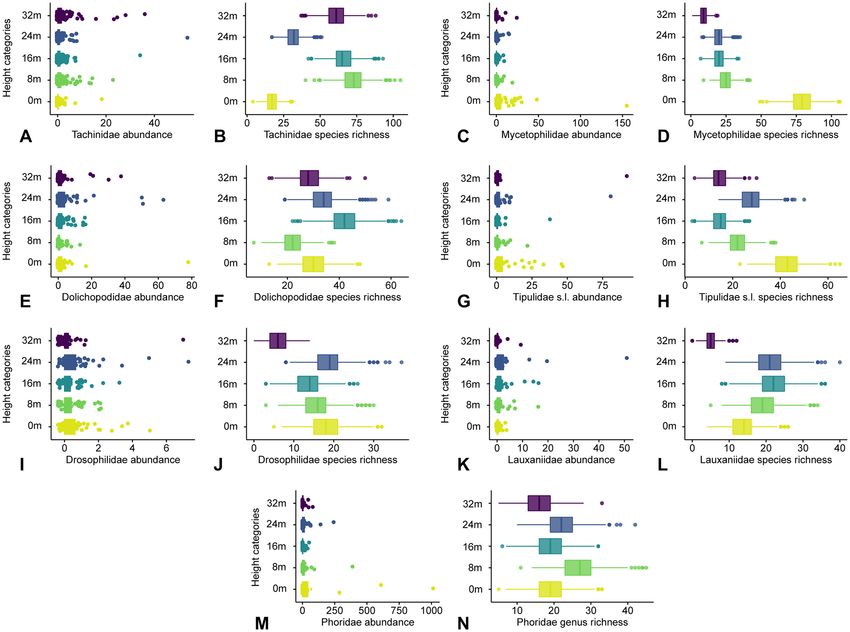
www.nature.com/scientificreports/
ecosystems. To understand and hopefully save these vital, complex environments, it is necessary to understand
the biodiversity within in much greater detail. In particular, it is crucial to quantify and document the abundance
and species richness of their most species-rich taxa, such as insects. Although challenging, the precise assess-
ment of insect diversity and abundance is a fundamental prerequisite to estimating and mitigating biodiversity
loss in tropical forests.
Over the last four decades, studies have uncovered unexpected additional complexity in these forests with
the canopy (the leafy crowns of trees) as a vertically stratified ecosystem interconnected with other strata of the
forests1. Different aspects of canopy ecology and diversity have been studied to date, including climatic gradients
within the f orest2, biomass3,4, abundance5, alpha d
iversity6, beta d
iversity7, species i nteractions8, biogeochemical
cycles9, guild structure10, long-term succession11, community organization12, models of vertical distribution13,
human impact14, and other parameters, with a growing number of papers on techniques and methods15–28. For
example, a study on the island of B orneo5 demonstrated that 85% of the variability in arthropod abundance is
explained by variability in total leaf area—hence, understory vegetation and canopy contributed disproportion-
ately to the total abundance. In an extensive study of canopy insects in Panama10, peaks of abundance at the
ground level and in the canopy were found, with most adult arthropods collected either from the soil/litter or
from the upper canopy.
Many studies are now available on the diversity of particular insect groups in the canopy. Nevertheless, the
underlying questions guiding these studies vary considerably, including the collecting techniques, the level of
taxonomic identification, and the core group of insects considered. Some studies approach an array of arthro-
pod groups29–36, while most focus on particular groups of lepidopterans37–47, beetles48–53, hymenopterans54–58,
orthopterans59, collembolans60,61, psocopterans62 or hemipterans63.
Diptera (true flies) are possibly the least-studied of the megadiverse insect orders, and much remains to be
discovered about the diversity of the fly fauna in tropical forests. Aside from the heavily researched disease vec-
tors of medical importance (mosquitoes and phlebotomine sand flies), most groups of flies have received much
less attention from tropical biologists than more charismatic groups of insects. The number of species of flies
described worldwide is about 160,000 and comprise about 10% of all known species of organisms. However,
based on projections from mass-sampling projects64–66, the number of existing Diptera species is likely much
higher. For example, an all-Diptera diversity inventory in Costa Rica estimated about 8000 species in a single
two-hectare forest site in Zurquí.
Here, we set out to deepen our understanding of the variability of the insect fauna across a vertical canopy
gradient in a Central Amazonian tropical forest. The present study has a two-fold objective. First, we documented
the variability of the insect community abundance along a canopy height gradient. Second, we focused our
analysis on the Diptera subcomponent of the insect community to understand how this ecologically important
and diverse group of insects varies in abundance and species richness at distinct heights of the tropical forest
canopy gradient. Published data shows that the insect species composition is not homogeneous across the vertical
structure of the forest67, so we expected that a more intensive study of flies, in particular, would show considerable
variation along the canopy height gradient, similar to that was found for other taxa in other s ystems68.
Methods
We assessed the vertical structure of insect diversity in a tropical forest using a novel sampling protocol. We used
five 6-m long Gressitt-style Malaise traps set at every 8 m from the ground level to slightly above the canopy top
at 32 m. The tower (53-m high) is located at the “Estação Experimental de Silvicultura Tropical (EEST)”, km 14
of the road ZF2 (2° 35′ 21″ S, 60° 06′ 55″ W) and belongs to the Instituto Nacional de Pesquisas da Amazônia
(INPA), in Manaus, Brazil (briefly referred to here as the ZF2 tower). The tower is located inside a typical
Amazonian landscape comprised of ombrophilous dense forest. The canopy reached 40 or even 50 m high due
to emergent trees, with a mean canopy height of 28.6 m at the area of the tower69. The solid floor at each tower
level, which prevents insects from escaping at the lower part of the traps, combined with the trap model used,
produced much larger catches of target insects than other canopy sampling methods we have tried.
All traps have biases, and Malaise traps are knowingly much better for collecting active, flying insects such
as Diptera and Hymenoptera70. We view this bias as a benefit since we are attempting to maximize sampling the
diversity of Diptera in our project. We are not aware of any in-depth studies on the differences in catch of the
Gressitt-style Malaise traps71 used here from those of the more frequently employed Towes-style traps other than
the assertion in the original paper that the Gressitt-style traps catch more specimens 71. It has been mentioned72 a
possible drawback to Gressitt-style traps, in that they would be heavy, difficult to place in the field and potentially
would not catch low or weakly-flying insects. This latter assertion, to our knowledge, has not been formally tested
and does not fit our own observation while sampling with this trap.
Sampling was conducted over a single period of two weeks, during which traps were operated at ground
level, 8, 16, 24, and 32 m levels. Insect specimens of each trap were sorted to order and counted; flies were then
sorted down to family and counted. Taxonomic specialists for 38 of the sampled fly families identified morphos-
pecies assigned to genera (except for phorids, only assigned to genera). Specialists used different preparation
techniques for dealing with their specimens as appropriate (critical-point-drying, slide-mounting, dissection
of the terminalia, etc.).
To address our two objectives, we took two analytical approaches. First, to document the variability of the
general insect abundance along the vertical gradient, we used a simulation approach to visually understand how
the insect orders varied in abundance across trapping locations. Because our data were based on counts, we
simulated a dataset following a Poisson distribution using the ‘rpois’ function in R 73. We established the lambda
value (or the rate) as the total number of counts of specimens within megadiverse groups at a trapping loca-
tion, and we simulated the distribution based on 1000 samples from each height (5000 in total) (Supplementary
Scientific Reports | (2022) 12:1734 | https://doi.org/10.1038/s41598-022-05677-y 2
Vol:.(1234567890)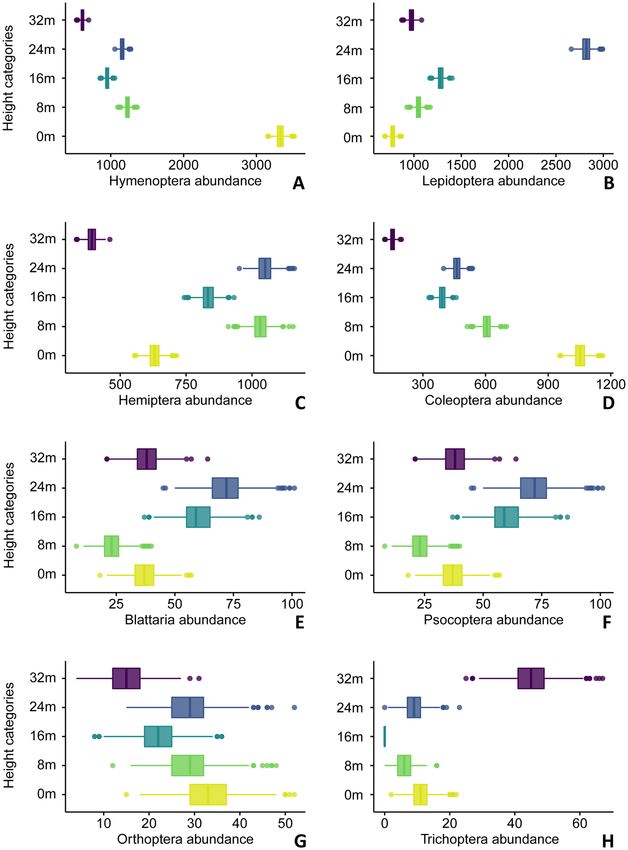
www.nature.com/scientificreports/
Appendix A). Therefore, we assumed that the total count from our samples represents the mean of a potential
5000 survey efforts with our approach. We used this approach strictly for visualization purposes to demonstrate
how megadiverse insects varied among different levels on the tower.
Second, to understand whether fly abundances varied at distinct heights of the tropical forest canopy gradient,
we used nonparametric Kruskal–Wallis tests, with the specimen count (abundance) of a family as the depend-
ent variable and the canopy height as the categorical independent variable. We utilized the complete specimen
database from field samples for abundance (total counts, n = 8386). When Kruskal–Wallis tests were significant,
we computed a multiple comparisons routine using a nonparametric procedure based on relative contrast effects
(nparcomp package in R74). We evaluated pairwise comparisons among groups using a Bonferroni adjusted
alpha value (0.05/10 = 0.005). To compare patterns of abundance across canopy heights with richness, we again
used a simulation routine. Because our species richness data were an accumulation of species occurrences across
heights, we simulated the variability of species richness if we were to resample traps 5000 times using identical
methods to those described for the insect orders. This approach yielded visualizations where, in some cases,
species richness was higher than abundance (e.g., Diptera, Tachinidae). We stress that the pattern is because the
abundance plots and analyses are based on the mean abundances of Diptera and associated families, whereas the
species richness plots are based on total species in the simulated datasets. Thus, the patterns among abundance
and richness plots are the important components of the approach. To highlight the variability of insect groups
across the five canopy heights, we created box plots using the ’ggpubr’ package in R75. When discussing the verti-
cal patterns found, we refer to a "peak" when the abundance or species richness at a given level is over 5% higher
than adjacent levels (for levels 8 m, 16 m, and 24 m) or at the adjacent superior or inferior level (respectively for
samples at the ground level and 32 m); otherwise, we consider a “plateau” across two levels.
Results
Objective one—variability of the insect community along a canopy height gradient. We iden-
tified a total of 37,778 insect specimens belonging to 18 orders at the five sampling levels (Supplementary Infor-
mation Table S1). The most abundant order of insects were the flies (16,600 specimens in the samples), followed
by hymenopterans (wasps, bees, and ants, 7279 specimens), moths and butterflies (6899), true bugs (3939), and
beetles (2670). The insect orders varied considerably among the trap heights (Fig. 1). Diptera, Hymenoptera,
and Coleoptera were more abundant at the ground level and less so at the highest levels of our sample (32 m)
(Fig. 1). At the same time, Lepidoptera and Hemiptera were more abundant in the upper levels of the tree canopy
(respectively, 24 m and 8–24 m, Fig. 1). For smaller orders, we noticed less clear visual patterns of differences
among heights—outside of Trichoptera, which were more abundant above the canopy (32 m), and Blattaria and
Psoptera, which appeared to be more abundant in the mid-portions of the canopy (16–24 m) (Fig. 1).
Objective two—variability of Diptera at distinct heights of the tropical forest canopy gradi‑
ent. The 16,600 Diptera specimens belong to 56 families (Supplementary Information Table S2) (Fig. 2). The
most abundant family were the Phoridae (3843 specimens in the samples), followed by Sciaridae (2066), Ceci-
domyiidae (1977), Psychodidae (1178), Dolichopodidae (935), Chironomidae (880), Tachinidae (833), Myce-
tophilidae (797), Tipulidae s.l. (738), and Ceratopogonidae (629). A total of 8386 fly specimens of 38 families
sampled were identified to morphospecies (or to a genus in the hyperdiverse family Phoridae), belonging to
856 species of 368 genera (Supplementary Information Table S3). Of the families identified to species, the most
species-rich was Tachinidae (166 species), followed by Mycetophilidae (101), Tipulidae s.l. (78), Dolichopodidae
(71), Drosophilidae (51), Lauxaniidae (46), Muscidae (41), Milichiidae (37), Stratiomyidae (32), and Chloro-
pidae (29). We compiled the cases in which the biology of the larvae or of the adult of the genera sampled was
known, providing a sketch of the vertical distribution of guilds of flies (Supplementary Information Table S4).
The Supplementary Material Table S5 has the complete dataset of insects identified at each level of the tower.
Overall, dipterans, as an order, were more abundant and species-rich at the ground level (0 m) and less so at
the upper canopy (32 m) (p-value < 0.001, Fig. 2, Supplementary Appendix A). This pattern was primarily driven
by Mycetophilidae (both abundance and richness), Tipulidae (both abundance and richness), and Phoridae
(abundance), each of which were significantly more abundant at the 0 m height than at other height categories
(p-value < 0.001, Supplementary Appendix A). On the other end of the gradient, Tachinidae and Dolichopodi-
dae were significantly more abundant and species-rich at the two highest trap locations (24–32 m) compared
with the ground level trap (0 m) (p-value = 0.001, Fig. 2). Patterns of species richness generally mirrored those
of abundance with two key exceptions. First, Dolichopodidae appears to have incongruence at 16 m between
species richness and abundance (Fig. 2). Further, Phoridae genus richness appears greater from 8 to 32 m rela-
tive to abundance values, suggesting these flies utilize varying niches at upper levels of the forest canopy with a
small population size (Fig. 2).
Discussion
Insect order abundance patterns. This study was designed to fill a gap in our knowledge on canopy
insect diversity by documenting the variability of the insect fauna across a vertical canopy gradient in a Central
Amazonian tropical forest. Our use of the 6 m Gressitt traps was amazingly productive for Diptera and assessed
a large number of rare and new flies—such as odiniids, possibly many new genera of phorids, large number of
species of lauxaniids, etc. The efficiency of the traps used in this study (as compared to the canopy Malaise traps
in the ZADBI p roject14,15) in good proportion seems due to the large interception surface of the 6 m traps with
two collector vials and to the fact that the tower platforms provide a floor for the traps, preventing flies from
escaping.
Scientific Reports | (2022) 12:1734 | https://doi.org/10.1038/s41598-022-05677-y 3
Vol.:(0123456789)www.nature.com/scientificreports/
Figure 1. (A–H) Bar charts of simulated abundance based on the total counts of sampled hexapod orders
across the canopy gradient (Diptera in Fig. 2). (A) Hymenoptera. (B) Lepidoptera. (C) Hemiptera. (D)
Coleoptera. (E) Blattaria. (F) Psocoptera. (G) Orthoptera. (H) Trichoptera.
Moreover, our sampling approach also combines the discrimination of the fauna at more levels in the for-
est and a much more extensive taxonomic study in Diptera, depicting in more detail the vertical structure of
abundance and species richness. In P anama10, ground level ("understory") samples included collecting from 0
to 3 m above the floor, while canopy ("lower canopy") combined the results of all samples from 3 to 35 m above
the ground—in our study subdivided, showing notable differences. Finally, their data for Diptera covers just
seven families, of which only four had more than ten specimens. Of 188 species of flies that they identified in
the tropical forest in Panama, 92 (49%) occur at the ground level, while 120 (64%) occur at the canopy and 50
(27%) above the canopy. Thus, our results are, overall, concordant with the Panama study.
It has been argued that the main driver for spatial and temporal distribution patterns is largely the availability
of resources18. In our case, this means that the vertical patterns of insect abundance would reflect how different
groups explore resources available in the vertical structure of the forest. In our study, the ground-level sample
individually has the highest insect abundance. However, over two-thirds of the insect abundance was collected
Scientific Reports | (2022) 12:1734 | https://doi.org/10.1038/s41598-022-05677-y 4
Vol:.(1234567890)www.nature.com/scientificreports/
in traps above the ground level. This suggests that the amount of food and other resources for flies at the ground
level may be more considerable than at any individual level. Still, the sum of resources (and range of resource
types) at all levels above the ground is higher than that at the ground level itself, illustrating the importance of
the upper canopy as a distinct set of habitats with varied niches for insects.
The vertical distribution of abundance was not the same across the 18 sampled insect orders (Supplementary
Information Table S1). Of 11 orders with more than ten sampled specimens, three have the highest abundance at
the ground level, including termites, collembolans, and psocopterans. For each, their abundance decreased away
from the ground towards the canopy. Four orders had a peak of abundance at the ground level, with a second
peak at 24 m—orthopterans, beetles, hymenopterans, and flies. True bugs (hemipterans) and neuropterans have
a 2-peaks abundance pattern (at 8 m and 24 m), while cockroaches and lepidopterans have a 1-peak abundance
pattern at the canopy (at 16 m or 24 m). Trichopterans (which have aquatic larvae) were the only group with a
peak of abundance at 32 m—probably using the open area above the canopy as an avenue for dispersal. The fact
that Blattaria, Hemiptera, Neuroptera, Trichoptera, and Lepidoptera have over 80% of their abundance above
the ground level is particularly remarkable.
Diptera family vertical abundance patterns. The combined abundance of flies at the four higher levels
of the tower compared with the abundance at the ground level—1.88—is smaller than the overall proportion of
insects between these same levels—2.23 (Supplementary Material Table S2). In other words, the upper canopy is
slightly more relevant, in terms of abundance, for some insect orders (such as the largely herbivorous moth and
butterfly fauna, and the cockroaches, bugs, and bugs the neuropteran predators, etc.) than it is for flies.
Taxon names are hubs of information, connecting different sources of data, including larvae and adult biol-
ogy. As we deepen the identification from order towards species, we add elements that may help discern and
explain patterns found. The assessment of the patterns of vertical abundance of different Diptera families is far
more complex (Fig. 3A–N; Supplementary Information Table S2). Only eight among 57 families of flies have a
single peak of abundance at the ground level. This includes groups with mycophagous larvae (Mycetophilidae),
predatory larvae living in the mud (Tabanidae), adult predators (Asilidae), groups with saprophagous larvae
(Micropezidae), and kleptoparasitic flies (Milichiidae). A two-peak pattern in which the ground level is one of
the peaks is seen in 16 other fly families. This includes groups that explore very different kinds of resources—e.g.,
hematophagous flies (Culicidae and Ceratopogonidae), predators (Empididae and Dolichopodidae), but espe-
cially phorids (with a wide variety of biologies). A single peak of abundance at 8 m or a 2-peak pattern involving
the 8 m level are found in only four families, possibly of flies associated with wood holes and tree trunks or of flies
that use the open area between the understory and the canopy to move around in the forest (e.g., the fly parasitoid
family Tachinidae). Some other less common patterns include the 2-peak 8/24 m pattern in Chloropidae and the
Clusiidae or the 2-peak 0/32 m pattern of the well-known hill-toppers of the family Sarcophagidae (that mate at
high places in the landscape). Sciaridae and Cecidomyiidae do not show a very clear pattern and have a more or
less regular distribution across the five levels. Overall, the combined abundance of flies at levels 16 m and 24 m
(the body of the canopy) is only slightly smaller (33.3%) than the abundance of flies at the ground level (34.7%).
The abundance patterns of the various insect orders and the fly families sampled at the ZF2 tower, in general,
concurs with the biology known for these groups. Our study, however, formally measures the relative importance
of the canopy fauna at different levels for each of the families, information not available in any previous study.
There were some notable surprises: over half of the abundance of crane flies and over one-third of the abundance
of fungus-gnats, for example (families connected mainly to resources available at the ground level), were found
above the ground. The astonishing 90.0% of abundance of clusiids, 92.6% of lauxaniids, 94.1% of tachinids, and
100% of syrphids at the four higher strata in the forest depict a much more significant proportion of canopy
fauna of these families than ever shown before.
Diptera vertical species‑richness patterns. Of the 856 species of flies of 38 families identified to the
species level in our study, 329 (38.4%) occurred at the ground level, 188 (22.0%) of which were exclusive to the
ground level (Fig. 3A–N; Supplementary Table S3). Similar numbers were obtained in Panama10, which com-
pared beta-diversity and found it to be much less significant. One major implication of these numbers is that if
insect sampling were made only at ground level, over 60% of the fauna would be missed. In other words, collect-
ing only at the ground level leads to a significant underestimation of the species diversity of a megadiverse order
of insects in the Amazon forest.
Ten of the 38 fly families sorted down to species have a species-richness peak at the ground-level, in some
cases with a 1-peak pattern (Mycetophilidae and Micropezidae) and some with a second peak in the canopy,
either at 16 m or at 24 m—Tipulidae s.l., Tabanidae, Empididae, Drosophilidae, Milichiidae, Stratiomyidae, and
Dolichopodidae. There are peaks at 8 m for only five families: Scatopsidae, Chloropidae, Clusiidae, Pipunculidae,
and Tachinidae—the latter two of parasitoids. A total of 14 other families have a single peak at the canopy (16 m
or 24 m). Of these, Lauxaniidae, Syrphidae, Muscidae, and Odiniidae have a 1-peak pattern, three families, as
mentioned, have another peak at 8 m, and eight families also have a peak at the ground level. The only families
with a species-richness peak above the canopy are Sarcophagidae and Tachinidae.
Vulnerability of the fauna. The distinctness and complexity of patterns of the canopy fauna, in some
cases with small populations, imply that it may be particularly vulnerable to disturbances by human activity. Cli-
mate change already has different impacts on the canopy and its fauna, including loss of biodiversity1. Our data
strongly corroborates previous reports10 that the taxonomic composition of the insect fauna is largely distinct
across the vertical structure of the forest and that the canopy harbors a set of species of its own. Selective log-
ging, in this context, removing larger trees, could negatively affect a significant part of the canopy fauna. Further
Scientific Reports | (2022) 12:1734 | https://doi.org/10.1038/s41598-022-05677-y 5
Vol.:(0123456789)Vol:.(1234567890)
Scientific Reports |
(2022) 12:1734 |
www.nature.com/scientificreports/
https://doi.org/10.1038/s41598-022-05677-y
Figure 2. (A, B) Sketch of a tropical forest and the ZF2 tower, with the distribution of Malaise traps (in grey) set at different heights of the tower. (A) Box plots representing the vertical
distribution of the mean abundance from the field collection. (B) Simulated species richness from the total species accumulation.
6www.nature.com/scientificreports/
Figure 3. (A–N) Vertical distribution patterns of the seven most abundant and/or most speciose Diptera
families sampled at the ZF2 tower. (A, B) Tachinidae. (C, D) Mycetophilidae. (E, F) Dolichopodidae. (G, H)
Tipulidae s.l. (I, J) Drosophilidae. (K, L) Lauxaniidae. (M, N) Phoridae. The abundance box plots are based on
the mean counts from the field collection, whereas the species richness boxplots are simulated data based on the
total species accumulation of families (or genus for Phoridae) across the canopy gradient.
careful studies should be performed to check the effects of selective logging on insect communities and whether
the practice is indeed a biodiversity-friendly approach. For the large-scale protection of tropical diversity, there
should be core areas of intact forest76,77, with all canopy strata conserved, which our results generally support.
Considering the huge pressure on the Amazon primary forest in recent y ears78, in some cases, even with
government support, the understanding of its biodiversity becomes a more urgent priority. This cannot be
achieved in a "vacuum of data"79. This paper fills part of this gap, demonstrating a rich and exclusive canopy
fauna and a complex system of vertical patterns of different groups of insects in the Amazon forest. Further, our
study raises an array of unanswered questions: the success or failure of conservation actions largely depends
on a better understanding of seasonality, phylogeography, abundance, species-richness and guild evolution of
the organisms that inhabit them. Concerted action must be made to protect tropical ecosystems—including all
canopy levels—against pervasive stressors, such as climate change, deforestation, fragmentation of the landscape,
and use of pesticides.
Received: 16 April 2021; Accepted: 17 January 2022
References
1. Nakamura, A. et al. Forests and their canopies: Achievements and horizons in canopy science. Trends Ecol. Evol. 32, 438–451
(2017).
2. Scheffers, B. R. et al. Microhabitats reduce animal’s exposure to climate extremes. Glob. Change Biol. 20, 495–503 (2014).
3. Lefsky, M. A. et al. Estimates of forest canopy height and aboveground biomass using ICESat. Geophys. Res. Lett. 32, L22S02 (2005).
4. Ellwood, M. D. F. & Foster, W. A. Doubling the estimate of invertebrate biomass in a rainforest canopy. Nature 429, 549–551 (2004).
5. Dial, R. et al. Arthropod abundance, canopy structure, and microclimate in a Bornean lowland tropical rain forest. Biotropica 38,
643–652 (2006).
6. Valencia, R. et al. High tree alpha-diversity in Amazonian Ecuador. Biodivers. Conserv. 3, 21–28 (1994).
Scientific Reports | (2022) 12:1734 | https://doi.org/10.1038/s41598-022-05677-y 7
Vol.:(0123456789)www.nature.com/scientificreports/
7. Stone, M. J. et al. Edge effects and beta diversity in ground and canopy beetle communities of fragmented subtropical forest. PLoS
ONE 13, e0193369 (2018).
8. Nadkarni, N. M. Diversity of species and interactions in the upper tree canopy of forest ecosystems. Am. Zool. 34, 70–78 (1994).
9. Stanton, D. E. et al. Rapid nitrogen fixation by canopy microbiome in tropical forest determined by both phosphorus and molyb-
denum. Ecology 100(9), e02795 (2019).
10. Basset, Y. et al. (eds) Arthropods of Tropical Forests. Spatio-Temporal Dynamics and Resource Use in the Canopy (Cambridge Uni-
versity Press, 2003).
11. Schowalter, T. D. et al. Post-hurricane successional dynamics in abundance and diversity of canopy arthropods in a tropical rain-
forest. Environ. Entomol. 46, 11–20 (2017).
12. Silva, R. R. & Brandão, C. R. F. Morphological patterns and community organization in leaf-litter ant assemblages. Ecol. Monogr.
80, 107–124 (2010).
13. McCaig, T., Sam, L., Nakamura, L. & Stork, N. E. Is insect vertical distribution in rainforests better explained by distance from the
canopy top or distance from the ground?. Biodivers. Conserv. 29, 1081–1103 (2020).
14. Floren, A. & Linsenmair, K. E. The influence of anthropogenic disturbances on the structure of arboreal arthropod communities.
Plant Ecol. 153, 153–167 (2001).
15. Adis, J. et al. Canopy fogging of an overstory tree—Recommendations for standardization. Ecotropica 4, 93–97 (1998).
16. Bar-Ness, Y. D. et al. Sampling forest canopy arthropod biodiversity with three novel minimal-cost trap designs. Aust. J. Entomol.
51, 12–21. https://doi.org/10.1111/j.1440-6055.2011.00836.x (2012).
17. Erwin, T. L. Canopy arthropod biodiversity: A chronology of sampling techniques and results. Rev. Peru. Entomol. 2, 71–77 (1990).
18. Floren, A. Sampling arthropods from the canopy by insecticidal knockdown. In Manual on Field Recording Techniques and Protocols
for All Taxa Biodiversity Inventories, Part 1 Vol. 8 (eds Eymann, J., Degref, J., Häuser, C. et al.) 158–172 (ABC Taxa, 2010).
19. Leather, S. R. (ed.) Insect Sampling in Forest Ecosystems (Blackwell Science, 2005).
20. Lowman, M., Moffett, M. & Rinker, H. B. A new technique for taxonomic and ecological sampling in rain forest canopies. Selbyana
14, 75–79 (1993).
21. Lowman, M. D., Kitching, R. L. & Carruthers, G. Arthropod sampling in Australian subtropical rain forest: How accurate are some
of the more common techniques?. Selbyana 17, 36–42 (1996).
22. Lowman, M. D., Schowalter, T. D. & Franklin, J. F. Methods in Forest Canopy Research (University of California Press, 2012).
23. Majer, J. D. & Recher, H. F. Invertebrate communities on Western Australian eucalypts—A comparison of branch clipping and
chemical knockdown procedures. Aust. J. Ecol. 13, 269–278. https://doi.org/10.1111/j.1442-9993.1988.tb00974.x (1988).
24. Ozanne, C. M. P. Techniques and methods for sampling canopy insects. In Insect Sampling in forest ecosystems (ed. Leather, S. R.)
146–165 (Blackwell, 2005).
25. Paarmann, W. & Stork, N. E. Canopy fogging, a method of collecting living insects for investigation of life history strategies. J. Nat.
Hist. 21, 563–566. https://doi.org/10.1080/00222938700770341 (1987).
26. Parker, G. G., Smith, A. P. & Hogan, K. P. Access to the upper forest canopy with a large tower crane. Bioscience 42, 664–670. https://
doi.org/10.2307/1312172 (1992).
27. Skvarla, M. J., Larson, J. L., Fisher, J. R. & Dowling, A. P. G. A review of terrestrial and canopy malaise traps. Ann. Entomol. Soc.
Am. 114(1), 27–47. https://doi.org/10.1093/aesa/saaa044 (2021).
28. Stork, N. E. Australian tropical forest canopy crane: New tools for new frontiers. Aust. Ecol. 32, 4–9. https://doi.org/10.1111/j.
1442-9993.2007.01740.x (2007).
29. Basset, Y. et al. IBISCA-Panama, a large-scale study of arthropod beta-diversity and vertical stratification in a lowland rainforest:
Rationale, study sites and field protocols. Bull. Inst. R. Sci. Nat. Belg. Entomol. 77, 39–69 (2007).
30. Basset, Y., Cizek, L. & Cuénoud, P. Arthropod diversity in a tropical forest. Science 338, 1481–1484. https://doi.org/10.1126/scien
ce.1226727 (2012).
31. Kitching, R. L. et al. The biodiversity of arthropods from Australian rainforest canopies: General introduction, methods, sites and
ordinal results. Aust. J. Ecol. 18, 181–191. https://doi.org/10.1111/j.1442-9993.1993.tb00442.x (1993).
32. Lindo, Z. & Winchester, N. N. Oribatid mite communities and foliar litter decomposition in canopy suspended soils and forest
floor habitats of western red cedar forests, Vancouver Island, Canada. Soil Biol. Biochem. 39, 2957–2966. https://doi.org/10.1016/j.
soilbio.2007.06.009 (2007).
33. Schowalter, T. D. Canopy arthropod communities in relation to forest age and alternative harvest practices in western Oregon.
For. Ecol. Manage 78, 115–125 (1995).
34. Southwood, T. R. E., Moran, V. C. & Kennedy, C. E. J. The assessment of arboreal insect fauna: Comparisons of knockdown sampling
and faunal lists. Ecol. Entomol. 7, 331–340. https://doi.org/10.1111/j.1365-2311.1982.tb00674.x (1982).
35. Stork, N. E. Guild structure of arthropods from Bornean rain forest trees. Ecol. Entomol. 12, 69–80. https://doi.org/10.1111/j.
1365-2311.1987.tb00986.x (1987).
36. Stork, N. E. et al. (eds) Canopy Arthropods (Chapman & Hall, 1997).
37. DeVries, P. J. Stratification of fruit-feeding nymphalid butterflies in a Costa Rican rain forest. J. Res. Lepid. 26, 98–108 (1988).
38. Hill, C. J., Gillison, A. N. & Jones, R. E. The spatial distribution of rain forest butterflies at three sites in North Queensland, Australia.
J. Trop. Ecol. 8, 37–46 (1992).
39. Medina, M. C., Robbins, R. K. & Lamas, G. Vertical stratification of flight by Ithomiinae butterflies (Lepidoptera: Nymphalidae)
at Pakitza, Manu National Park, Peru. In Manu—The Biodiversity of Southeastern Peru (eds Wilson, D. E. & Sandoval, A.) 211–216
(Smithsonian Institution, 1996).
40. DeVries, P. J., Murray, D. & Lande, R. Species diversity in vertical, horizontal, and temporal dimensions of a fruitfeeding butterfly
community in an Ecuadorian rainforest. Biol. J. Linn. Soc. 62, 343–364. https://d oi.o
rg/1 0.1 111/j.1 095-8 312.1 997.t b0163 0.x (1997).
41. DeVries, P. J., Murray, D. & Lande, R. Species diversity in vertical, horizontal, and temporal dimensions of a fruit-feeding butterfly
community in an Ecuadorian rain forest. Biol. J. Linn. Soc. 62, 343–364 (1997).
42. Beccaloni, G. W. Vertical stratification of ithomiine butterfly (Nymphalidae: Ithomiinae) mimicry complexes: The relationship
between adult flight height and larval host-plant height. Biol. J. Linn. Soc. 62, 313–341 (1997).
43. Schulze, C. H., Linsenmair, K. E. & Fiedler, K. Understorey versus canopy: Patterns of vertical stratification and diversity among
Lepidoptera in a Bornean Rain Forest. Plant Ecol. 153, 133–152. https://doi.org/10.1023/A:1017589711553 (2001).
44. Fordyce, J. A. & DeVries, P. J. A tale of two communities: Eotropical butterfly assemblages show higher beta diversity in the canopy
compared to the understory. Oecologia 181, 235–243. https://doi.org/10.1007/s00442-016-3562-0 (2016).
45. Santos, J. P., Iserhard, C. A., Carreira, J. Y. O. & Freitas, A. V. L. Monitoring fruit-feeding butterfly assemblages in two vertical strata
in seasonal Atlantic Forest: Temporal species turnover is lower in the canopy. J. Trop. Ecol. 33(5), 345–355 (2017).
46. Lourido, G. M., Motta, C. S., Graça, M. B. & Rafael, J. A. Diversity patterns of hawkmoths (Lepidoptera: Sphingidae) in the canopy
of an ombrophilous forest in Central Amazon, Brazil. Acta Amazon. 48, 117–125 (2018).
47. Araujo, P. F., Freitas, A. V. L., Gonçalves, G. A. S. & Ribeiro, D. B. Vertical stratification on a small scale: The distribution of fruit-
feeding butterflies in a semi-deciduous Atlantic forest in Brazil. Stud. Neotrop. Fauna Environ. 56, 10–39 (2021).
48. Charles, E. & Basset, Y. Vertical stratification of leaf-beetle assemblages (Coleoptera: Chrysomelidae) in two forest types in Panama.
J. Trop. Ecol. 21, 329–336. https://doi.org/10.1017/S0266467405002300 (2005).
49. Grimbacher, P. S. & Stork, N. E. Vertical stratification of feeding guilds and body size in beetle assemblages from an Australian
tropical rainforest. Aust. Ecol. 32, 77–85. https://doi.org/10.1111/j.1442-9993.2007.01735.x (2007).
Scientific Reports | (2022) 12:1734 | https://doi.org/10.1038/s41598-022-05677-y 8
Vol:.(1234567890)www.nature.com/scientificreports/
50. Floren, A. & Schmidl, J. (eds) Canopy Arthropod Research in Europe: Basic and Applied Studies from the High Frontier (Bioform
Entomology & Equipment, 2008).
51. Stork, N. E. et al. Vertical stratification of beetles in tropical rainforests as sampled by light traps in North Queensland, Australia.
Austral Ecol. 41(2), 168–178 (2015).
52. Tregidgo, D. J., Qie, L., Barlow, J., Sodhi, N. S. & Lee-Hong, L. S. Vertical stratification responses of an arboreal dung beetle species
to tropical forest fragmentation in Malaysia. Biotropica 42, 521–552 (2010).
53. Davis, A. J., Sutton, S. L. & Brendell, M. J. D. Vertical distribution of beetles in a tropical rainforest in Sulawesi: The role of the
canopy in contributing to Biodiversity. Sepilok Bull. 13 & 14, 59–83 (2011).
54. Heatwole, H. Changes in ant assemblages across an arctic treeline. Rev d’Entomol du Quebec 34, 10–22 (1989).
55. Roubik, D. W. Tropical pollinators in the canopy and understory: Field data and theory for stratum “preferences”. J. Ins. Behav. 6,
659–673. https://doi.org/10.1007/BF01201668 (1993).
56. Longino, J. T. & Colwell, R. K. Biodiversity assessment using structured inventory: Capturing the ant fauna of a tropical rain forest.
Ecol. Appl. 7, 1263–1277. https://doi.org/10.1890/1051-0761(1997)007[1263:BAUSIC]2.0.CO;2 (1997).
57. Vance, A. C. C., Smith, S. M., Malcolm, J. R., Huber, J. & Bellocq, M. I. Differences between forest type and vertical strata in the
diversity and composition of hymenopteran families and mymarid genera in Northeastern Temperate Forests. Environ. Entomol.
36, 1073–1083. https://doi.org/10.1603/0046-225X(2007)36[1073:DBFTAV]2.0.CO;2 (2007).
58. Hernández-Flores, J. et al. Effect of forest disturbance on ant (Hymenoptera: Formicidae) diversity in a Mexican tropical dry forest
canopy. Insect Conserv. Diver. 14(3), 393–402. https://doi.org/10.1111/icad.12466 (2020).
59. Roberts, H. R. Arboreal Orthoptera in the rain forest of Costa Rica collected with insecticide: A report on the grasshoppers
(Acrididae) including new species. Proc. Acad. Nat. Sci. Phila. 125, 46–66 (1973).
60. Rodgers, D. J. & Kitching, R. L. Vertical stratification of rainforest collembolan (Collembola: Insecta) assemblages: Description
of ecological patterns and hypotheses concerning their generation. Ecography 21, 392–400. https://doi.org/10.1111/j.1600-0587.
1998.tb00404.x (1998).
61. Krab, E. J., Oorsprong, H., Berg, M. P. & Cornelissen, J. H. C. Turning northern peatlands upside down: Disentangling microcli-
mate and substrate quality effects on vertical distribution of Collembola. Funct. Ecol. 24, 1362–1369. https://doi.org/10.1111/j.
1365-2435.2010.01754.x (2010).
62. Coots, C., Lambdin, P., Grant, J., Rhea, R. & Mockford, E. Vertical stratification and co-occurrence patterns of the psocoptera
community associated with Eastern Hemlock, Tsuga canadensis (L.) Carrière, in the Southern Appalachians. Forests 3, 127–136.
https://doi.org/10.3390/f3010127 (2012).
63. Wardhaugh, C. W. et al. Vertical stratification in the spatial distribution of the beech scale insect (Ultracoelostoma assimile) in
Nothofagus tree canopies in New Zealand. Ecol. Entomol. 31, 185–195 (2006).
64. Brown, B. V. et al. Comprehensive inventory of true flies (Diptera) at a tropical site. Commun. Biol. 1, 1–8 (2018).
65. Borkent, A. et al. Remarkable fly (Diptera) diversity in a patch of Costa Rican cloud forest: Why inventory is a vital science. Zootaxa
4402, 53–90 (2018).
66. Hebert, P. D. N. et al. Counting animal species with DNA barcodes: Canadian insects. Philos. Trans. R. Soc. Lond. Ser. B. 371,
20150333 (2016).
67. Basset, Y. et al. Arthropod distribution in a tropical rainforest: Tackling a four dimensional puzzle. PLoS ONE 10, e0144110 (2015).
68. MacArthur, R. H. Population ecology of some warblers of northeastern coniferous forests. Ecology 39, 599–619 (1958).
69. Higuchi, N. et al. Governos locais amazônicos e as questões climáticas globais 103 (INPA/edição dos autores, 2009).
70. Brown, B. V. Malaise trap catches and the crisis in Neotropical dipterology. Am. Entomol. 51, 180–183 (2005).
71. Gressitt, J. L. & Gressitt, M. K. An improved Malaise trap. Pacific Insects 4, 87–90 (1962).
72. van Achterberg, K. Can Townes type Malaise traps be improved? Some recent developments. Entomologische Berichten 69, 129–135
(2009).
73. R Core Team (2018). R: A language and environment for statistical computing. R Foundation for Statistical Computing, Vienna,
Austria. (Accessed 20 October 2021); https://www.R-project.org/.
74. Konietschke, F. (2011). nparcomp: nparcomp-package. R package version 1.0-1. (Accessed 20 October 2021); http://C RAN.R-proje
ct.org/package=nparcomp
75. Alboukadel Kassambara (2020). ggpubr: ’ggplot2’ Based Publication Ready Plots. R package version 0.3.0. (Accessed 20 October
2021); https://CRAN.R-project.org/package=ggpubr
76. Watson, J. E. M. et al. The exceptional value of intact forest ecosystems. Nat. Ecol. Evol. 2, 599–610 (2018).
77. Gibson, L. et al. Primary forests are irreplaceable for sustaining tropical biodiversity. Nature 478, 378–381 (2011).
78. Qin, Y. et al. Improved estimates of forest cover and loss in the Brazilian Amazon in 2000–2017. Nat. Sustain. 2, 764–772 (2019).
79. Gardner, T. A. et al. Predicting the uncertain future of tropical forest species in a data vacuum. Biotropica 39, 25–30 (2007).
Acknowledgements
The authors are deeply grateful to the support from the Projeto Museu na Floresta, a partnership program
between INPA and Kyoto University, through the Japan International Cooperation Agency, who built the ZF2
tower and recently took care of the tower maintenance.
Author contributions
Conceived and designed the experiments: J.A.R. Identified insect orders, Diptera families, and genera/species
within the families: D.S.A., B.V.B., R.A.R., D.M.A.G., M.I.P.A.B., A.M.B., R.S.C., C.J.B.C., M.S.C., RVPD, DAF,
GBF, HFF, LMF, FMG, MH, CJEL, KL, MATM, D.W.A.M., M.A.M., M.N.M., S.A.M., C.M.P., S.S.N., S.S.O., G.P.,
G.C.R., P.R.R., M.D.S., D.S., J.R.S., V.C.S., J.A.R. All authors in some extension contributed to the development
manuscript. Analyzed the data: E.M.W., D.S.A., B.V.B., D.B., J.A.R. Wrote the paper: D.S.A., B.V.B., E.M.J., J.A.R.,
D.B., E.M.W.
Funding
The results in this study were largely supported by funding from numerous agencies to the authors. DSA had
financial support from CNPq Grant #440549/2015-9 and from FAPESP Grants #2016/50369-9 and 2021/08713-
2; RSC is funded by a CNPq Grant #429984/2016-2); CJBdeC had a Conselho Nacional de Desenvolvimento
Científico e Tecnológico (CNPq) research Grant #309873/2016-9; DAF had a postdoctoral scholarship fund-
ing by CNPq/CAPES Grant #88887.473150/2020-00 to DAF; HFF had a FAPESP MSc scholarship Grant
#2019/27085-2; DMAG had a doctoral scholarship from Ministerio de Ciencia, Tecnología e Innovación de
Colombia (MINCIENCIAS) and the Department of Sucre (Convocatoria No 678 de 2014, Capitulo 2 Doctorado
Exterior); CJEL received financial support from CNPq Grant #302751/2019-0); MATM had a CNPq research
Scientific Reports | (2022) 12:1734 | https://doi.org/10.1038/s41598-022-05677-y 9
Vol.:(0123456789)www.nature.com/scientificreports/
Grant #435090/2018-6; MAM was supported by CAPES PhD scholarships; MNM was supported by Coordi-
nation for the Improvement of Higher Education Personnel (CAPES) fellowship Grant #PNPD 201312820;
MSC is a research productivity fellow from CNPq (Proc. #303414/2018-9) and Cientista do Nosso Estado fel-
low from Fundação Carlos Chagas Filho de Amparo à Pesquisa do Estado do Rio de Janeiro (FAPERJ Grant
E-26/202-875/2017); SSN had a CNPq research Grant #403165/2016-4, a fellowship #309192/2018-8 and FAPESP
research grant #2016/50387-7; SSO CNPq #428471/2016-1 FAPESP #2012/51577-3; #2014/08447-7; CAMP had
a CNPq research fellowship Grant #308951/2018-2 and financial support from Fundação Carlos Chagas Filho
de Amparo à Pesquisa no Estado do Rio de Janeiro (FAPERJ) Grant #E-26/200.078/2019; JAR had funding
from Instituto Nacional de Pesquisas da Amazônia (INPA), Conselho Nacional de Desenvolvimento Cientí-
fico e Tecnológico (CNPq) #300305/2007-9, #300997/2016-7, #440423/2015-5, #443641/2020-0, Rede Bionorte
#407.627/2013-8, #405.630/2016-6, Fundação de Amparo à Pesquisa do Estado do Amazonas #06200645/2017,
PRONEX #1437/2007, DS had a scholarship FAPESP Grant #2017/16305-6; JRS was supported by CAPES PhD
scholarships; P.R.R. was supported by a postdoctoral fellowship from the CAPES/CNPQ PROTAX II—Grant
#440482/2015-1. BVB is grateful to Esther Chao, Diane Naegele, Victoria Dean, Gary and Marianne Wallace,
and Chris Conlan for funding his tropical work.
Competing interests
The authors declare no competing interests.
Additional information
Supplementary Information The online version contains supplementary material available at https://doi.org/
10.1038/s41598-022-05677-y.
Correspondence and requests for materials should be addressed to D.S.A.
Reprints and permissions information is available at www.nature.com/reprints.
Publisher’s note Springer Nature remains neutral with regard to jurisdictional claims in published maps and
institutional affiliations.
Open Access This article is licensed under a Creative Commons Attribution 4.0 International
License, which permits use, sharing, adaptation, distribution and reproduction in any medium or
format, as long as you give appropriate credit to the original author(s) and the source, provide a link to the
Creative Commons licence, and indicate if changes were made. The images or other third party material in this
article are included in the article’s Creative Commons licence, unless indicated otherwise in a credit line to the
material. If material is not included in the article’s Creative Commons licence and your intended use is not
permitted by statutory regulation or exceeds the permitted use, you will need to obtain permission directly from
the copyright holder. To view a copy of this licence, visit http://creativecommons.org/licenses/by/4.0/.
© The Author(s) 2022
Scientific Reports | (2022) 12:1734 | https://doi.org/10.1038/s41598-022-05677-y 10
Vol:.(1234567890)You can also read