Using syndromic measures of mortality to capture the dynamics of COVID-19 in Java, Indonesia, in the context of vaccination rollout - BMC Medicine
←
→
Page content transcription
If your browser does not render page correctly, please read the page content below
Djaafara et al. BMC Medicine     (2021) 19:146
https://doi.org/10.1186/s12916-021-02016-2

 RESEARCH ARTICLE                                                                                                                                  Open Access

Using syndromic measures of mortality to
capture the dynamics of COVID-19 in Java,
Indonesia, in the context of vaccination
rollout
Bimandra A. Djaafara1,2* , Charles Whittaker1, Oliver J. Watson1, Robert Verity1, Nicholas F. Brazeau1, Widyastuti3,
Dwi Oktavia3, Verry Adrian3, Ngabila Salama3, Sangeeta Bhatia1, Pierre Nouvellet1,4, Ellie Sherrard-Smith1,
Thomas S. Churcher1, Henry Surendra2,5, Rosa N. Lina2, Lenny L. Ekawati2, Karina D. Lestari2, Adhi Andrianto2,
Guy Thwaites6,7, J. Kevin Baird2,7, Azra C. Ghani1, Iqbal R. F. Elyazar2 and Patrick G. T. Walker1

  Abstract
  Background: As in many countries, quantifying COVID-19 spread in Indonesia remains challenging due to testing
  limitations. In Java, non-pharmaceutical interventions (NPIs) were implemented throughout 2020. However, as a
  vaccination campaign launches, cases and deaths are rising across the island.
  Methods: We used modelling to explore the extent to which data on burials in Jakarta using strict COVID-19
  protocols (C19P) provide additional insight into the transmissibility of the disease, epidemic trajectory, and the
  impact of NPIs. We assess how implementation of NPIs in early 2021 will shape the epidemic during the period of
  likely vaccine rollout.
  Results: C19P burial data in Jakarta suggest a death toll approximately 3.3 times higher than reported. Transmission
  estimates using these data suggest earlier, larger, and more sustained impact of NPIs. Measures to reduce sub-
  national spread, particularly during Ramadan, substantially mitigated spread to more vulnerable rural areas. Given
  current trajectory, daily cases and deaths are likely to increase in most regions as the vaccine is rolled out.
  Transmission may peak in early 2021 in Jakarta if current levels of control are maintained. However, relaxation of
  control measures is likely to lead to a subsequent resurgence in the absence of an effective vaccination campaign.
  Conclusions: Syndromic measures of mortality provide a more complete picture of COVID-19 severity upon which
  to base decision-making. The high potential impact of the vaccine in Java is attributable to reductions in
  transmission to date and dependent on these being maintained. Increases in control in the relatively short-term will
  likely yield large, synergistic increases in vaccine impact.
  Keywords: COVID-19, Modelling, Indonesia, Non-pharmaceutical interventions, Vaccinations, Surveillance

* Correspondence: bimandra.djaafara15@imperial.ac.uk
1
 MRC Centre for Global Infectious Disease Analysis and the Abdul Latif
Jameel Institute for Disease and Emergency Analytics, School of Public
Health, Imperial College London St Mary’s Campus, Norfolk Place, London
W2 1PG, UK
2
 Eijkman-Oxford Clinical Research Unit, Jakarta, Indonesia
Full list of author information is available at the end of the article

                                       © The Author(s). 2021 Open Access This article is licensed under a Creative Commons Attribution 4.0 International License,
                                       which permits use, sharing, adaptation, distribution and reproduction in any medium or format, as long as you give
                                       appropriate credit to the original author(s) and the source, provide a link to the Creative Commons licence, and indicate if
                                       changes were made. The images or other third party material in this article are included in the article's Creative Commons
                                       licence, unless indicated otherwise in a credit line to the material. If material is not included in the article's Creative Commons
                                       licence and your intended use is not permitted by statutory regulation or exceeds the permitted use, you will need to obtain
                                       permission directly from the copyright holder. To view a copy of this licence, visit http://creativecommons.org/licenses/by/4.0/.
                                       The Creative Commons Public Domain Dedication waiver (http://creativecommons.org/publicdomain/zero/1.0/) applies to the
                                       data made available in this article, unless otherwise stated in a credit line to the data.
Djaafara et al. BMC Medicine    (2021) 19:146                                                                                       Page 2 of 13

Background                                                                Indonesia initiated a nationwide vaccination campaign
As of 28 April 2021, Indonesia has reported the highest                   [7, 8]. The campaign initially involved vaccinating health
number of confirmed COVID-19 cases (1,657,035) and                        care workers but was extended to the elderly and public
deaths (45,116) among Southeast Asian countries [1].                      workers on 17 February 2021 [9].
Cases were first reported in West Java province, on the                     Understanding the trajectory of the epidemic in Java
island of Java, on 2 March 2020, amid concern that the                    has been challenging. As in many countries [10, 11],
disease had circulated widely before [2, 3]. The city of                  testing constraints in Indonesia have limited the extent
Jakarta (the capital of Indonesia) subsequently became                    to which officially confirmed cases reflect underlying
the epicentre of the country’s epidemic, following which                  trends. Similar concerns exist for mortality data, based
the disease spread throughout the island.                                 upon the high numbers of individuals exhibiting
   Non-pharmaceutical interventions (NPIs) have in-                       COVID-19 like symptoms who die before receiving a
cluded national social distancing measures encouraging                    diagnosis [12, 13]. In Jakarta, such individuals are buried
people to work, study, and worship at home (March 15)                     under strict COVID-19 protocols (C19P). Here, we use
[4]; mandated social distancing measures implemented                      mathematical modelling approaches incorporating these
on April 10 as part of a lockdown, named Pembatasan                       data, and other measures of suspected mortality, to bet-
Sosial Berskala Besar or PSBB in Indonesian [4]; and a                    ter understand the dynamics and burden of the epidemic
ban on domestic travel during the month of Ramadan                        experienced across Java to date, evaluate the impact of
(April 24 to June 7) [5]. In June, Indonesia entered the                  control measures, and understand how these past ac-
Adaptasi Kebiasaan Baru (AKB or ‘new normal’) period                      tions will shape future burden and vaccine impact.
where some restrictions were lifted (Fig. 1a and b) [4].
   During this AKB period, the reported incidence of                      Methods
COVID-19 cases and deaths increased across Indonesia,                     Assessing SARS-CoV-2 transmissibility over time in
with community transmission evident across the six                        Jakarta
provinces of Java (Fig. 1c and d). PSBB was subsequently                  Daily numbers of confirmed COVID-19 cases, deaths,
reimposed in mid-September for 4 weeks in Jakarta in                      and C19P funerals [14] were used to reconstruct daily
response to pressures on healthcare facilities across the                 incidence of symptom onset, using delay distributions
city [6]. Cases and deaths continued to rise in early                     between symptom onset and case reporting or death de-
2021, prompting further restrictions in districts across                  rived from individual patient data obtained from the
the island from January 11 [7]. On 13 January 2021,                       Jakarta Department of Health (Additional file 1: Figure

 Fig. 1 Burden of COVID-19 and timeline of interventions in Indonesia (data up to 7 December 2020). a Daily number of reported COVID-19 cases.
 b Daily number of reported COVID-19 deaths. c Total reported COVID-19 cases at province level in Java island. d Total reported COVID-19 deaths
 at province level in Java island
Djaafara et al. BMC Medicine (2021) 19:146 Page 3 of 13
S1 [15–26]). For each data source (cases, deaths, and Assessing the current province-level spread of the
C19P funerals), 100 reconstructed time-series of daily in- pandemic in Java and generating future scenarios
cidence of symptom onset were generated, with esti- To estimate the recent trajectory of the epidemic and
mates also adjusted for right-censoring in individuals current cumulative levels of spread within each province,
where outcomes had yet to occur (Additional file 2: S2). we adapted an existing modelling framework allowing
These reconstructed time series were translated into the relationship between mobility and transmission to
estimates of the daily effective reproduction number vary over time [10]. This allows us to capture the ob-
(Rt,case for cases, Rt,death for deaths, and Rt,funeral for fu- served decoupling between aggregated movement pat-
nerals) in Jakarta using EpiEstim [27, 28]. This package terns and burden in the ‘new normal’ period and
estimates Rt using a branching process-based estimator simulate scenarios of future spread within each province.
that incorporates information on the serial interval dis- We fit this modelling framework both to officially re-
tribution and dates of onsets of symptoms. Correlations ported COVID-19 deaths, as well as estimated suspected
between estimated Rt and the average daily changes in deaths, which include deaths of probable cases (i.e., pa-
non-residential mobility [29] were assessed based on tients with clinical criteria or chest imaging suggestive of
1000 posterior samples from each estimated Rt time COVID-19), which have been published by World
series and compared using Pearson’s correlation coeffi- Health Organization (WHO) Indonesia [4]. As the pub-
cient formula. lished suspected deaths data are only available on a
weekly basis between 1 June to 29 November 2020, we
augmented the data to reflect the entire time-period of
Modelling subnational COVID-19 spread across Java the epidemic based upon the proportion of all suspected
We developed a district-level metapopulation model to deaths (i.e., probable and confirmed) that were con-
explore the expected spread of COVID-19 across the is- firmed by each province in the period covered by the
land of Java (Additional file 2: S5 [15–26]). For each dis- WHO reports (Additional file 2: S6 [15–26]).
trict, stochastic differential equations representing a Our future scenarios are projected based on a future
Susceptible-Exposed-Infected-Recovered (SEIR) model ‘reproduction number under control’, Rc, defined simi-
were implemented. Movement matrices were derived larly to R0 as the average number of secondary infections
from anonymized mobile phone data, with separate within an entirely susceptible population but incorporat-
matrices calculated for the high-migration period of ing the impact of NPIs (and, equivalently, Rt but not in-
Ramadan. Disease severity parameters were adjusted to corporating the effects of population-level immunity
account for the demography of each district. Transmissi- such that R0 > Rc > Rt). We evaluated three scenarios: a
bility of the virus over time was calculated under the as- ‘current trajectory’ scenario (where the current trajectory
sumption that the relationship between mobility and Rt of the epidemic continues with approximated Rc = 1.25),
observed in Jakarta was informative across the rest of a ‘suppression’ scenario (where the transmission in the
the island, exploring multiple assumptions about the population is assumed to be immediately suppressed
transmissibility of COVID-19 in rural districts relative to with Rc = 0.75) and an ‘unmitigated’ scenario (where the
urban districts (Additional file 1: Table S3 [15–26]). We epidemic was assumed to be uncontrolled with Rc =
simulated five different scenarios to assess the impact of 2.00). Our first set of projections were generated from
restrictions (namely PSBB and Ramadan movement re- September 2 onwards [30], at a time where policymakers
strictions) on COVID-19 deaths and hospitalisation rates were attempting to understand the potential benefits of
across Java (Table 1). the implementation of further NPIs, such as the
Table 1 Metapopulation model simulation scenarios (one baseline scenario and four counterfactual scenarios)
Scenario Details
name
Baseline Movement from a district is assumed to reduce according to reductions in movement within a district scaled by an odds ratio of 2
to reflect assumed lower likelihood of travel outside a district relative to travel within a district.
Ramadan 1 No movement reductions between districts during the Ramadan and Eid festivals period and the Rt values during the period were
assumed to be similar to the baseline scenario.
Ramadan 2 No movement reductions between districts during the Ramadan and Eid festivals period and the Rt values during the period were
assumed to be 75% of each district R0,i.
Ramadan 3 No movement reductions between districts during the Ramadan and Eid festivals period and the Rt values during the period were
assumed to be the same as each district R0,i.
Unmitigated No interventions assumed which implies no movement reductions over all period of simulations with the Rt values to be the same
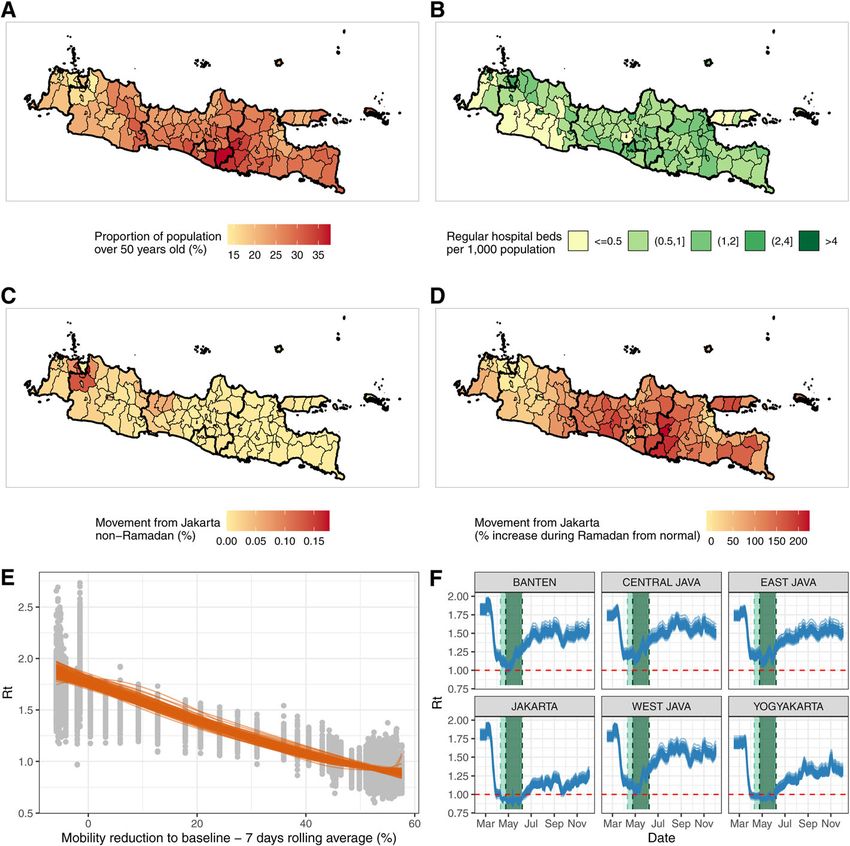
as each district R0,i over the period of simulations.Djaafara et al. BMC Medicine (2021) 19:146 Page 4 of 13 reimposition of PSBB in Jakarta, which was then sched- number of lives lost, and number of lives that remain to uled to be implemented on September 14 [6], in the be saved is likely to change incrementally by month ac- context of no vaccine yet being any available. These sce- cording to the same future scenarios (i.e., current mitiga- narios evaluated the potential trajectory of the epidemic tion, suppression and unmitigated), relative to an throughout 2021, including the impact of a ‘return-to- unmitigated epidemic from the date of our projection (7 normal’ (Rc = 2.00) once burden had returned to low- December 2020). levels (median of simulated trajectories reached less than 7 cumulative deaths over 7 days period). Our current set Results of projections are generated from December 7 and in Understanding initial establishment, transmission, and the context of an imminent vaccine campaign. Given the dynamics of SARS-CoV-2 in Jakarta large remaining uncertainties in rollout and effective- Figure 2a shows the daily reported cases, deaths, test ness, we do not incorporate any role of the vaccine. In- positivity ratios, and funerals with C19P in Jakarta, stead, we aim to understand how different scenarios transformed into inferred dates of symptom onset (Fig. involving NPIs over the next few weeks and months will 2b) using the relevant delay distributions. We estimate shape the potential longer-term effectiveness of future that 31 (22–41 95% CrI) and 124 (107–139 95% CrI) strategies in which vaccines will likely feature as a major confirmed deaths and C19P funerals (assuming all fu- component. To do this, we evaluate how both the nerals represent deaths due to COVID-19) had symptom Fig. 2 Temporal trends of cases, deaths, C19P funerals and respective estimates of Rt relative to the timing of intervention measures. Light green shaded areas denote periods of PSBB whilst the dark green shaded areas represent the period of Ramadan domestic travel restrictions. a Daily reported cases, deaths, and C19P funerals in Jakarta. Black line denotes the daily test positivity ratio. b Estimated frequency of symptom onset date of reported cases, deaths, and C19P funerals. Each bar represents the median daily frequency of 100 stochastic reconstructions. c Coloured lines and regions show, respectively, median and 95% CrI of estimated Rt (left y-axis) based on the reconstructed data (cases, deaths or C19P funerals). Grey areas denote periods where the estimated median Rt is above 1. Black lines and dots denote average changes in non-residential mobility (right y-axis). d The relationship and correlation coefficient between the estimated Rt and the average non-residential mobility reduction (up to 4 June 2020 or before the lifting of the first PSBB)
Djaafara et al. BMC Medicine   (2021) 19:146                                                                  Page 5 of 13

onset occurring before 2nd March when COVID-19 was             comparatively well-resourced Jakarta setting (2.22 hos-
first identified in Indonesia. We estimate 10,950 (7530–       pital beds per thousand population) to the poorer, more
14,040 95% CrI) infections based on confirmed deaths or        rural setting of Tasikmalaya in West Java (0.18 beds per
42,100 (36,280–47,570 95% CrI) based on C19P funerals          thousand population) (Fig. 3b). Patterns of between-
(reflecting an assumption that all undiagnosed individ-        district mobility outside of the window of the pandemic,
uals provided with a C19P funeral would have tested            estimated using mobile phone data over the period of 1
positive) had occurred in Jakarta by March 2.                  May 2011–30 April 2012, highlight the extent to which
   Reported cases in Jakarta appear to indicate two epi-       these settings are connected. Between-district connectiv-
demic peaks to date (around mid-April and mid-                 ity is particularly high during the Ramadan period, with
September, when PSBB was imposed), with the number             large-scale movements from densely populated Jakarta
of cases reported during the second peak far higher than       to other more rural regions with lower availability of
the first (Fig. 2b). However, the test-positivity rate de-     healthcare (Fig. 3c, d). Applying our modelled relation-
clined in the first half of 2020, indicating increased test-   ship between mobility and Rt obtained from the Jakarta
ing rates and case-ascertainment, which complicates the        C19P funeral data (Fig. 3e) to trends in mobility data
interpretation of trends based on case data alone. In-         from the remaining provinces in Java suggests large re-
deed, data on C19P funerals suggest that the first peak        ductions in transmission in all provinces coinciding with
in infections likely occurred in mid-March and that in-        the first PSBB period (Fig. 3f). However, they also sug-
fection levels during the second peak were at levels com-      gest that measures were sufficient to bring Rt below 1
parable to their initial peak.                                 for a sustained period only in Jakarta and Yogyakarta.
   Our branching-process-based estimates of Rt support         Increases in mobility occurred either during early May
the substantial impact of NPIs when applied to all three       (Banten, West Java, Central Java, and East Java) or
metrics (Fig. 2c). We estimate Rt to be between 1.5 and        alongside the establishment of the AKB in June (Jakarta
2.5 initially, subsequently declining to below 1 during        and Yogyakarta), leading to corresponding increases in
the first PSBB period, followed by a more recent increase      our estimates of Rt (Fig. 3f).
to slightly above 1 as Jakarta entered the transitional           These estimates were integrated into our meta-
PSBB in early June. The reimposition of the second             population model (Fig. 4a). Estimates of deaths in the
PSBB in September also brought the Rt to below 1. Fig-         baseline scenario were consistent with observed qualita-
ure 2d shows a strong and significant correlation be-          tive patterns prior to the shift to the AKB phase of the
tween Rt estimates with observed mobility patterns as          epidemic in early June. The epicentre shifted over time
measured by Google Mobility Reports (0.91, 0.72, and           from Jakarta to satellite towns and other provincial capi-
0.92 for cases, deaths, and C19P funerals, respectively,       tals and with Yogyakarta remaining least affected. Our
all with p < 0.001) observed before the lifting of the first   baseline scenario’s median deaths fall within the range of
PSBB, though showing little correlation after the lifting      cumulative confirmed and suspected deaths up to 31
of the first PSBB (Additional file 1: Figure S3 [15–26]).      May 2020 and the number of confirmed and suspected
Estimates based upon funeral trends support a more             deaths between May 13 and May 31, 2020, in most prov-
rapid, larger, and more sustained impact of interventions      inces (Table 2). Total suspected deaths fell within the
than those based upon case reporting. The correlation          model’s uncertainty bounds for most provinces except
with within-city mobility is lowest for the deaths data,       Jakarta and Central Java (Table 2).
where substantial variation in day-to-day death reporting         The scenarios estimates are consistent with reductions
leads to more unstable Rt estimates over time. Calculat-       in contact rates serving to reduce spread, reduce health-
ing the correlation between mobility and Rt before and         care demand, and avert mortality prior to AKB phase: an
after the AKB period suggests a decoupling between             estimated 57,000 (24,800–105,400, 95% UI) deaths
transmission and mobility, whereby estimates of Rt dur-        averted when compared to an effectively unmitigated
ing periods of equivalent levels of mobility during AKB        epidemic with Rt = 2 throughout this period (which we
are lower than estimates obtained before AKB.                  estimate would have resulted in 59,900 (26,800–112,800,
                                                               95% UI deaths). These numbers do not consider the ef-
Understanding COVID-19 risk and subnational spread of          fects of healthcare services becoming overwhelmed (as
SARS-CoV-2 across Java                                         shown by the negative values of the median number of
Substantial variations exist across the island in terms of     hospital beds available per COVID-19 case needing hos-
demography, healthcare capacity, and between-district          pitalisation under the unmitigated epidemic scenario;
mobility. The proportion of individuals over the age of        Fig. 4c) on both direct and indirect mortality, an impact
50 is typically higher (26%) in rural districts than urban     which would likely have been sizable given the wider
ones (19%) (Fig. 3a). There are also substantial dispar-       spread to more rural settings with more scarce health-
ities in healthcare availability, ranging from the             care provision in our unmitigated scenario (Fig. 4d, e).
Djaafara et al. BMC Medicine (2021) 19:146 Page 6 of 13
Fig. 3 Key factors that are affecting the spread and severity of COVID-19 epidemic in Java, Indonesia. a Proportion of the population aged over
50 years old at the district level. b Number of regular hospital beds per one thousand population at the district level. c Proportion of Jakarta
residents who spent their day in other districts in Java during a non-Ramadan period. d Increased proportion of people of Jakarta who spent
their day in other districts in Java during Ramadan compared to the non-Ramadan period. e The relationship between the estimated Rt values
based on C19P funerals data and average reduction in non-residential mobility in Jakarta using data only before the lifting of the first PSBB. Grey
dots represent 100 samples of Rt values. Orange lines show the modelled smoothing spline relationship between 100 samples of Rt values and
mobility reduction. f Extrapolations of Rt values in provinces in Java based upon Google Mobility trends for each province and the 100 sampled
smoothing splines in Fig. 3e (orange lines). Light green shaded areas denote periods of PSBB whilst the dark green shaded areas represent the
period of Ramadan domestic travel restrictions
Our baseline scenario increasingly over-predicts deaths reimplementation of PSBB could largely prevent capacity
in most provinces during the AKB. This is in line with from being exceeded but would not prevent a subsequent
our results suggesting a decoupling of within-province wave if such control was not maintained.
mobility from virus transmissibility over that period. Subsequently, between our two sets of simulations (2
September 2020 and 7 December 2020), both confirmed
Estimating current COVID-19 burden, modelled future deaths and our inferred estimates of total suspected
scenarios, and estimated vaccines impact in Java deaths increased from 5108 to 11,370 and 12,254 to 26,
Our projections generated 2 September 2020 [30] (Add- 206, respectively, across Java. At the island level, the esti-
itional file 1: Figure S12 [15–26]) suggested that, whilst Rt mated attack rates on both time points increased from
was well below that observed at the beginning of the epi- 1.21 to 2.57% and 2.95 to 6.03% based on confirmed
demic, this was driven primarily by the impact of control deaths and assuming all suspected deaths as COVID-19
measures rather than the accumulation of population- deaths, respectively (Fig. 5a). At the province level, esti-
level immunity. As a result, in the absence of additional mates of attack rate and total burden from COVID-19
control measures, death rates were likely to rise for the re- differ quite significantly, with Jakarta accumulating the
mainder of the year in all provinces, pushing all provinces highest attack rates in the region by 7 December 2020
beyond available hospital capacity. We found that (Fig. 5b; Additional file 1: Table S5 [15–26]). In allDjaafara et al. BMC Medicine (2021) 19:146 Page 7 of 13 Fig. 4 Metapopulation model simulation results. a Comparison of model simulations in the baseline scenario (red lines and their shaded 95% uncertainties ranges) and unmitigated scenario (yellow lines and their shaded 95% uncertainties ranges) and daily confirmed (solid black lines) and suspected (dashed black lines) deaths from COVID-19. b Model simulations in five different scenarios: (1) baseline scenario as shown in a, (2) Ramadan counter-factual 1 where it is assumed that there is no movement restrictions during the Ramadan period and Rt values are similar to the baseline scenario, (3) Ramadan counter-factual 2 where it is assumed that there is no movement restrictions during the Ramadan period and Rt values are 75% of each district’s R0 value, (4) Ramadan counter-factual 3 where it is assumed that there are no movement restrictions during the Ramadan period and Rt values are each district’s R0 value, and (5) unmitigated scenario where no interventions since the beginning of the epidemic are assumed. c Median hospital beds availability per severe COVID-19 case over time based on different simulation scenarios. d Proportion of people infected based on the actual scenario up to 31 May 2020 (before AKB/the ‘new normal’) at the district level. e Proportions of people infected based on the unmitigated scenario up to 31 May 2020 (before AKB) at the district level. Light green shaded areas denote periods of PSBB whilst the dark green shaded areas represent the period of Ramadan domestic travel restrictions provinces and based on models fitted to either suspected across the island continuing to grow throughout the first or confirmed deaths, there were consistent increases of half of the 2021 irrespective of whether reported or sus- around 2–3 times on the province-level attack rate from pected mortality are more reflective of true direct 2 September to 7 December 2020. However, as seen at COVID-19 mortality. In this scenario, with future Rc = the island level, discrepancies between the estimated at- 1.25, the epidemic would be projected to peak earliest in tack rates based on the model fitted to suspected deaths Jakarta, driven by the higher degree of population-level and confirmed deaths data were still observed at the immunity implied by the higher cumulative attack rate province level, with the highest difference observed in to date. This peak’s timing was sensitive to the mortality Jakarta. metric the model is calibrated to, with projected peaks Projections of future scenarios from December 2020 occurring early in 2021 for a current scenario based (Fig. 5c; and Additional file 1: Figure S13 [15–26] for upon suspected deaths and towards the end of the first province-level breakdown), incorporating these changes quarter of 2021 based upon reported deaths (Fig. 5c; and in estimated attack rate and extrapolating current trends Additional file 1: Figure S13 [15–26]). Subsequently to of Rc, leads to the projected daily incidence of mortality these simulations, the incidence of COVID-19 deaths in
Djaafara et al. BMC Medicine          (2021) 19:146                                                                                            Page 8 of 13

Table 2 Total number of estimated deaths based on model simulations of the baseline and unmitigated scenario
Province     Confirmed            Suspected            Baseline      Confirmed     Suspected deaths        Baseline       Unmitigated        Averted
             deaths May 13–       deaths May 13–       model         deaths up     up to May 31            model          counterfactual     deaths up to
             31 (WHO              31 (WHO              scenario      to May 31     (provincial data        scenario       deaths up to       May 31
             Indonesia            Indonesia            deaths        [14, 31]      collated by             deaths up      May 31             (unmitigated–
             situation report     situation report     May 13–                     KawalCOVID19            to May 31                         baseline)
             10 [4])              10 [4])              31                          [32])
Jakarta      74                   447                  158 (47–      520           2435                    810 (292–      16,356 (7896–      15,560 (7567–
                                                       333)                                                1777)          21,593)            19,691)
West Java    46                   351                  197 (55–      135           653                     525 (149–      19,733 (5682–      19,151 (5516–
                                                       525)                                                1368)          39,876)            38,400)
Central      4                    269                  88 (36–       66            666                     203 (67–       6321 (2147–16,     6068 (2056–15,
Java                                                   216)                                                511)           052)               485)
Yogyakarta 0                      1                    2 (0–8)       9             29                      6 (1–33)       401 (138–1097)     397 (132–
                                                                                                                                             1088)
East Java    241                  458                  437 (98–      395           1127                    1091 (226–     12,182 (3625–      10,997 (3277–
                                                       944)                                                2646)          20,800)            18,102)
Banten       13                   47                   82 (20–       67            332                     229 (66–       7302 (2180–14,     7079 (2111–14,
                                                       224)                                                711)           732)               141)
Java island 378                   1638                 983 (360–     1192          5242                    2912           59,896 (26,787–    57,030 (24,
total                                                  1930)                                               (1109–         112,795)           843–105,378)
                                                                                                           5851)
Values inside the brackets denote 95 percentile range of simulations. Suspected deaths are a combination of confirmed and probable COVID-19 deaths

Jakarta peaked in late January, prior to the rollout of the                     we estimate if such control measures are now lifted. This
vaccine to the elderly in the province (Additional file 1:                      also highlights the substantial remaining incremental
Figure S15 [15–26]), aligning more closely to our projec-                       value of the vaccination campaign (Fig. 6c).
tions based upon these funeral data than those based upon
confirmed deaths alone. Jakarta has also seen the largest                       Discussion
and most steady subsequent decline of all provinces in                          Our analysis uses C19P funeral data in Jakarta to high-
Java (Additional file 1: Figure S16 [15–26]), supporting                        light the considerable benefits of using syndromic mea-
our model result that population-based immunity due to                          sures of COVID-19 mortality to not only better measure
the mature stage of the epidemic is having the largest im-                      the past but also to guide the future. Collecting such
pact in this province. However, in all provinces, at no                         data is likely to yield high value for many countries
point in any of our current scenarios was there sufficient                      where testing capacity has been severely strained in the
population-immunity to preclude a subsequent upsurge in                         face of the pandemic and for future pandemics of re-
deaths if transmission levels returned to those estimated                       spiratory pathogens that require the development of new
at the beginning of the pandemic (Rc ≈ 2.00) prior to com-                      diagnostic capacity. C19P funerals and other measures
pletion of an effective vaccination campaign.                                   of suspected mortality provide an alternative lens
   Figure 6a shows trajectories of the three different fu-                      through which to understand COVID-19 burden and dy-
ture scenarios summarized in terms of the proportion of                         namics but do not allow precise measurement. Without
lives lost before the beginning of a month (Fig. 6b) and                        confirmed diagnoses, the proportion of these individuals
the total remaining lives to be saved (deaths that can still                    who were infected will always be unknown and liable to
be averted) after the start of the month (Fig. 6c). We es-                      vary spatiotemporally, as will the extent to which mea-
timate that reimposing suppression scenarios in areas                           sures of suspected deaths represent all deaths of individ-
where epidemics are on an upwards trajectory would                              uals displaying COVID-19 symptoms. These data also
significantly reduce lives lost during a period whilst the                      support the substantial circulation of SARS-CoV-2 in
vaccine is rolled out. In some settings, such as Jakarta,                       Indonesia well before the first confirmed COVID-19
assuming all suspected deaths were COVID-19 deaths, a                           case [3] and the higher impact of the virus than sug-
combination of control measures currently in place and                          gested by confirmed deaths alone. Simultaneously, they
increasing levels of population immunity may combine                            also indicate an earlier decline in transmission during
to reduce transmission and burden to low-levels tempor-                         the early stages of the pandemic, coinciding with reduc-
arily. At this point, the future incremental impact of                          tions in mobility and more sustained declines in trans-
suppression measures would likely be limited. However,                          missibility in response to NPIs than observed in
in such scenarios, the need for ongoing NPIs as the vac-                        confirmed deaths, a metric which is likely sensitive to
cine is rolled out is highlighted by the high loss of life                      limitations in testing. We also found these effects
Djaafara et al. BMC Medicine (2021) 19:146 Page 9 of 13 Fig. 5 a Model fitting to confirmed and suspected (both confirmed and probable) COVID-19 related deaths and inferred population susceptibility in Java; green and blue dots show data on reported and suspected respectively (where suspected includes augmented estimate of probable deaths in provinces outside Jakarta), with associated median (lines) and 95% CrI (shaded areas) of model fits. b Estimated province-level attack rates (cumulative proportion infected) based on confirmed (purple) and suspected (pink) COVID-19 related deaths. c Projections of daily number of deaths due to COVID-19 based on four different transmission scenarios consistent with NPIs substantially attenuating spread prevent the burden from increasing throughout the re- across Java, including to older, more rural populations mainder of 2020. We also suggested that measures to with lower access to healthcare. suppress the virus could prevent such a scenario but Better quantifying impact in the past helps us to better would need to be sustained to prevent further upsurges. understand likely scenarios in the future. In our first set From early 2021, these projections appear to have been of projections in September 2020 [30], we suggested that valid as transmission declined in Jakarta whilst PSBB C19P funeral data could indicate up to a fourfold in- was implemented between September 14 and October crease in cumulative exposure to the virus relative to 11, 2020, but subsequently resurged once restrictions confirmed deaths. However, even when assuming a were lifted. At the beginning of 2021, Java’s epidemio- higher burden of the disease in the population, immun- logical situation is substantially worse than in Septem- ity accumulated at the population level would not ber, with record deaths reported week-on-week [33].
Djaafara et al. BMC Medicine     (2021) 19:146                                                                                       Page 10 of 13

 Fig. 6 a An illustration of future scenario projections and how to define the number of lives lost and the number of deaths that can still be
 averted after a certain time point. The graph shows simulations based on a model fitted to confirmed COVID-19 deaths in Jakarta, which
 subsequently ‘returning to normal’ on 1 March 2021. b Projected percentage of lives lost (compared to total deaths from an unmitigated
 epidemic scenario) prior to the start of each month from February to June 2021, based on each simulation scenario and model fitted to
 confirmed or suspected deaths in each province in Java. c Projected number of lives remaining to be saved (or deaths that can still be averted)
 per million population after the start of each month from February to June 2021, based on each simulation scenario and model fitted to
 confirmed or suspected deaths in each province in Java

Subsequently, our projections, based upon C19P funeral                     Moreover, our estimates of counterfactual ‘return-to-nor-
data, of a likely decline in the epidemic in Jakarta inde-                 mal’ scenarios rely upon an estimate of Rc = 2.00 from the
pendent from any vaccine impact has also come to fru-                      early stage of the epidemic in Jakarta, a period in which
ition, again highlighting the utility of understanding the                 data were particularly limited and where a degree of rele-
true impact of the disease in the population using syn-                    vant behaviour change may have already occurred given
dromic measures of mortality.                                              increasing global concern around the pandemic. As this
   Despite the qualitative validity of both our September                  estimate is also below those estimated in the early stage of
and December 2020 projections, there are multiple limi-                    the epidemic from other settings [38], this estimate may
tations associated with these analyses that should be                      represent a conservative measure of the basic
noted, particularly as our current estimates of attack                     reproduction number. These limitations around the inher-
rates in all provinces in Java have increased substantially.               ent transmissibility and critical immunity threshold to
Firstly, it remains difficult to say what level of                         control the virus need to be further considered in the light
population-immunity is required to achieve herd im-                        of recent concerns of new variants of concern across the
munity as individual immune responses to the virus are                     globe which appear more transmissible [39–41]. There
still not yet well understood (including strength and dur-                 have also been observed resurgences in populations where
ation) [34, 35], and heterogeneity in population mixing                    attack rates have likely passed many estimates of the herd
beyond age-structure likely play important roles [36, 37].                 immunity threshold [39, 42].
Djaafara et al. BMC Medicine   (2021) 19:146                                                                                   Page 11 of 13

   The initiation of the vaccination campaign in the mid-      upsurges in cases and deaths in every province regard-
dle of January [8] provides hopes for more sustainable         less of mortality metric, provides a valuable reminder
control of the virus. However, challenges in access and        that the epidemic, and the need to control it, is far from
distribution [43] and uncertainty in vaccine efficacy [43]     over in any region of Java.
could hamper the life-saving impact of the vaccination
programme. On top of that, possible introductions of           Conclusions
variants of concern (VOC) able to escape immune re-            This study gives evidence of the value of syndrome-
sponse [44], exhibit increased transmissibility [45, 46], or   based mortality as a metric, which is less dependent
cause more severe disease [47] could also bring add-           upon testing capacity with which to estimate transmis-
itional challenges in controlling the spread of the virus.     sion trends and evaluate intervention impact. NPIs im-
Those changes in virus characteristics could lower the         plemented in Java earlier in the pandemic have
real-life vaccine effectiveness, increase the threshold to     substantially slowed the course of the epidemic with
reach ‘herd immunity’, and threaten the healthcare cap-        movement restrictions during Ramadan preventing
acity once again if infections from those VOC were able        spread to more vulnerable rural populations. Further re-
to dominate and take off. To date, Indonesia had re-           laxation of measures would lead to more rapidly pro-
ported several VOC (i.e., B.1.1.7 [48], B.1.525 [49], and a    gressing epidemics, depleting the eventual incremental
variant with E484K mutation [50]) via a ramp-up of gen-        effectiveness of the vaccine. Maintaining adherence to
omic surveillance capacity at the turn of the year [51].       control measures in Jakarta may be particularly challen-
Whilst the sporadic nature of the genomic samples              ging if the epidemic enters a decline phase but will re-
makes it difficult to determine whether local transmis-        main necessary to prevent a subsequent large wave.
sion had been established or not [51], such VOCs fur-          Elsewhere, higher levels of control with NPIs are likely
ther underline the need to maintain control whilst the         to yield high synergistic vaccine impact. Enduring vigi-
vaccination campaign is ongoing.                               lance is vital whilst the vaccination campaign is rolled
   Despite the unprecedented speed of global vaccine de-       out, especially in light of the emergence of VOC across
velopment, our study indicates that in the absence of          the globe.
NPIs implemented over the previous year, this campaign
would have been too late to prevent most deaths that           Abbreviations
currently remain avertable. It also highlights the ongoing     AKB: Adaptasi Kebiasaan Baru (in Indonesian); the ‘new normal’ period;
                                                               C19P: COVID-19 protocols; NPIs: Non-pharmaceutical interventions;
value and need to maintain current control measures            PSBB: Pembatasan Sosial Berskala Besar (in Indonesian); large-scale social re-
during the coming months as the vaccine is rolled out.         strictions (English translation); SEIR: Susceptible-Exposed-Infected-Recovered;
Given low estimated attack rates and current increasing        WHO: World Health Organization

trends in transmission across much of the island, our re-
sults suggest that further measures aimed towards sup-         Supplementary Information
pression of the disease over the next few months would         The online version contains supplementary material available at https://doi.
                                                               org/10.1186/s12916-021-02016-2.
substantially increase the proportion of the population
who receive the vaccine prior to being exposed to infec-        Additional file 1: Figure S1-S16 and Table S1-S5 of ‘Using syndromic
tion, leading to a likely substantial incremental impact of     measures of mortality to capture the dynamics of COVID-19 in Java,
the vaccination campaign. However, we are not able to           Indonesia in the context of vaccination rollout’. This additional file com-
                                                                prises of all supplementary figures and tables accompanying the main
capture the socio-economic costs of such approaches,            text.
which would need to be factored into balanced decision-         Additional file 2. Supplementary methods section of ‘Using syndromic
making.                                                         measures of mortality to capture the dynamics of COVID-19 in Java,
   The case for maintaining or increasing control mea-          Indonesia in the context of vaccination rollout’. This additional file com-
                                                                prises of all supplementary methods accompanying methods described
sures is likely more intuitive to grasp in circumstances        in the main text.
where the incidence of cases and deaths continues to
rise. However, our projections for Jakarta, particularly
                                                               Acknowledgements
those incorporating suspected deaths, suggest that             Not applicable.
population-level immunity is contributing largely to the
decline in observed deaths. This effect may have conse-        Authors’ contributions
quences for the perceptions of both the vaccine’s relative     BAD, CW, OJW, ACG, IRFE, and PGTW conceived and designed the study. W,
                                                               DO, VA, and NS collected, verified, and provided data interpretation. BAD,
impact, with deaths declining at a faster rate in Jakarta      CW, OJW, RV, NFB, SB, PN, IRFE, and PGTW were involved in the data analysis
relative to other provinces as the vaccine is being rolled     and interpretation. BAD, CW, OJW, and PGTW drafted the paper. BAD, CW,
out, as well as the ongoing need for NPIs and/or high          OJW, RV, NFB, W, DO, VA, NS, SB, PN, ESS, TSC, HS, RNL, LLE, KDL, AA, GT, JKB,
                                                               ACG, IRFE, and PGTW critically revised the manuscript for important
vaccine uptake. In such circumstances, our counterfac-         intellectual content, and all authors gave final approval for the version to be
tual of a ‘return-to-normal’, which produces major             published.
Djaafara et al. BMC Medicine (2021) 19:146 Page 12 of 13
Funding January 2021). 2021. https://reliefweb.int/report/indonesia/situation-update-
This work was supported by funding from the MRC Centre for Global response-covid-19-indonesia-18-january-2021-enid.
Infectious Disease Analysis (reference MR/R015600/1), jointly funded by the 8. Jiao C, Aditya A. Indonesia begins COVID-19 vacine rollout - and Jokowi is
UK Medical Research Council (MRC) and the UK Foreign, Commonwealth & first to get jab. Time. 2021; https://time.com/5929160/indonesia-vaccine-
Development Office (FCDO), under the MRC/FCDO Concordat agreement, rollout-jokowi/. Accessed 25 Jan 2021.
and is also part of the EDCTP2 programme supported by the European 9. Office of Assistant to Deputy Cabinet Secretary for State Documents &
Union and funding by Community Jameel. BAD acknowledges a matched Translation. Gov’t to kick off COVID-19 vaccination for public workers.
MRC Centre 1+3 studentship funding by Imperial College London School of Cabinet Secretariat of the Republic of Indonesia. 2021. https://setkab.go.id/
Public Health. IRFE acknowledges a funding from Oxford University Clinical en/govt-to-kick-off-covid-19-vaccination-for-public-workers/. Accessed 29
Research Unit (OUCRU) Strategic Committee Research for COVID-19, Vietnam. Apr 2021.
JKB, IRFE, LLE, KDL, RNL, AA, and HS are supported by the Wellcome Trust, 10. Watson OJ, Alhaffar M, Mehchy Z, Whittaker C, Akil Z, Brazeau NF, et al.
UK (106680/Z/14/Z). GT is supported by the Wellcome Trust, UK (110179/Z/ Leveraging community mortality indicators to infer COVID-19 mortality and
15/Z). CW acknowledges funding from a UK Medical Research Council Doc- transmission dynamics in Damascus, Syria. Nat Commun. 2021;12:1–10.
toral Training Partnership (DTP) studentship. The funders had no role in study https://doi.org/10.1038/s41467-021-22474-9.
design, data collection and analysis, decision to publish, or preparation of 11. Burki T. COVID-19 in Latin America. Lancet Infect Dis. 2020;20(5):547–8.
the manuscript. https://doi.org/10.1016/S1473-3099(20)30303-0.
12. Spiegelhalter D. Why has the UK done so badly on COVID-19? There are still
Availability of data and materials no simple answers: The Guardian; 2020. https://www.theguardian.com/
Full details of the data used in this article and the methods to analyse them commentisfree/2020/aug/02/uk-covid-19-excess-deaths. Accessed 7 Sept 2020
are provided in the Additional file 2. The datasets supporting the conclusions 13. Syakriah A. An examination of Indonesia’s death toll: could it be higher? The
of this article are available in: https://github.com/andradjaafara/covid19_ Jakarta Post; 2020. https://www.thejakartapost.com/news/2020/04/28/an-exa
indonesia_data. mination-of-indonesias-death-toll-could-it-be-higher.html. Accessed 24 Nov
2020
14. Jakarta Provincial Health Department. Jakarta COVID-19 data monitoring.
Declarations
2020. https://corona.jakarta.go.id/id/data-pemantauan. Accessed 10 Dec
2020.
Ethics approval and consent to participate
15. Directorate General of Health Services Ministry of Health of the Republic of
Not applicable.
Indonesia. Fasyankes Online. http://sirs.yankes.kemkes.go.id/fo/. Accessed 11
Mar 2020.
Consent for publication 16. Ministry of Health of the Republic of Indonesia. Ketahanan Kesehatan dalam
Not applicable. Menjalani Tatanan Hidup Baru. Jakarta; 2020.
17. Chakraborty S, Chakravarty D. Discrete gamma distributions: properties and
Competing interests parameter estimations. Commun Stat Theory Methods. 2012;41(18):3301–24.
The authors declare that they have no competing interests. https://doi.org/10.1080/03610926.2011.563014.
18. Bi Q, Wu Y, Mei S, Ye C, Zou X, Zhang Z, et al. Epidemiology and
Author details transmission of COVID-19 in 391 cases and 1286 of their close contacts in
1
MRC Centre for Global Infectious Disease Analysis and the Abdul Latif Shenzhen, China: a retrospective cohort study. Lancet Infect Dis. 2020;0.
Jameel Institute for Disease and Emergency Analytics, School of Public https://doi.org/10.1016/S1473-3099(20)30287-5.
Health, Imperial College London St Mary’s Campus, Norfolk Place, London 19. Keeling MJ, Danon L, Vernon MC, House TA. Individual identity and
W2 1PG, UK. 2Eijkman-Oxford Clinical Research Unit, Jakarta, Indonesia. movement networks for disease metapopulations. Proc Natl Acad Sci U S A.
3
Jakarta Provincial Department of Health, Jakarta, Indonesia. 4School of Life 2010;107(19):8866–70. https://doi.org/10.1073/pnas.1000416107.
Sciences, University of Sussex, Brighton, UK. 5Centre for Tropical Medicine, 20. Watson OJ, Walker P, Whittaker C, Winskill P, Charles G. squire: SEIR
Faculty of Medicine, Public Health and Nursing, Universitas Gadjah Mada, transmission model of COVID-19. https://github.com/mrc-ide/squire.
Yogyakarta, Indonesia. 6Oxford University Clinical Research Unit, Ho Chi Minh 21. WorldPop. Global Flight Data Annual; 2020. https://doi.org/10.5258/SOTON/
City, Vietnam. 7Centre for Tropical Medicine and Global Health, Nuffield WP00100.
Department of Medicine, University of Oxford, Oxford, UK. 22. Lauer SA, Grantz KH, Bi Q, Jones FK, Zheng Q, Meredith HR, et al. The
incubation period of coronavirus disease 2019 (COVID-19) from publicly
Received: 19 February 2021 Accepted: 26 May 2021 reported confirmed cases: estimation and application. Ann Intern Med.
2020;172(9):577–82. https://doi.org/10.7326/M20-0504.
23. Walker PGT, Whittaker C, Watson OJ, Baguelin M, Winskill P, Hamlet A, et al.
References The impact of COVID-19 and strategies for mitigation and suppression in
1. WHO. WHO coronavirus disease (COVID-19) Dashboard. 2020. https://covid1 low- and middle-income countries. Science (80- ). 2020;369:eabc0035.
9.who.int/. Accessed 3 Feb 2021. https://doi.org/10.1126/science.abc0035.
2. Rochmyaningsih D. Indonesia finally reports two coronavirus cases. 24. Intensive Care National Audit & Research Centre. ICNARC report on COVID-
Scientists worry it has many more. Science. 2020. https://www.sciencemag. 19 in critical care.
org/news/2020/03/indonesia-finally-reports-two-coronavirus-cases-scientists- 25. Imperial College COVID-19 LMIC Reports. Version 5. MRC Centre for Global
worry-it-has-many-more. Accessed 21 Aug 2020. Infectious Disease Analysis, Imperial College London. 2020. https://mrc-ide.
3. De Salazar PM, Niehus R, Taylor A, Buckee COF, Lipsitch M. Identifying github.io/global-lmic-reports/.
locations with possible undetected imported severe acute respiratory 26. Unwin HJT, Mishra S, Bradley VC, Gandy A, Mellan TA, Coupland H, et al.
syndrome coronavirus 2 cases by using importation predictions. Emerg State-level tracking of COVID-19 in the United States. medRxiv. 2020.
Infect Dis. 2020;26(7):1465–9. https://doi.org/10.3201/eid2607.200250. https://doi.org/10.1101/2020.07.13.20152355.
4. WHO Indonesia. COVID-19 Indonesia situation reports. 2020. https://www. 27. Cori A, Ferguson NM, Fraser C, Cauchemez S. A new framework and
who.int/indonesia/news/novel-coronavirus/situation-reports. software to estimate time-varying reproduction numbers during epidemics.
5. This year’s Idul Fitri traffic accidents fall by 31 percent. The Jakarta Post. Am J Epidemiol. 2013;178(9):1505–12. https://doi.org/10.1093/aje/kwt133.
2020. https://www.thejakartapost.com/news/2020/06/09/this-years-idul-fitri- 28. Cori A. EpiEstim: a package to estimate time varying reproduction numbers
traffic-accidents-fall-by-31-percent.html. from epidemic curves. R package version 2.2-3. 2020. https://cran.r-project.
6. Widianto S. Indonesia’s capital to reimpose restrictions over coronavirus. org/package=EpiEstim.
Reuters. 2020; https://uk.reuters.com/article/health-coronavirus-indonesia- 29. Google LLC. Google COVID-19 community mobility reports. https://www.
idINL4N2G62U5. google.com/covid19/mobility/. Accessed 22 Aug 2020.
7. United Nations Office for the Coordination of Humanitarian Affairs (UN 30. Djaafara BA, Whittaker C, Watson OJ, Verity R, Brazeau NF, Oktavia D, et al.
OCHA). Situation update: response to COVID-19 in Indonesia (As of 18 Quantifying the dynamics of COVID-19 burden and impact of interventionsDjaafara et al. BMC Medicine (2021) 19:146 Page 13 of 13
in Java, Indonesia. medRxiv. 2020. https://doi.org/10.1101/2020.10.02.201 51. Rochmyaningsih D. Indonesia ramps up effort to spot elusive COVID
98663. variants. Nikkei Asia. 2021; https://asia.nikkei.com/Spotlight/Coronavirus/
31. Satuan Tugas Penanganan COVID-19 (Indonesia COVID-19 Response Indonesia-ramps-up-effort-to-spot-elusive-COVID-variants. Accessed 16 Apr
Acceleration Task Force). Peta Sebaran. 2020. https://covid19.go.id/peta-seba 2021.
ran. Accessed 3 Feb 2021.
32. COVID-19 di Indonesia @kawalcovid19 online spreadsheet (tab: Kasus per
Provinsi). 2020. kcov.id/daftarpositif. Publisher’s Note
Springer Nature remains neutral with regard to jurisdictional claims in
33. Ratcliffe R, Cahya GH. COVID patients turned away as hospitals in Indonesia
published maps and institutional affiliations.
face collapse. The Guardian. 2021. https://www.theguardian.com/world/2
021/jan/26/covid-patients-turned-away-as-hospitals-in-indonesia-face-colla
pse. Accessed 29 Jan 2021.
34. Altmann DM, Douek DC, Boyton RJ. What policy makers need to know
about COVID-19 protective immunity. Lancet. 2020;395(10236):1527–9.
https://doi.org/10.1016/S0140-6736(20)30985-5.
35. Stephens DS, McElrath MJ. COVID-19 and the Path to Immunity. J Am Med
Assoc. 2020;324(13):1279–81. https://doi.org/10.1001/jama.2020.16656.
36. Britton T, Ball F, Trapman P. A mathematical model reveals the influence of
population heterogeneity on herd immunity to SARS-CoV-2. Science (80- ).
2020;369:846–9. https://doi.org/10.1126/science.abc6810.
37. Aschwanden C. The false promise of herd immunity for COVID-19. Nature.
2020;587(7832):26–8. https://doi.org/10.1038/d41586-020-02948-4.
38. Flaxman S, Mishra S, Gandy A, Unwin HJT, Mellan TA, Coupland H, et al.
Estimating the effects of non-pharmaceutical interventions on COVID-19 in
Europe. Nature. 2020;584(7820):257–61. https://doi.org/10.1038/s41586-02
0-2405-7.
39. Sabino EC, Buss LF, Carvalho MPS, Prete CA Jr, Crispim MAE, Fraiji NA, et al.
Resurgence of COVID-19 in Manaus, Brazil, despite high seroprevalence.
Lancet. 2021;397(10273):452–5. https://doi.org/10.1016/S0140-6736(21)001
83-5.
40. Meldrum A, Magome M. South Africa struggles with post-holiday spike in
COVID-19: Associated Press; 2021. https://apnews.com/article/travel-south-a
frica-coronavirus-pandemic-holidays-africa-8a45947a6a4a1eeeb48102bb9d4
04206. Accessed 28 Jan 2021
41. Volz E, Mishra S, Chand M, Barrett JC, Johnson R, Geidelberg L, et al.
Assessing transmissibility of SARS-CoV-2 lineage B.1.1.7 in England. Nature.
2021;593:266–9. https://doi.org/10.1038/s41586-021-03470-x.
42. Buss LF, Prete CA, Abrahim CMM, Mendrone A, Salomon T, de Almeida-
Neto C, et al. Three-quarters attack rate of SARS-CoV-2 in the Brazilian
Amazon during a largely unmitigated epidemic. Science (80- ). 2021;371:288
LP–292. https://doi.org/10.1126/science.abe9728.
43. Kim JH, Marks F, Clemens JD. Looking beyond COVID-19 vaccine phase 3
trials. Nat Med. 2021;27(2):205–11. https://doi.org/10.1038/s41591-021-01230-
y.
44. Kupferschmidt K. New mutations raise specter of ‘immune escape.’. Science
(80- ). 2021;371:329 LP–330. https://doi.org/10.1126/science.371.6527.329.
45. Davies NG, Abbott S, Barnard RC, Jarvis CI, Kucharski AJ, Munday JD, et al.
Estimated transmissibility and impact of SARS-CoV-2 lineage B.1.1.7 in
England. Science (80- ). 2021;372:eabg3055. https://doi.org/10.1126/science.a
bg3055.
46. Faria NR, Mellan TA, Whittaker C, Claro IM, da S Candido D, Mishra S, et al.
Genomics and epidemiology of the P.1 SARS-CoV-2 lineage in Manaus,
Brazil. Science (80- ). 2021:eabh2644. https://doi.org/10.1126/science.abh2
644.
47. New and Emerging Respiratory Virus Threats Advisory Group (NERVTAG).
NERVTAG: update note on B.1.1.7 severity. 2021. https://assets.publishing.
service.gov.uk/government/uploads/system/uploads/attachment_data/file/
961042/S1095_NERVTAG_update_note_on_B.1.1.7_severity_20210211.pdf.
Accessed 16 Apr 2021.
48. Widianto S. Indonesia says identifies two cases of British COVID-19 variant:
Reuters; 2021. https://www.reuters.com/article/us-health-coronavirus-
indonesia-idUSKBN2AU0SE. Accessed 16 Apr 2021
49. Panama N, Katriana. New COVID-19 variant B1525 identified in Batam of
Riau Islands: Antara News; 2021. https://en.antaranews.com/news/172550/
new-covid-19-variant-b1525-identified-in-batam-of-riau-islands. Accessed 16
Apr 2021
50. Reuters staff. Indonesia reports coronavirus case with “Eek” mutation:
Reuters; 2021. https://www.reuters.com/article/us-health-coronavirus-
indonesia-mutation-idUSKBN2BT1FV. Accessed 16 Apr 2021You can also read