Updraft dynamics and microphysics: on the added value of the cumulus thermal reference frame in simulations of aerosol-deep convection ...
←
→
Page content transcription
If your browser does not render page correctly, please read the page content below
Research article
Atmos. Chem. Phys., 22, 711–724, 2022
https://doi.org/10.5194/acp-22-711-2022
© Author(s) 2022. This work is distributed under
the Creative Commons Attribution 4.0 License.

            Updraft dynamics and microphysics: on the added
             value of the cumulus thermal reference frame in
           simulations of aerosol–deep convection interactions
                        Daniel Hernandez-Deckers1 , Toshihisa Matsui2,3 , and Ann M. Fridlind4
                    1 Grupo de Investigación en Ciencias Atmosféricas, Departamento de Geociencias,
                                  Universidad Nacional de Colombia, Bogotá, Colombia
        2 Mesoscale Atmospheric Processes Laboratory, NASA Goddard Space Flight Center, Greenbelt, MD, USA
        3 Earth System Science Interdisciplinary Center – ESSIC, University of Maryland, College Park, MD, USA
                            4 NASA Goddard Institute for Space Studies, New York, NY, USA

                        Correspondence: Daniel Hernandez-Deckers (dhernandezd@unal.edu.co)

                                    Received: 9 July 2021 – Discussion started: 19 July 2021
                      Revised: 4 November 2021 – Accepted: 3 December 2021 – Published: 18 January 2022

      Abstract. One fundamental question about atmospheric moist convection processes that remains debated is
      whether, or under which conditions, a relevant variability in background aerosol concentrations may have a sig-
      nificant dynamical impact on convective clouds and their associated precipitation. Furthermore, current climate
      models must parameterize both the microphysical and the cumulus convection processes, but this is usually im-
      plemented separately, whereas in nature there is a strong coupling between them. As a first step to improve our
      understanding of these two problems, we investigate how aerosol concentrations modify key properties of up-
      drafts in eight large-eddy-permitting regional simulations of a case study of scattered convection over Houston,
      Texas, in which convection is explicitly simulated and microphysical processes are parameterized. Dynamical
      and liquid-phase microphysical responses are investigated using the following two different reference frames:
      static cloudy updraft grid cells versus tracked cumulus thermals. In both frameworks, we observe the expected
      microphysical responses to higher aerosol concentrations, such as higher cloud number concentrations and lower
      rain number concentrations. In terms of the dynamical responses, both frameworks indicate weak impacts of
      varying aerosol concentrations relative to the noise between simulations over the observationally derived range
      of aerosol variability for this case study. On the other hand, results suggest that thermals are more selective than
      cloudy updraft grid cells in terms of sampling the most active convective air masses. For instance, vertical ve-
      locity from thermals is significantly higher at upper levels than when sampled from cloudy updraft grid points,
      and several microphysical variables have higher average values in the cumulus thermal framework than in the
      cloudy updraft framework. In addition, the thermal analysis is seen to add rich quantitative information about
      the rates and covariability of microphysical processes spatially and throughout tracked thermal lifecycles, which
      can serve as a stronger foundation for improving subgrid-scale parameterizations.

Published by Copernicus Publications on behalf of the European Geosciences Union.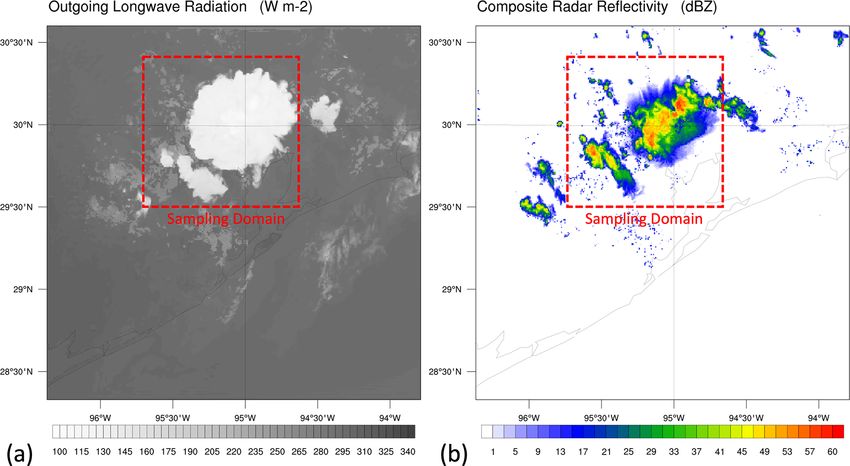
712                                                        D. Hernandez-Deckers et al.: Updraft dynamics and microphysics

1   Introduction                                                  updraft grid points. Such active cloud sampling criteria have
                                                                  been widely used since large-eddy simulations (LESs) have
The net impacts of atmospheric aerosol concentration on           been available (e.g., Siebesma and Cuijpers, 1995; de Roode
deep convective cloud systems and their environment remain        and Bretherton, 2003). However, with notable exceptions, as
highly uncertain, with mixed results that do not generally        in supercells, moist convection commonly constitutes a se-
yield conclusive answers yet (e.g., Khain et al., 2008; Tao       ries of many short-lived thermals within each cumulus cloud
et al., 2012). All else being equal, a higher aerosol concen-     (Scorer and Ludlam, 1953; Woodward, 1959; Blyth et al.,
tration generally corresponds to more condensation nuclei at      2005; Damiani et al., 2006; Sherwood et al., 2013; Yano,
any given supersaturation, which, in turn, is expected to pro-    2014; Hernandez-Deckers and Sherwood, 2016; Morrison
duce more but smaller cloud droplets within a convective up-      and Peters, 2018; Yeung et al., 2021), raising the question
draft. This may delay the occurrence of initial warm precipi-     of whether the traditional grid point selection criteria are the
tation formation due to a less efficient collision–coalescence    most appropriate. For instance, cumulus thermals themselves
process, enhancing latent heat release above the freezing         can be very heterogeneous due to their own internal circula-
level (Rosenfeld et al., 2008). However, when or if this has      tion structure (Hernandez-Deckers and Sherwood, 2016), so
a substantial impact on the amount or intensity of cold pre-      traditional grid point sampling may miss relevant air masses.
cipitation is not clear due to the uncertainties of subsequent    In addition, traditional grid point sampling may include ris-
ice and mixed-phase microphysics (e.g., Korolev et al., 2020)     ing or cloudy points that are unrelated to the relevant con-
and the complex morphology and feedback of deep convec-           vective air masses (e.g., Mrowiec et al., 2015). This can be
tive clouds under various environmental conditions (e.g., Tao     avoided with even more selective criteria, such as that by
et al., 2012; Fan et al., 2016; Abbott and Cronin, 2021). One     Marinescu et al. (2021), who only include grid points within
approach, to reduce such complexities to some degree, is to       6 km deep (or more) cloudy updraft columns, thus consid-
focus on aerosol–cloud interactions in relatively isolated con-   ering only well-developed deep convective cores. However,
vective cells (e.g., Fridlind et al., 2019), where the various    important microphysical activity may also occur outside of
mechanisms by which aerosol may impact updraft properties         such cores, and their initial lifetime stages remain unac-
remain operative.                                                 counted for. For instance, recent observations by Yeung et al.
   The recent Aerosol, Cloud, Precipitation and Climate           (2021) indicate that most updrafts are less than 2 km deep,
(ACPC) working group model intercomparison project                suggesting that a large fraction of mass flux may be left out
(MIP) compared regional model simulations of such scat-           by such selection criteria. All this suggests the possibility of
tered convection in response to a realistic dynamic range         exploring an alternative, more objective-based definition of
of ambient aerosol concentration profiles with similar large-     the active cloudy regions arising from cumulus thermals.
scale forcing. Although participating models exhibited sim-          The identification and tracking of cumulus thermals in nu-
ilar updraft invigoration at low levels, differences between      merical simulations have been used to investigate their in-
the models are larger than each model’s response to ambient       trinsic dynamical properties in studies such as those by Sher-
aerosol loading (Marinescu et al., 2021), offering little clear   wood et al. (2013), Romps and Charn (2015), Hernandez-
guidance for larger-scale models. Indeed, it is even more         Deckers and Sherwood (2016), Hernandez-Deckers and
challenging to represent such processes in a climate model        Sherwood (2018), Moser and Lasher-Trapp (2017), Lecoanet
because updraft microphysics and dynamics are often sim-          and Jeevanjee (2019), or Peters et al. (2020). Their results
plified by cumulus parameterization at a much coarser spa-        have contributed to improving the understanding of the dy-
tiotemporal resolution (McFarlane, 2011). To better repre-        namical properties and the role of thermals in cumulus con-
sent such processes in climate models, it is imperative to dis-   vection, which is necessary for the development of new con-
entangle aerosol-deep convection interactions from the wider      vection parameterization schemes. However, to our knowl-
spectrum of microphysics and dynamical processes.                 edge, cumulus thermal identification has not been used as a
   One foundational step in order to tackle this problem is to    sampling approach similar to the traditional cloudy updraft
investigate the possible links between the updraft and micro-     grid points or convective core identification. Here, we apply
physical processes in moist convection. Characterizing dy-        the thermal identification and tracking method of Hernandez-
namical and microphysical properties in response to the am-       Deckers and Sherwood (2016), using it as a novel sam-
bient aerosols is very difficult from existing observations,      pling approach, and compare it to the traditional cloudy up-
but current high-resolution numerical models in which cu-         draft grid point method in the context of dynamical and mi-
mulus convection does not require being parameterized, such       crophysical impacts on deep convection due to changes in
as those analyzed by Marinescu et al. (2021) or Abbott and        aerosol concentrations.
Cronin (2021), offer a useful alternative. In order to study         The more complex cumulus thermal framework enables
convective cloud properties in such simulations, the active       a direct, three-dimensional, structure-based analysis of how
cloudy regions must be identified first, which is traditionally   the internal updraft dynamical structure is coupled to the mi-
done by sampling grid points with specific thresholds of ver-     crophysical processes, which is something that is difficult
tical velocity and liquid water content; we call these cloudy     to obtain from the grid point framework. Both frameworks

Atmos. Chem. Phys., 22, 711–724, 2022                                                https://doi.org/10.5194/acp-22-711-2022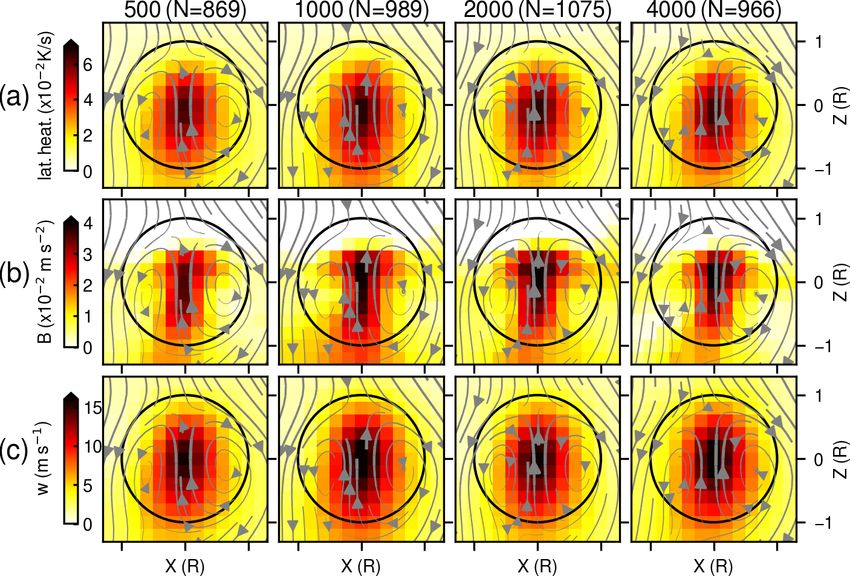
D. Hernandez-Deckers et al.: Updraft dynamics and microphysics                                                              713

are expected to provide important information about the im-       to multi-nested domains. However, it successfully generates
pact of aerosol concentrations on the dynamical and micro-        thermal bubbles of isolated convection driven by sea breeze
physical properties of deep convection, and here we compare       circulation for a given computational resource. The analy-
the approaches in a systematic fashion. Although the ulti-        sis is focused on the scattered convection that occurs due
mate aerosol impact on precipitation amount and intensity         to mesoscale circulations within the domain. Vertical grid
may depend on details of the particular microphysical pa-         spacing stretches from approximately 50 m near the surface
rameterizations used, the first step we carry out here is to      to 300 m near the 4 km level, with 96 vertical levels. The
use both reference frames to investigate the basic impacts        model top is approximately 22 km (50 hPa). The planetary
on the initial warm-phase microphysics and dynamics within        boundary layer (PBL) parameterization was turned off, and
scattered isolated convection. Through a series of relatively     only the turbulent kinetic energy (TKE) scheme is used; we
high-resolution, large-eddy-permitting regional model exper-      found that the TKE scheme with the PBL scheme at this
iments, this study investigates the impact of a sequential in-    resolution unphysically suppresses the number of cumulus
crease in aerosol concentrations on the simulated dynamics        thermals within the middle of boundary layer (not shown).
and microphysics of deep convection. From the microphysi-         Other physics options include the new Goddard radiation
cal point of view, we focus on warm-phase microphysics be-        scheme (Matsui et al., 2020), Noah-MP land surface model,
cause of larger uncertainties in ice nucleation and subsequent    and Predicted Particle Properties (P3) scheme with a single
ice and mixed-phase microphysics. Here we investigate the         ice species.
dynamics–microphysics coupling using a single model and              The P3 scheme predicts the mass and number concentra-
case study with two analysis approaches because differences       tions of cloud droplets, raindrops, and ice particles, and ad-
between both models and case studies are expected (e.g., Tao      ditional tracers (rime mass and volume) are also predicted to
et al., 2012; Marinescu et al., 2021); however, it will not       better characterize ice properties (Morrison and Milbrandt,
be possible to establish the generality of our results to other   2015). Aerosol activation follows Abdul-Razzak and Ghan
models and scenarios without future work, and its potential       (2000), using the minimum supersaturation from Morrison
merit may, nonetheless, be partly guided by our initial find-     and Grabowski (2008) (their Eq. A10). Based on regional
ings here.                                                        observations (Marinescu et al., 2021), aerosol profiles span-
   Following this introduction, Sect. 2 describes the simula-     ning the boundary layer (up to 2500 m a.g.l. – above ground
tions analyzed here and a summary of the thermal identifica-      level) are stratified in the eight sensitivity experiments from
tion and tracking method. Section 3 presents the main results,    relatively clean continental (500 cm−3 ) up to polluted condi-
first in terms of composites of thermals, next in terms of ver-   tions (4000 cm−3 ), increasing by 500 cm−3 for each sensitiv-
tical profiles of various quantities, and finally comparing the   ity experiment. Aerosol is specified as a single-mode lognor-
cloudy updraft grid point and thermal frameworks. Section 4       mal distribution with a fixed mean diameter (100 nm), log-
presents the summary and conclusions of this study.               normal distribution width (1.8), and hygroscopicity param-
                                                                  eter (0.2). As in Marinescu et al. (2021), aerosol transport
                                                                  (resolved and subgrid), activation, removal by droplet coa-
2     Simulations and methods
                                                                  lescence, and regeneration from droplet evaporation follows
2.1    Case study and model setup
                                                                  the method in Fridlind et al. (2017), while the aerosol im-
                                                                  pact on ice nuclei is not considered. The polluted and clean
The case study is based on scattered, isolated convective         aerosol size distributions and vertical profiles were based
clouds that developed over Houston, Texas, on 19–20 June          on the data from Deriving Information on Surface condi-
2013, following the ACPC MIP simulations (Marinescu               tions from Column and Vertically Resolved Observations
et al., 2021). During the daytime, the heating over the land      Relevant to Air Quality (DISCOVER-AQ) in September
develops a pressure gradient between the land and ocean.          2013 and satellite-based estimates (Rosenfeld et al., 2012)
The associated afternoon sea breeze front triggers scattered      near Houston on 19 June 2013. The timing of the satellite
convection by disturbing conditionally unstable layers. This      cloud condensation nuclei (CCN) observations is identical
study uses the NASA-Unified Weather Research and Fore-            to the simulation dates. The profiles feature constant val-
casting (NU-WRF) model (Peters-Lidard et al., 2015) con-          ues in the boundary layer up to 2.5 km and in the free tro-
figuration that was also used in the ACPC MIP study as a          posphere over 5 km, with a linear transition between these
basis (Marinescu et al., 2021); however, the domains, grid        heights. Aerosol removal/replenishment processes are based
spacing, and aerosol concentrations are revised in order to       on the semi-diagnostic methods in Fridlind et al. (2017). This
investigate cumulus thermals.                                     method activates cloud droplets for a given supersaturation
   This case study utilizes a single large domain (998 × 998      rate and aerosol characteristics and tracks the sum of acti-
horizontal grid cells) with 250 m horizontal grid spacing         vated and unactivated aerosol through advection and mixing.
and without nesting (Fig. 1). This type of domain setting         Additional cloud droplets can be activated when the newly
exceeds the traditional downscaling ratio (1 : 3 1 : 5), re-      activated cloud droplets number exceeds the present num-
sulting in reduced precipitation forecasting skill compared       ber of cloud droplets. Aerosol number concentrations will

https://doi.org/10.5194/acp-22-711-2022                                             Atmos. Chem. Phys., 22, 711–724, 2022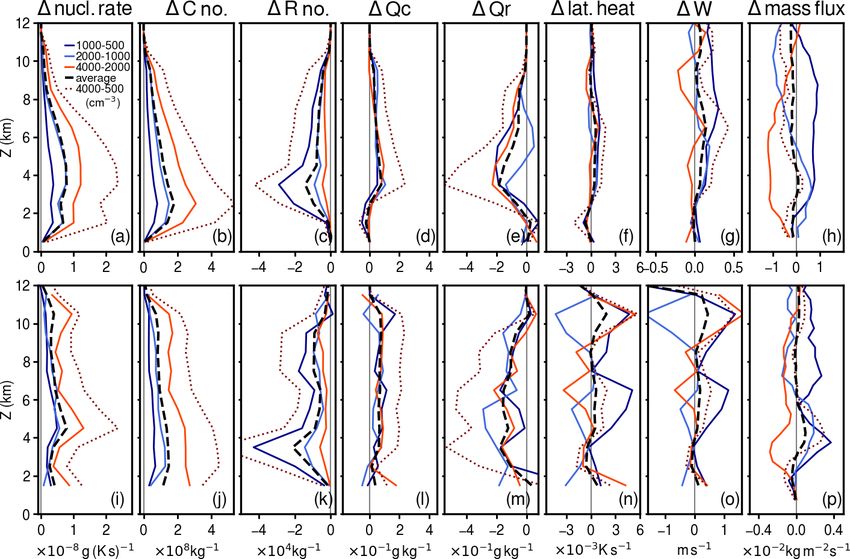
714 D. Hernandez-Deckers et al.: Updraft dynamics and microphysics
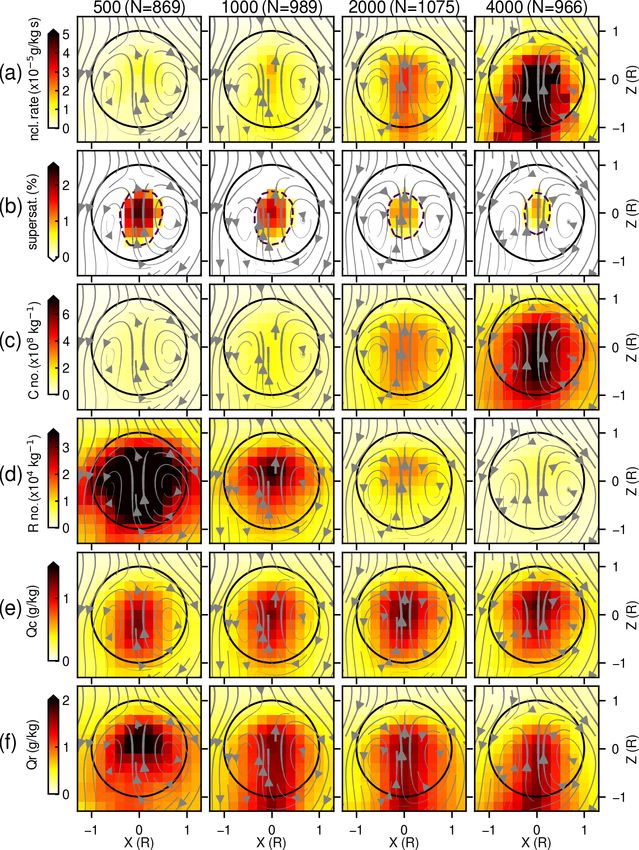
Figure 1. NU-WRF domain and sampling domain showing (a) outgoing longwave radiation (OLR) and (b) composite radar reflectivity, on
19 June 2013 at 23:25 UTC, for the simulation with an aerosol number concentration of 500 cm−3 .
be reduced only when cloud droplets are reduced by a coa- mals, which, in turn, leads to a better understanding of many
lescence process (i.e., autoconversion to precipitation class). aspects of convection (Morrison, 2016; Moser and Lasher-
The advantage of this approach is to account for activation Trapp, 2017; Hernandez-Deckers and Sherwood, 2018; Pe-
and regeneration of aerosols without explicitly accounting ters et al., 2020). Here we identify, track, and analyze cu-
for aerosols within cloud droplets (see details in Fridlind mulus thermals in the NU-WRF simulations described in
et al., 2017). the previous section, using the methodology of Hernandez-
NCEP Final Analysis (FNL) was used to initialize NU- Deckers and Sherwood (2016). In the following, we describe
WRF on 19 June 2013 at 12:00 UTC, and it continued the main features of this method; for further details, please
updating lateral boundary conditions until 20 June 2013 refer to their study.
at 15:00 UTC. The 6 h lateral boundary conditions from To identify thermals, an automated algorithm identifies
GFS are spatially and temporally interpolated to update peaks in vertical velocity throughout a particular volume of
the model lateral boundary conditions at every model time the simulation at each output time step and assumes that
step, while sea breeze dynamics are explicitly simulated by these indicate the instantaneous locations of the thermals’
model physics and dynamics within the domain. Since ther- centers. By comparing these locations in consecutive out-
mal tracking requires 1 min temporal resolution of NU-WRF put time steps, the algorithm can estimate each thermal’s tra-
output, we focused on the 3 h time window from 19 June jectory, which also yields an estimate of their ascent rates
21:00 UTC for thermal and cloudy updraft grid point analy- at each time step. Assuming spherical shapes, a thermal’s
sis during the active convection period. Figure 1 shows the size can be estimated by choosing the radius that makes the
actual sampling domain used (a 100 × 100 km area), where average vertical velocity of the enclosed volume match the
most active convection occurs during this time window. corresponding ascent rate. Notice that each thermal’s ascent
rate can vary between time steps, and hence, the estimated
size of a thermal may also vary in time. The smallest ra-
2.2 Thermal identification and tracking dius permitted for a thermal is twice the model grid spacing,
Sufficiently high-resolution simulations can generally repro- which is 500 m in this case. Smaller thermals are discarded.
duce the expected thermal-like structures that are character- This ensures that each identified thermal corresponds to a
istic of cumulus clouds (e.g., Sherwood et al., 2013; Var- coherent rising volume of air. Hernandez-Deckers and Sher-
ble et al., 2014; Romps and Charn, 2015). This provides wood (2016) showed that, indeed, thermal shapes do not de-
a numerical tool to investigate the dynamics of these ther- viate much from sphericity, making this a good approxima-
Atmos. Chem. Phys., 22, 711–724, 2022 https://doi.org/10.5194/acp-22-711-2022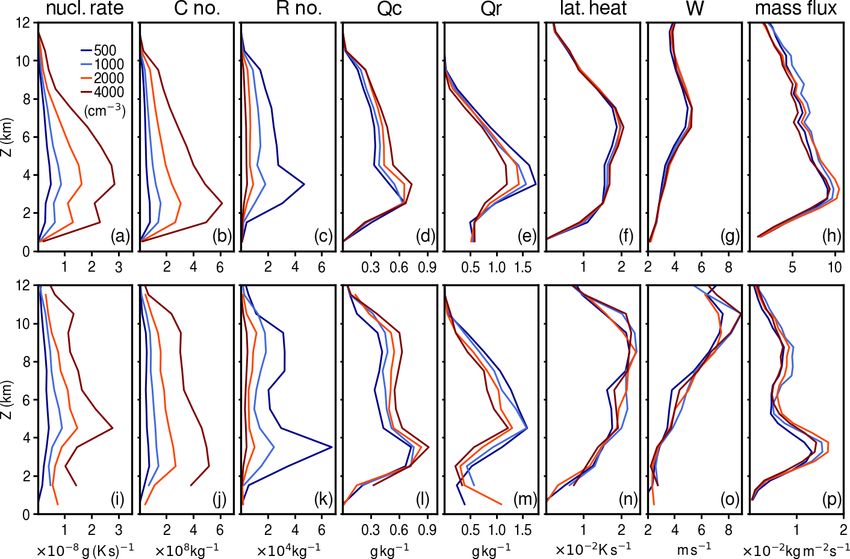
D. Hernandez-Deckers et al.: Updraft dynamics and microphysics                                                                 715

tion. Finally, it is worth noting that the algorithm only takes     consistent with raindrop generation by coalescence of cloud
into account thermals with average ascent rates of at least         droplets. On the other hand, although number concentrations
1 m s−1 and with centers that have at least 0.01 g kg−1 of          of both cloud droplets and raindrops are strongly affected by
cloud condensate. Furthermore, it computes each thermal’s           aerosol number concentration, their mixing ratios respond
vertical momentum budget and discards any cases in which            less strongly (Fig. 2e and f) and in such a way that the to-
the tracked trajectory is inconsistent with it. From the sam-       tal liquid water mixing ratio remains more weakly impacted
ple of tracked thermals, different statistical measures can be      (not shown here).
obtained for both microphysical and dynamical properties.              Microphysical quantities are found to peak at thermal cen-
These can be then compared to results based on the cloudy           ters nearly universally, which reinforces the important role
updraft sampling framework. For consistency, our threshold          of thermals as the building blocks of convection from both
criteria for selecting cloudy updraft grid points is a vertical     a dynamical and microphysical point of view. For example,
velocity of 1 m s−1 and a cloud condensate of 0.01 g kg−1 .         supersaturation values are only reached inside thermals, gen-
   The mass flux captured by the tracked thermals is typi-          erating numerous cloud droplets around their cores. Stream-
cally 15 %–20 % of the estimated total mass flux, as will           lines of the averaged flow also indicate a more turbulent mix-
be shown below. Despite this being a relatively small frac-         ing around the thermal frame, whereas upstream currents are
tion, Hernandez-Deckers and Sherwood (2016) showed that             present in the core of thermals.
the convective evolution is well represented by the thermals,          The microphysical response to aerosol number concentra-
suggesting that their dynamics are representative of the en-        tion could cause a prominent dynamical response in thermals
tire convective activity (discussed later). Untracked updrafts      via changes in the rate at which latent heat is released due to
are typically too small or too slow to be tracked with this         condensation. For example, following the reasoning by Fan
algorithm. Furthermore, the total mass flux is not uniquely         et al. (2018), a reduction in supersaturation rates could re-
defined and may contain spurious non-convective contribu-           sult from the larger number of smaller droplets (and, hence,
tions (e.g., Mrowiec et al., 2015). Finally, it is worth not-       more available surface area for condensation) as aerosol con-
ing that we find very similar properties of thermals in this        centrations increase. All else being equal, this could im-
study compared to what Hernandez-Deckers and Sherwood               ply a faster latent heat release due to condensation. How-
(2016) found with their higher-resolution simulations (65 m         ever, Fig. 3a indicates no prominent mean response in latent
horizontal grid spacing). The only prominent difference is          heating rates within the tracked thermals (summed over all
that our thermals are larger (R ∼ 1.2 km, compared to R ∼           source terms), while cloud nucleation rates increase and su-
0.3 km), which may be expected given our coarser spatial res-       persaturation rates decrease with increasing aerosol concen-
olution setting, but this could also be partially attributable to   trations (Fig. 2a and b). This implies that there is no promi-
differences in the case study conditions. Owing to the sim-         nent change in latent heating per unit of time available for the
ilarity of results to those of Hernandez-Deckers and Sher-          dynamics of the thermals, which indicates similar total con-
wood (2016), we expect that finer-resolution results would          densation rates despite changes in driving supersaturations.
be more converged but similar in nature.                            A possible explanation is that supersaturation differences are
                                                                    sustained within the context of negligibly different total con-
                                                                    densate production rates within the thermal core, but that hy-
3     Results
                                                                    pothesis cannot be definitively supported without additional
3.1    Thermal composites
                                                                    diagnostics that separate the sources of latent heat in future
                                                                    work. Figure 3b and c also show no notable changes in their
Figure 2 shows statistical composites of microphysics prop-         composite buoyancy (B) or vertical velocity (w). We do not
erties within tracked thermals from the selected background         find any prominent trends in terms of the thermals’ compos-
aerosol cases of 500, 1000, 2000, and 4000 cm−3 (i.e., for          ite lifetime, vertical distance traveled (DZ), or radius (R).
each subsequent doubling of aerosol concentrations). For            For R and DZ, this can be inferred from the vertical profiles
these composites, only the time step of the maximum as-             shown in Fig. 6b and d. Furthermore, the histograms of these
cent rate of each thermal is considered. The results demon-         quantities are negligibly changed (not shown).
strate that an increase in background aerosol concentrations
tends to (a) increase cloud droplet nucleation rates, (b) re-       3.2   Vertical profiles
duce supersaturation values, (c) increase cloud droplet num-
ber concentrations, and (d) decrease rain number concentra-         Since many of these variables have strong vertical dependen-
tions (Fig. 2a–d). Plots of average values of these quantities      cies, we next investigate these responses in terms of vertical
within thermals as a function of aerosol number concentra-          profiles of microphysical quantities, latent heating rates, ver-
tion (not shown here) reveal that nucleation rates, supersat-       tical velocity, and mass flux, as estimated from cloudy up-
uration values, and cloud drop number concentration behave          draft grid points (Fig. 4a–h) and from the tracked thermals
roughly linearly with aerosol number concentration, whereas         (Fig. 4i–p). To begin with, notice that the vertical profiles
rain number concentration decreases exponentially, which is         in both frameworks show qualitatively consistent features

https://doi.org/10.5194/acp-22-711-2022                                               Atmos. Chem. Phys., 22, 711–724, 2022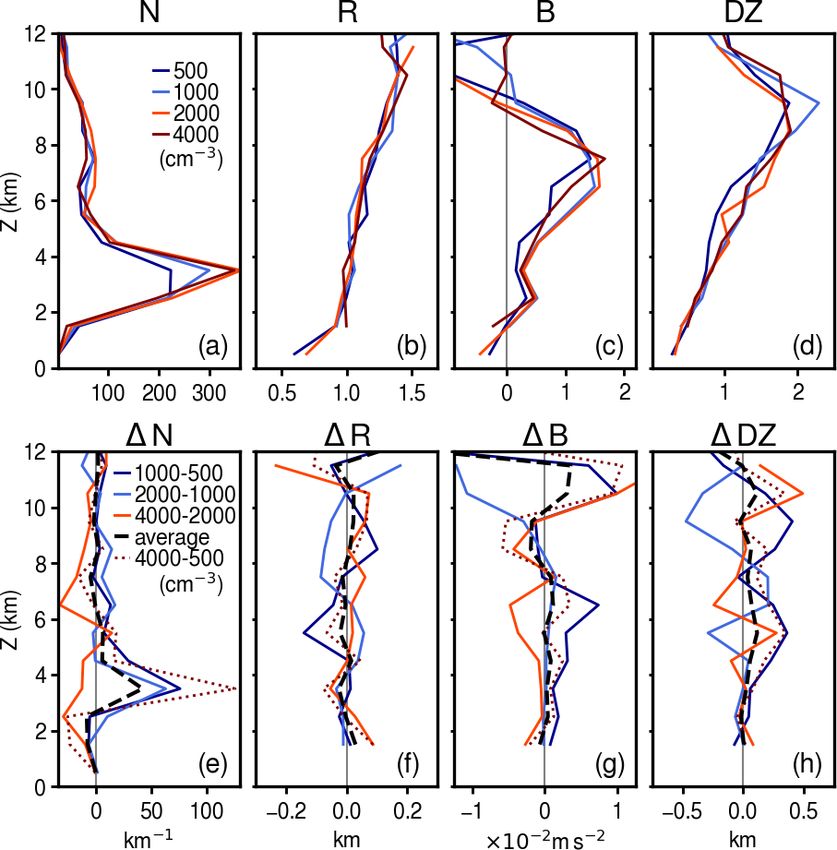
716                                                              D. Hernandez-Deckers et al.: Updraft dynamics and microphysics

Figure 2. Cross sections along the xz plane of mean values of (a) cloud nucleation rate, (b) supersaturation values, (c) cloud drop number
concentration (C no.), (d) rain number concentration (R no.), (e) cloud liquid water mixing ratio (Qc), and (f) rain mixing ratio (Qr), for
composites of all tracked thermals scaled by their radius (horizontal and vertical coordinates are in units of mean thermal radii). Each column
corresponds to a simulation with initial aerosol number concentration (indicated above in counts per cubic centimeter; hereafter cm−3 ). N
corresponds to the number of tracked thermals used for the composites. Arrows indicate the streamlines of the average flow in the reference
frame of the rising thermal. The dashed contour in supersaturation values corresponds to 100 % relative humidity.

at most elevations. Perhaps the most prominent difference                 7 km a.g.l., whereas, according to thermals, it continues to
between these two frameworks is that thermals indicate a                  increase, reaching its maximum near 10 km a.g.l. This sug-
larger contribution than cloudy updraft grid points to several            gests that the thermal sampling criteria is more selective of
quantities at levels above 6–7 km a.g.l. This is very clear in            vigorous updrafts aloft. This also results in a slightly more
terms of vertical velocity (Fig. 4g and o), where both frame-             top-heaviness of the profiles of other quantities, which re-
works yield very similar profiles up to ∼ 6–7 km a.g.l. but               flects how strongly coupled microphysical processes are with
significantly different values aloft. According to cloudy up-             updraft dynamics. In terms of mass flux, both frameworks
draft grid points, vertical velocity reaches its maximum near             yield a maximum near 3 km a.g.l., but thermals indicate a

Atmos. Chem. Phys., 22, 711–724, 2022                                                         https://doi.org/10.5194/acp-22-711-2022
D. Hernandez-Deckers et al.: Updraft dynamics and microphysics                                                                              717

Figure 3. Composites for all tracked thermals, as in Fig. 2, but for (a) latent heating rates, (b) buoyancy, and (c) vertical velocity.

Figure 4. Vertical profiles of the cloud nucleation rate (a, i), cloud number concentration (b, j), rain number concentration (c, k), cloud water
mixing ratio (d, l), rain water mixing ratio (e, m), latent heating rates (f, n), vertical velocity (g, o), and mass flux (h, p) for experiments
with different aerosol number concentrations (see the legend in panel a). Top panels (a–h) are computed from cloudy updraft grid points and
lower panels (i–p) from tracked thermals. Note the different scales used for mass flux in panels (h) and (p).

secondary maximum between 7 and 9 km a.g.l. Notice that                    but vigorous updrafts, a feature that may be better captured
this corresponds to the contribution of relatively few ther-               by the cumulus thermal framework.
mals (Fig. 6a), suggesting that, unlike near the cloud base                  It is important to point out that, throughout the 3 h period
where convection results from small contributions of many                  analyzed here, convection evolves and may behave differ-
updrafts, convection at mid and high levels near the cloud                 ently at different stages. To assess this, Figs. S1–S3 in the
top is more tightly linked to the contribution of relatively few           Supplement show profiles, as in Fig. 4, where the 3 h period
                                                                           has been divided into three stages. These profiles reflect the

https://doi.org/10.5194/acp-22-711-2022                                                         Atmos. Chem. Phys., 22, 711–724, 2022
718 D. Hernandez-Deckers et al.: Updraft dynamics and microphysics Figure 5. Differences between vertical profiles in Fig. 4, corresponding to each doubling of aerosol number concentrations (continuous colored lines), their average change (dashed black line), and the change between the two extreme cases, i.e., 4000 and 500 cm−3 (dotted line). Top panels (a–h) correspond to cloudy updraft grid points and lower panels (i–p) to tracked thermals. Note the different scales used for vertical velocity and for mass flux. fact that convection deepens with time but, otherwise, show expected, changes in vertical velocity closely follow changes consistency with Fig. 4. Furthermore, considering the entire in latent heating rates, but both are small on average, with 3 h period provides a larger sample of updrafts, which, in a high level of noise between different pairs of experiments turn, aids in reducing the noise. and more so in the cumulus thermal framework. For example, Regarding the responses to increases in aerosol concentra- in the comparison between 4000 and 500 cm−3 , we find an tions, both frameworks show overall agreement. To visualize increase of ∼ 10 % in the vertical velocity near heights of 6 these responses more clearly, Fig. 5 shows the differences be- and 11 km a.g.l. (consistent with findings by Marinescu et al., tween profiles for each successive doubling of aerosol con- 2021). The average response for a doubling of aerosol con- centrations, their average change, and the difference between centrations at these altitudes also suggests an increase, but it the most and least polluted cases. This figure also helps to is much weaker (∼ 2 %); however, not all individual pairs of identify in which quantities there is a consistent response to cases show such an increase, and the amplitude of the indi- increases in aerosol concentrations. Notice how linear the re- vidual responses is usually larger than the average one. sponse is for cloud nucleation rate and cloud droplet number Regarding mass flux, notice that its estimate based on concentration (Fig. 5a, b and i, j) and how the decrease in rain tracked thermals is ∼ 15 % of the cloudy updraft estimate number concentration behaves exponentially, with the largest (Fig. 4h and p). As shown by Hernandez-Deckers and Sher- changes for lower aerosol number concentrations (Fig. 5c wood (2016), the relatively low fraction captured by thermals and k). On the other hand, the increase in the cloud water results from mainly small and slow thermals that are harder mixing ratio is slightly offset by the decrease in the rain wa- to identify and track with our method; however, it is repre- ter mixing ratio (Fig. 5d–e and l–m), so that there is a slight sentative of the entire convective activity. In fact, notice that net decrease in total liquid water mixing ratio (not shown the changes in mass flux for each doubling are consistent be- here). However, the variability in the decrease in rain wa- tween the thermal estimate and the cloudy updraft grid point ter mixing ratio between pairs of experiments is significantly estimate (Fig. 5h and p). Here, too, the average response for higher than in the increase in the cloud water mixing ratio, doubling aerosol concentrations is weaker than the individual which also makes the net decrease in total water mass highly responses. In fact, it is nearly zero everywhere, except for a variable between simulations. slight increase around 4 km a.g.l. in the thermals’ framework, In contrast to the microphysical quantities, latent heat- which can be linked to an increase in the number of tracked ing rates, vertical velocity and mass flux do not reveal such thermals (Fig. 6e). prominent and consistent responses to aerosol concentrations Similar results are seen for other quantities relevant for cu- (Fig. 5f–h and n–p), and this is true in both frameworks. As mulus thermals (Fig. 6). A certain degree of correspondence Atmos. Chem. Phys., 22, 711–724, 2022 https://doi.org/10.5194/acp-22-711-2022
D. Hernandez-Deckers et al.: Updraft dynamics and microphysics 719
indication of a change in the sign of the trend across the full
dynamic range of aerosol variability. For instance, the dou-
bling aerosol initially increases buoyancy near 6 km a.g.l. but
ultimately decreases buoyancy at that elevation by a simi-
lar amount when reaching the highest aerosol concentration.
Similar responses can be seen in terms of w, DZ, and mass
flux, which is consistent with an aerosol-limited regime (e.g.,
Koren et al., 2014).
Average thermal size, which we estimate here with its
radius R, shows no systematic change related to aerosol
number concentrations (Fig. 6b and f). However, we do
find a response in the number of tracked thermals, partic-
ularly between 2–4 km a.g.l., where most thermals develop.
This response also seems to depend on the particular range
of aerosol variability, with more thermals being tracked as
aerosol concentrations increase in the cleaner regime (500–
2000 cm−3 ) and fewer thermals being tracked when aerosol
concentrations are doubled in the more polluted regime
(2000–4000 cm−3 ).
3.3 Thermals vs. cloudy updraft grid points
Figure 6. Vertical profiles of the (a) number of thermals (per ver-
tical kilometer), (b) average thermal radius, (c) average buoyancy, We have shown how our two sampling criteria provide a
and (d) average vertical distance traveled by thermals for the dif- general agreement in terms of the microphysical and dy-
ferent aerosol number concentrations (see the legend). Panels (e) namical responses to increases in aerosol number concen-
through (h) show the differences in the quantities of panels (a) trations. However, we have also noted differences which re-
through (d) between successive pairs of profiles (continuous colored
veal important features of thermal and grid point analyses.
lines), their average change (dashed black line), and the change be-
tween the two extreme cases, i.e., 4000 and 500 cm−3 (dotted color
The scatterplots in Fig. 7 show how relevant quantities av-
line). eraged within thermals compare to the same quantities aver-
aged over cloudy updraft grid points, both for different ver-
tical layers (circle dots) and for the entire columns (crosses)
in the different aerosol number concentration experiments.
can be seen between buoyancy changes (Fig. 6g) and vertical In general, these plots confirm that both thermal and cloudy
velocity changes (Fig. 5o), with hardly any average response grid points analyses are close to each other, but interesting
when doubling the aerosol concentrations, despite significant features emerge from their comparison.
(but not consistent) changes between individual pairs of sim- Cloud and rain number concentration, as well as cloud
ulations. Changes in the average vertical distance traveled by mass mixing ratio (Fig. 7a and e), appear to be similar be-
thermals (DZ; Fig. 6h) is also similar to changes in the ver- tween thermal and cloudy grid points but have slightly higher
tical velocity of thermals, especially its average response for values within thermals than for cloudy updraft grid points.
a doubling of aerosol concentrations (Fig. 5o). This indicates This is more prominent at higher altitudes, where thermals
that the average thermal lifetime (not shown here) is also in- tend to be larger and vigorous, and the same applies for rain
variant to aerosol number concentrations. number concentrations. In other words, at higher elevations,
All these quantities related to the thermals’ dynamics seem thermals differ more from the average cloudy conditions than
to respond only very weakly to changes in aerosol number at lower elevations, which emphasizes their important role in
concentrations, compared to the natural variability between the deepening of the convective cloud. At the near-surface
each pair of simulations. This is a known limitation when level (∼ 1 km a.g.l.), the cloud number and mass concentra-
investigating the aerosol invigoration of convection. Several tions are lower than the cloudy updraft grid points, most
studies have emphasized the difficulty of rising above the likely due to the thermal’s internal circulations that may in-
noise level when trying to identify aerosol indirect effects clude downdrafts and/or condensate-free volumes of air, but,
(e.g., Morrison and Grabowski, 2011; Grabowski, 2014). For nevertheless, are dynamically connected to the rising ther-
a given microphysics and dynamics framework, our results mals and their internal microphysical processes.
support this view from both the cloudy updraft and the ther- Rain mass mixing ratios also appear to be higher in ther-
mal frameworks regarding fundamental dynamical proper- mals than in cloudy updraft grid points but have, on aver-
ties, since results vary widely, depending on which pair of ex- age, similar values in both cases (Fig. 7f). When separated
periments is taken into account. However, we also see some by height, thermals at higher altitudes tend to have higher
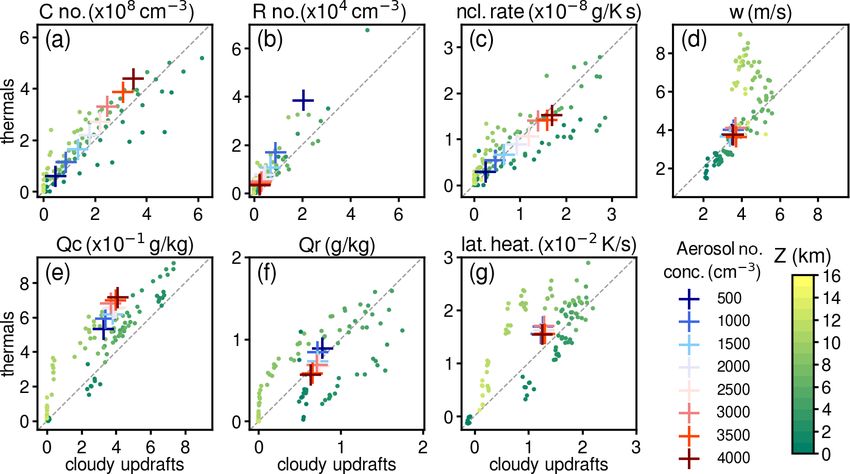
https://doi.org/10.5194/acp-22-711-2022 Atmos. Chem. Phys., 22, 711–724, 2022720 D. Hernandez-Deckers et al.: Updraft dynamics and microphysics Figure 7. Scatterplots of (a) cloud drop number concentrations (C no.), (b) rain number concentrations (R no.), (c) cloud nucleation rates, (d) vertical velocity (w), (e) cloud water mixing ratio (Qc), (f) rain water mixing ratio (Qr), and (g) latent heating rates, as obtained from averaging over thermals (vertical axis) and over cloudy updraft grid points (horizontal axis). Averages over thermals are computed by first obtaining an average value for each thermal and then averaging over all thermals at a certain altitude range (colored dots) or averaging over all thermals (crosses; colors according to aerosol number concentration of each experiment). Values for cloudy updraft grid points are obtained by averaging these per altitude range (colored dots) or per experiment (crosses). rain mass mixing ratios than cloudy updraft grid points, but In terms of overall column averages, we see that, for both the opposite is true at lower altitudes. This can be explained thermals and cloudy updraft grid points, latent heating rates, if one thinks of thermals at upper levels as the regions where and vertical velocity appears to be similar (Fig. 7d and g). rain is starting to form and, hence, have more rain mass than Regarding the relation between thermal averages and cloudy the average cloudy updraft grid points, whereas rain at lower updraft grid points, there are important differences with al- levels tends to be concentrated at downdraft regions where titude. For example, the average vertical velocity of cloudy rising thermals are limited. An interesting feature here is that updraft grid points and thermals follows the 1 : 1 line closely the average values per experiment cross the 1 : 1 line in such up to about 6 m s−1 . Average vertical velocity for thermals, in a way that thermals have higher rain mixing ratios than the particular above an altitude of about 6 km a.g.l., does exceed average cloudy updraft grid points in the cleaner cases but this value, while the average for cloudy updraft grid points lower rain mixing ratios in the polluted cases. This would be does not. To understand this, notice that the mass flux cap- in line with raindrops being larger (and fewer) in the polluted tured by thermals (Fig. 4e) has a first maximum just below cases, making them fall faster and less likely to be inside a 4 km a.g.l. and a second maximum around 8–9 km a.g.l. The rising thermal. first maximum coincides with the layer where most smaller Averaged over the entire vertical column, thermals and and short-lived thermals are found within the boundary layer; cloudy updraft grid points respond almost equally in terms the second maximum has about half the mass flux of the first of nucleation rates to varying aerosol number concentrations but only about a sixth of the number of thermals (Fig. 6a). (Fig. 7c). However, thermals tend to have slightly higher nu- Thus, the thermals above 6–7 km a.g.l. are not as numerous, cleation rates in the upper levels and lower nucleation rates in but larger ones individually contribute much more to the to- the lower levels compared to cloudy updraft grid points. This tal mass flux than those in the boundary layer. Increasing the small difference may be because thermals in the upper lev- vertical velocity threshold for the cloudy updraft grid point els tend to sample the larger, faster, and, hence, less diluted definition, while it does not modify the aerosol sensitivities updrafts, while the cloudy updraft grid points may also sam- found here, yields closer values between frameworks for sev- ple weaker, shorter-lived updrafts where nucleation rates are eral quantities at upper levels but at the expense of larger dif- lower. On the other hand, at lower altitudes, thermals tend to ferences at middle and lower levels that result in less overall be smaller and more numerous, likely sampling similar up- consistency (Figs. S4 and S5). Further investigation of the drafts as cloudy updraft grid points, but thermals include a detailed differences between the two frameworks at upper larger volume of air surrounding the updrafts, slightly reduc- levels is left for a future study, with a focus extended to ice ing their average nucleation rates. microphysical processes. Atmos. Chem. Phys., 22, 711–724, 2022 https://doi.org/10.5194/acp-22-711-2022
D. Hernandez-Deckers et al.: Updraft dynamics and microphysics                                                                  721

   Finally, the fact that latent heating rates tend to be higher   clusions could be drawn from each pair of experiments due
for thermals than for cloudy updraft grid points at a higher al-   to natural variability (e.g., Morrison and Grabowski, 2011;
titude (Fig. 7g) suggests that thermals are capturing the most     Grabowski, 2014) and several other factors, such as the syn-
relevant regions where condensation occurs and, thus, the          optic forcing, ambient relative humidity, the actual range of
most relevant convective regions of the cloud. Latent heating      aerosol concentrations, and specific microphysics schemes
rates of thermals largely exceed those of cloudy updraft grid      (Fan et al., 2007; White et al., 2017; Barthlott and Hoose,
points at higher altitude but underestimate at near-surface        2018; Iguchi et al., 2020; Abbott and Cronin, 2021; Mari-
level. These are very similar patterns of those combined from      nescu et al., 2021). Therefore, results of this type are usu-
cloud and rain mass mixing ratio (Fig. 7e–g). Overall, these       ally case and model dependent, and conclusions from a sin-
results highlight how both frameworks are generally consis-        gle model configuration or a single – or few – cases should
tent, while subtle differences between them can provide ad-        be interpreted with caution. Our simulations, which intend to
ditional useful information.                                       replicate a real continental case where only aerosol number
                                                                   concentrations are varied over an observationally established
                                                                   range, suggest that the natural variability largely surpasses
4   Summary and conclusions                                        the impact of aerosols on the dynamical features of convec-
                                                                   tion. It is, therefore, not surprising that intermodel variability
In order to investigate the coupling between updraft dynam-        has also been found to be larger than aerosol-related vari-
ics and microphysics, we study the impact of ambient aerosol       ability in terms of its impact on convection (e.g., Marinescu
concentration on deep convection in a series of eight simula-      et al., 2021).
tions at 250 m horizontal grid spacing of a case study over           Despite the uncertainties of the model response to back-
Houston, Texas, where initial background aerosol concen-           ground aerosol concentrations, the comparison between
trations are systematically varied from 500 to 4000 cm−3 in        cloudy updraft grid points and thermals indicates a general
intervals of 500 cm−3 . Apart from the traditional cloudy up-      agreement between both frameworks, while subtle differ-
draft grid point analysis (e.g., summarized in Tao et al., 2012;   ences between them allow us to identify important features.
Fan et al., 2016), we also identify and track cumulus thermals     Thermals, especially in the middle and upper troposphere,
and use these as an alternative sampling criteria to study the     are larger, more vigorous, and undiluted so that they nucleate
deep convective response to the imposed aerosol concentra-         higher droplet and raindrop concentrations and higher cloud
tions, based on the idea that thermals are the building blocks     water mixing ratios than the average cloudy updraft grid
of cumulus clouds (e.g., Sherwood et al., 2013; Varble et al.,     points and acting as rain incubators too. On the other hand,
2014; Romps and Charn, 2015). A comparative analysis be-           at the lower troposphere (below 4 km a.g.l.), where smaller,
tween cloudy updraft grid points and cumulus thermals pro-         short-lived thermals are predominant, the updraft velocity,
vide new insights into the coupling between updraft dynam-         cloud nucleation, and latent heating rates of thermals tend to
ics and microphysics.                                              be equivalent to or smaller than cloudy updraft grid points,
   As a first step, and given the uncertainties in the cur-        likely due to the thermals’ internal heterogeneity, which may
rent representation of convective microphysical processes,         also be important to consider. Consequently, microphysics
this study focuses only on the warm-phase microphysics.            quantities tend to also be equivalent or lower in thermals than
We find similar microphysical responses to an increase in          in cloudy updraft grid points at such altitudes. This suggests
aerosol concentrations for thermals and for cloudy updraft         that thermals and cloudy updraft grid points are similar sam-
grid point analyses because nucleation rates and cloud drop        pling criteria in the lower troposphere, but from the middle
number concentrations increase, while supersaturation val-         troposphere upward, large and vigorous thermals may offer
ues and rain number concentrations decrease. That is, more         a more selective sampling criteria that captures the most rel-
– but smaller – cloud droplets form, leading to fewer –            evant convective air masses where microphysical processes
but larger – raindrops. These responses are very consistent        are indeed most active. This increases the level of noise in the
throughout the entire sets of experiments, indicating a clear      thermal framework compared to the cloudy updraft grid point
connection to aerosol number concentrations in rising ther-        framework, but that may also represent information content
mals, and cloudy updraft grid points. However, average latent      regarding the scarcity of what have sometimes been referred
heating rates are not impacted by changing aerosol concen-         to as lucky updrafts.
trations, except in the middle troposphere (4 and 6 km a.g.l.),       On the other hand, the thermal tracking approach yields
where average ∼ 2 % increases of latent heating rates, as-         an abundance of additional information on the spatiotempo-
cent rate, and vertical velocity occur for every doubling of       ral evolution and life cycle of the structures that largely drive
aerosol number concentrations (similarly between thermal           hydrometeor production processes within convective clouds;
and cloudy updraft grid point analyses).                           indeed, this is the key information needed for subgrid-scale
   Nevertheless, these responses for thermals and cloudy up-       parameterizations in climate models and is the gray zone in
draft grid points are not entirely consistent between individ-     which convective processes remain poorly resolved. For in-
ual pairs of doubling experiments. Thus, very different con-       stance, efforts to extend climate model convection schemes

https://doi.org/10.5194/acp-22-711-2022                                               Atmos. Chem. Phys., 22, 711–724, 2022
722 D. Hernandez-Deckers et al.: Updraft dynamics and microphysics
that parameterize updraft velocities and use these to inform Financial support. This research has been supported by the
microphysical process rates (e.g., Wu et al., 2009) can draw U.S. Department of Energy ASR program (grant nos. DE-
upon the three-dimensionally colocated properties and pro- SC0021247 and DE-SC0016237), NASA PMM program (grant
cess statistics directly identified within the structures that no. 80NSSC19K0724), and Office of Science (BER; grant no. DE-
they seek to represent. The thermal approach is also likely to SC0006988).
naturally avoid the inclusion of oscillatory gravity wave mo-
tions, which may contribute substantially to mass flux espe-
Review statement. This paper was edited by Farahnaz Khosrawi
cially in stable regions of the atmosphere, such as the upper
and reviewed by three anonymous referees.
troposphere (Mrowiec et al., 2015). Overall, this further mo-
tivates the use of thermals as the basic elements to develop a
parameterization of coupled convective dynamics and micro-
physics for a climate model to better represent aerosol–deep References
convection interactions in the future.
Abbott, T. H. and Cronin, T. W.: Aerosol invigoration of atmo-
spheric convection through increases in humidity, Science, 371,
Code availability. The NASA-Unified WRF (NU-WRF) is main- 83–85, https://doi.org/10.1126/science.abc5181, 2021.
tained at NASA GSFC, and available for public use upon request Abdul-Razzak, H. and Ghan, S. J.: A parameterization of aerosol
(https://nuwrf.gsfc.nasa.gov/, NUWRF, 2022). NU-WRF outputs activation: 2. Multiple aerosol types, J. Geophys. Res.-Atmos.,
are available upon request from the NASA GSFC Cloud Library 105, 6837–6844, https://doi.org/10.1029/1999JD901161, 2000.
(https://portal.nccs.nasa.gov/cloudlibrary/, GSFC, 2022). All other Barthlott, C. and Hoose, C.: Aerosol Effects on Clouds and Pre-
processing code used for this study is available upon request to the cipitation over Central Europe in Different Weather Regimes, J.
authors. Atmos. Sci., 75, 4247–4264, https://doi.org/10.1175/JAS-D-18-
0110.1, 2018.
Blyth, A. M., Lasher-Trapp, S. G., and Cooper, W. A.: A study of
thermals in cumulus clouds, Q. J. Roy. Meteor. Soc., 131, 1171–
Supplement. The supplement related to this article is available
1190, https://doi.org/10.1256/qj.03.180, 2005.
online at: https://doi.org/10.5194/acp-22-711-2022-supplement.
Damiani, R., Vali, G., and Haimov, S.: The Structure of Thermals
in Cumulus from Airborne Dual-Doppler Radar Observations, J.
Atmos. Sci., 63, 1432–1450, https://doi.org/10.1175/JAS3701.1,
Author contributions. All authors conceived and designed the 2006.
research. TM carried out the model simulations and performed the de Roode, S. R. and Bretherton, C. S.: Mass-Flux
cloudy updraft grid point analyses. DHD performed the thermal Budgets of Shallow Cumulus Clouds, J. Atmos.
tracking and its analysis and led the writing of the paper, with input Sci., 60, 137–151, https://doi.org/10.1175/1520-
from all authors. 0469(2003)0602.0.CO;2, 2003.
Fan, J., Zhang, R., Li, G., and Tao, W.-K.: Effects of aerosols and
relative humidity on cumulus clouds, J. Geophys. Res.-Atmos.,
Competing interests. The contact author has declared that nei- 112, D14204, https://doi.org/10.1029/2006JD008136, 2007.
ther they nor their co-authors have any competing interests. Fan, J., Wang, Y., Rosenfeld, D., and Liu, X.: Review
of Aerosol–Cloud Interactions: Mechanisms, Signifi-
cance, and Challenges, J. Atmos. Sci., 73, 4221–4252,
Disclaimer. Publisher’s note: Copernicus Publications remains https://doi.org/10.1175/JAS-D-16-0037.1, 2016.
neutral with regard to jurisdictional claims in published maps and Fan, J., Rosenfeld, D., Zhang, Y., Giangrande, S. E., Li, Z.,
institutional affiliations. Machado, L. A. T., Martin, S. T., Yang, Y., Wang, J., Artaxo, P.,
Barbosa, H. M. J., Braga, R. C., Comstock, J. M., Feng, Z.,
Gao, W., Gomes, H. B., Mei, F., Pöhlker, C., Pöhlker, M. L.,
Acknowledgements. We thank the NASA Advanced Super- Pöschl, U., and de Souza, R. A. F.: Substantial convection
computing (NAS) Division, for providing the computational re- and precipitation enhancements by ultrafine aerosol particles,
sources to conduct and analyze the NU-WRF simulations. We Science, 359, 411–418, https://doi.org/10.1126/science.aan8461,
also thank the three anonymous reviewers, for their constructive 2018.
comments which greatly improved the paper. Toshihisa Matsui Fridlind, A. M., Li, X., Wu, D., van Lier-Walqui, M., Acker-
has been funded by the U.S. Department of Energy ASR pro- man, A. S., Tao, W.-K., McFarquhar, G. M., Wu, W., Dong, X.,
gram (grant no. DE-SC0021247) and NASA PMM program (grant Wang, J., Ryzhkov, A., Zhang, P., Poellot, M. R., Neu-
no. 80NSSC19K0724). Ann M. Fridlind has been supported by the mann, A., and Tomlinson, J. M.: Derivation of aerosol pro-
Office of Science (BER) and U.S. Department of Energy (grant files for MC3E convection studies and use in simulations of the
nos. DE-SC0006988 and DE-SC0016237), and Daniel Hernandez- 20 May squall line case, Atmos. Chem. Phys., 17, 5947–5972,
Deckers has been funded by Universidad Nacional de Colombia. https://doi.org/10.5194/acp-17-5947-2017, 2017.
Fridlind, A. M., van Lier-Walqui, M., Collis, S., Giangrande, S. E.,
Jackson, R. C., Li, X., Matsui, T., Orville, R., Picel, M. H.,
Rosenfeld, D., Ryzhkov, A., Weitz, R., and Zhang, P.: Use of
Atmos. Chem. Phys., 22, 711–724, 2022 https://doi.org/10.5194/acp-22-711-2022D. Hernandez-Deckers et al.: Updraft dynamics and microphysics 723 polarimetric radar measurements to constrain simulated convec- Morrison, H. and Grabowski, W. W.: Modeling Supersat- tive cell evolution: a pilot study with Lagrangian tracking, At- uration and Subgrid-Scale Mixing with Two-Moment mos. Meas. Tech., 12, 2979–3000, https://doi.org/10.5194/amt- Bulk Warm Microphysics, J. Atmos. Sci., 65, 792–812, 12-2979-2019, 2019. https://doi.org/10.1175/2007JAS2374.1, 2008. Grabowski, W. W.: Extracting Microphysical Impacts in Large- Morrison, H. and Grabowski, W. W.: Cloud-system resolving model Eddy Simulations of Shallow Convection, J. Atmos. Sci., 71, simulations of aerosol indirect effects on tropical deep con- 4493–4499, https://doi.org/10.1175/JAS-D-14-0231.1, 2014. vection and its thermodynamic environment, Atmos. Chem. GSFC: Goddard Space Flight Center Data Portal – Cloud Library, Phys., 11, 10503–10523, https://doi.org/10.5194/acp-11-10503- available at: https://portal.nccs.nasa.gov/cloudlibrary/, last ac- 2011, 2011. cess: 11 January 2022. Morrison, H. and Milbrandt, J. A.: Parameterization of Cloud Hernandez-Deckers, D. and Sherwood, S. C.: A numerical Microphysics Based on the Prediction of Bulk Ice Particle study of cumulus thermals, J. Atmos. Sci., 73, 4117–4136, Properties. Part I: Scheme Description and Idealized Tests, J. https://doi.org/10.1175/JAS-D-15-0385.1, 2016. Atmos. Sci., 72, 287–311, https://doi.org/10.1175/JAS-D-14- Hernandez-Deckers, D. and Sherwood, S. C.: On the Role of En- 0065.1, 2015. trainment in the Fate of Cumulus Thermals, J. Atmos. Sci., 75, Morrison, H. and Peters, J. M.: Theoretical Expressions for the As- 3911–3924, https://doi.org/10.1175/JAS-D-18-0077.1, 2018. cent Rate of Moist Deep Convective Thermals, J. Atmos. Sci., Iguchi, T., Rutledge, S. A., Tao, W.-K., Matsui, T., Dolan, B., 75, 1699–1719, https://doi.org/10.1175/jas-d-17-0295.1, 2018. Lang, S. E., and Barnum, J.: Impacts of Aerosol and Moser, D. H. and Lasher-Trapp, S.: The Influence of Suc- Environmental Conditions on Maritime and Continen- cessive Thermals on Entrainment and Dilution in a Sim- tal Deep Convective Systems Using a Bin Microphysical ulated Cumulus Congestus, J. Atmos. Sci., 74, 375–392, Model, J. Geophys. Res.-Atmos., 125, e2019JD030952, https://doi.org/10.1175/jas-d-16-0144.1, 2017. https://doi.org/10.1029/2019JD030952, 2020. Mrowiec, A. A., Pauluis, O. M., Fridlind, A. M., and Acker- Khain, A. P., BenMoshe, N., and Pokrovsky, A.: Factors Determin- man, A. S.: Properties of a Mesoscale Convective System in the ing the Impact of Aerosols on Surface Precipitation from Clouds: Context of an Isentropic Analysis, J. Atmos. Sci., 72, 1945–1962, An Attempt at Classification, J. Atmos. Sci., 65, 1721–1748, https://doi.org/10.1175/JAS-D-14-0139.1, 2015. https://doi.org/10.1175/2007JAS2515.1, 2008. NUWRF: NASA-Unified Weather Research and Forecasting, Koren, I., Dagan, G., and Altaratz, O.: From aerosol-limited to in- available at: https://nuwrf.gsfc.nasa.gov/, last access: 11 Jan- vigoration of warm convective clouds, Science, 344, 1143–1146, uary 2022. https://doi.org/10.1126/science.1252595, 2014. Peters, J. M., Morrison, H., Varble, A. C., Hannah, W. M., and Gian- Korolev, A., Heckman, I., Wolde, M., Ackerman, A. S., grande, S. E.: Thermal Chains and Entrainment in Cumulus Up- Fridlind, A. M., Ladino, L. A., Lawson, R. P., Milbrandt, J., and drafts. Part II: Analysis of Idealized Simulations, J. Atmos. Sci., Williams, E.: A new look at the environmental conditions favor- 77, 3661–3681, https://doi.org/10.1175/JAS-D-19-0244.1, 2020. able to secondary ice production, Atmos. Chem. Phys., 20, 1391– Peters-Lidard, C. D., Kemp, E. M., Matsui, T., Santanello, J. A., 1429, https://doi.org/10.5194/acp-20-1391-2020, 2020. Kumar, S. V., Jacob, J. P., Clune, T., Tao, W.-K., Chin, M., Lecoanet, D. and Jeevanjee, N.: Entrainment in Re- Hou, A., Case, J. L., Kim, D., Kim, K.-M., Lau, W., Liu, Y., solved, Dry Thermals, J. Atmos. Sci., 76, 3785–3801, Shi, J., Starr, D., Tan, Q., Tao, Z., Zaitchik, B. F., Zavod- https://doi.org/10.1175/JAS-D-18-0320.1, 2019. sky, B., Zhang, S. Q., and Zupanski, M.: Integrated mod- Marinescu, P. J., van den Heever, S. C., Heikenfeld, M., Bar- eling of aerosol, cloud, precipitation and land processes at rett, A. I., Barthlott, C., Hoose, C., Fan, J., Fridlind, A. M., satellite-resolved scales, Environ. Modell. Softw., 67, 149–159, Matsui, T., Miltenberger, A. K., Stier, P., Vie, B., White, B. A., https://doi.org/10.1016/j.envsoft.2015.01.007, 2015. and Zhang, Y.: Impacts of Varying Concentrations of Cloud Romps, D. M. and Charn, A. B.: Sticky Thermals: Ev- Condensation Nuclei on Deep Convective Cloud Updrafts– idence for a Dominant Balance between Buoyancy and A Multimodel Assessment, J. Atmos. Sci., 78, 1147–1172, Drag in Cloud Updrafts, J. Atmos. Sci., 72, 2890–2901, https://doi.org/10.1175/JAS-D-20-0200.1, 2021. https://doi.org/10.1175/JAS-D-15-0042.1, 2015. Matsui, T., Zhang, S. Q., Lang, S. E., Tao, W.-K., Ichoku, C., Rosenfeld, D., Lohmann, U., Raga, G. B., O’Dowd, C. D., Kul- and Peters-Lidard, C. D.: Impact of radiation frequency, pre- mala, M., Fuzzi, S., Reissell, A., and Andreae, M. O.: Flood or cipitation radiative forcing, and radiation column aggregation Drought: How Do Aerosols Affect Precipitation?, Science, 321, on convection-permitting West African monsoon simulations, 1309–1313, https://doi.org/10.1126/science.1160606, 2008. Clim. Dynam., 55, 193–213, https://doi.org/10.1007/s00382- Rosenfeld, D., Williams, E., Andreae, M. O., Freud, E., Pöschl, U., 018-4187-2, 2020. and Rennó, N. O.: The scientific basis for a satellite McFarlane, N.: Parameterizations: representing key processes in mission to retrieve CCN concentrations and their impacts climate models without resolving them, WIREs Clim. Change, on convective clouds, Atmos. Meas. Tech., 5, 2039–2055, 2, 482–497, https://doi.org/10.1002/wcc.122, 2011. https://doi.org/10.5194/amt-5-2039-2012, 2012. Morrison, H.: Impacts of Updraft Size and Dimensionality on the Scorer, R. S. and Ludlam, F. H.: Bubble theory of pene- Perturbation Pressure and Vertical Velocity in Cumulus Convec- trative convection, Q. J. Roy. Meteor. Soc., 79, 94–103, tion. Part II: Comparison of Theoretical and Numerical Solu- https://doi.org/10.1002/qj.49707933908, 1953. tions and Fully Dynamical Simulations, J. Atmos. Sci., 73, 1455– Sherwood, S. C., Hernandez-Deckers, D., Colin, M., and Robin- 1480, https://doi.org/10.1175/jas-d-15-0041.1, 2016. son, F.: Slippery Thermals and the Cumulus Entrainment Para- https://doi.org/10.5194/acp-22-711-2022 Atmos. Chem. Phys., 22, 711–724, 2022
You can also read