Understanding Political Polarisation using Language Models: A dataset and method
←
→
Page content transcription
If your browser does not render page correctly, please read the page content below
Understanding Political Polarisation using Language Models:
                                                                           A dataset and method

                                                                 Samiran Gode,1 Supreeth Bare, 1 Bhiksha Raj, 1 Hyungon Yoo, 1
                                                                                                Carnegie Mellon University

                                                                    Abstract                                    cal system, the methods we suggest for measuring polariza-
arXiv:2301.00891v1 [cs.CL] 2 Jan 2023

                                                                                                                tion would be useful for other countries with similar demo-
                                          Our paper aims to analyze political polarization in US polit-         cratic elections in determining how polazised a candidate is.
                                          ical system using Language Models, and thereby help candi-
                                                                                                                We first try classical methods such as Word2Vec(Mikolov
                                          dates make an informed decision. The availability of this in-
                                          formation will help voters understand their candidates’ views         et al. 2013) and Doc2Vec(Le and Mikolov 2014) to under-
                                          on the economy, healthcare, education and other social is-            stand if we can find polarization using the data we have
                                          sues. Our main contributions are a dataset extracted from             and gain more insights. We find that words that are politi-
                                          Wikipedia that spans the past 120 years and a Language                cally sensitive(Center 2019) are related to other words which
                                          model-based method that helps analyze how polarized a can-            are politically sensitive(Center 2019). We thus move on to
                                          didate is. Our data is divided into 2 parts, background infor-        more recent and sophisticated models built using Transform-
                                          mation and political information about a candidate, since our         ers(Vaswani et al. 2017) to gain more insight into the data.
                                          hypothesis is that the political views of a candidate should be       We then use these, in particular, longformers(Beltagy, Pe-
                                          based on reason and be independent of factors such as birth-          ters, and Cohan 2020) to project candidate-specific data into
                                          place, alma mater, etc. We further split this data into 4 phases
                                                                                                                a particular embedding space and then use this data to find
                                          chronologically, to help understand if and how the polariza-
                                          tion amongst candidates changes. This data has been cleaned           the nearest neighbors of each candidate and provide one
                                          to remove biases. To understand the polarization we begin             metric to find how polarized a candidate is.
                                          by showing results from some classical language models in
                                          Word2Vec and Doc2Vec. And then use more powerful tech-                                      Related Work
                                          niques like the Longformer, a transformer-based encoder, to
                                                                                                                (KhudaBukhsh et al. 2021) talks about political polariza-
                                          assimilate more information and find the nearest neighbors of
                                          each candidate based on their political view and their back-          tion online and uses machine translation to interpret politi-
                                          ground.                                                               cal polarization on the internet. (Bhatt et al. 2018) discusses
                                                                                                                the impacts of hyper-partisan websites on influencing public
                                                                                                                opinion as illustrated by their ability to affect certain events
                                                                Introduction                                    in the 2016 US general elections. The authors then go on to
                                        Polarization among the two main parties in the US, Republi-             show how certain political biases are assumed for the pur-
                                        can and Democratic, has been studied for a long time ((Poole            pose of their study, namely overt support for either a Demo-
                                        and Rosenthal 1984),(KhudaBukhsh et al. 2021)). A lot of                crat or Republican is taken to be an indicator of the site being
                                        the discussion online has become polarized(Jiang, Robert-               either Liberal or Conservative. This paper is fundamental to
                                        son, and Wilson 2020), and this discussion gets the most                our research as it looks into the political division and lays
                                        traction online(Jiang, Robertson, and Wilson 2020). This po-            the foundation for any following work in the domain of us-
                                        larization can affect the decision-making ability of a candi-           ing specific features to classify an entity as being Liberal or
                                        date if selected(Chen, Li, and Liu 2022). In such scenarios, it         Conservative. The features they considered were transcripts
                                        is important for users to be able to separate the rhetoric and          of the content being published or shared on these sites. In our
                                        understand how polar a candidate is. With this work, we set             case, the features will simply be the Wikipedia page content
                                        out to ask exactly these questions, ”Can we measure how po-             of the people. (KhudaBukhsh et al. 2022) shows the polar-
                                        larizing a candidate is?”, ”Can we measure how much this                ization in TV media and fringe new networks and uses Lan-
                                        polarity has changed over time?”, We try to answer these                guage model-based techniques to understand them further.
                                        questions using Natural Language based techniques and in                However, this polarization visible in the electorate stems
                                        the process, create a dataset that will be useful for the re-           from the candidates. (DeSilver 2022) claims that the can-
                                        search community in trying to understand political polariza-            didates become polarized and moved away from the center
                                        tion in the US. Though we have worked on the US politi-                 over the years. With this paper, we release a dataset and a
                                                                                                                few metrics that will help us understand if political polariza-
                                        Copyright © 2023, Association for the Advancement of Artificial         tion exists in political candidates and how we might be able
                                        Intelligence (www.aaai.org). All rights reserved.                       to measure this political polarization. The aim of this study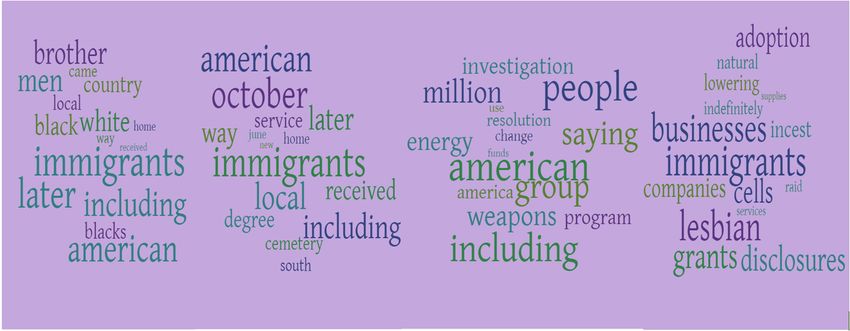
is to aid voters to make informed decisions before elections.        are easily learnable. The Authors also demonstrate the us-
And we use language-based techniques on a dataset that is            age of other models (unidirectional and bi-directional) in the
classified into 4 eras and divided into 3 parts, mainly back-        study, namely ’fariseq-fconv’ and ’Transformer-XL’. They
ground, political and other.                                         conclude by showing that BERT-Large is able to outperform
   (Belcastro et al. 2020) Demonstrates that Political Polar-        other models and compete even with supervised models for
ization can be mapped with the help of Neural Networks.              the same Task.
This is almost a baseline idea as we are using attention net-           (Palakodety, KhudaBukhsh, and Carbonell 2020) demon-
works and Longformer models for the same. The key differ-            strates the ability of BERT and similar LM’s to track com-
ence lies in the data extraction and methodology.                    munity perception, aggregate opinions and compare the pop-
   (Khadilkar, KhudaBukhsh, and Mitchell 2022) goes in               ularity of political parties and candidates. This is demonstra-
depth towards finding gender and racial bias in a large sam-         tive of our work as we intend to use BERT for the purpose
ple of Bollywood (and Hollywood) movies. The author has              of sentiment analysis. The authors conclude by stating that
amalgamated several known NLP models while he tries to               the LM can be used as a pipeline for extracting Data in the
create a reasonably robust model of his own. The portions in         future.
which this particular study differs from those before is that           In (Hamilton, Leskovec, and Jurafsky 2016) the authors
the sample size is fairly large. It then diverges further with its   try to counter the problem of word meaning changing se-
rather innovative use of diachronic-word embedding associ-           mantically with context. They propose a robust method by
ation tests (WEAT). Other techniques that are implemented            using embeddings. These are then evaluated with the ’Law
include count-based statistics dependent on a highly popu-           of Conformity’ and ’The Law of Innovation’. These display
lar lexicon cloze test using BERT as a base model (an idea           the role of frequency and polysemy in the building struc-
we could consider after data attention) and bias recognition         tural blocks of language. These blocks will be crucial for
using WEAT. The final model is a combination of the above            2 reasons, (1) The meaning changes may adversely affect
three. This paper is highly relevant to our project as it uses       sentiment analysis and thus affect results. Thus frequency
a similar idea of our own. It uses aforementioned models             and polysemy must be duly curtailed. (2) The embedding
to predict bias, i.e. sentiment prediction. In our project, we       research is fundamental as we are using embedding-based
use data to predict political sentiment and attempt to classify      models. Specifically Word2vec.
certain features as being precursors to classification.
   (Rajani et al. 2019) tried to improve speech-based models                           Dataset Description
on their ability to verbalize the reasoning that they learned
                                                                     Source
during training. It uses the CAGE framework (Common-
Sense Auto-Generated Explanations) on the common sense               Our data is sourced from the individual pages of politi-
explanation dataset to increase the effectiveness by 10 per-         cians(Senators and Congress members) from the 58th to the
cent. It introduces improvements over the use of BiDAF++             117th congress. We divide these into 4 phases, chronolog-
(augmented with self-attention layer) in these newer mod-            ically, with each phase consisting of about 14 congresses.
els. It further uses NLE as rationale generalization within          For each congress member, we scrape the section-wise data.
the second phase primarily as means for sentiment analysis.
In this paper, Mturk (from Amazon) is used to generate ex-           Data Collection and Processing
planations for the dataset. CAGE primarily uses a question-          We scrape Wikipedia based on the list of politicians from
answer format with 3 options, a label and the best expla-            the Wikipedia page for each congress. For each congress
nation for that label. Furthermore, other evaluation param-          member in the list, we store the label, their party and the
eters affecting performance are tested and may be used in            metadata. For each instance, this includes their personal de-
our project either as verification models or otherwise. CAGE         tails and all the information from their page as a dictio-
is certainly an interesting choice for verification given the        nary, with the heading being the keys and the content be-
higher accuracy it attains. A factor to be considered how-           ing the value. This information helps with the downstream
ever is that the types of datasets and models are very dif-          task of cleaning. We annotate this data based on the exper-
ferent. Thus certain modifications will be made to the above         iment, in our case we have manually annotated the data to
framework.                                                           classify these keys into three separate categories. 1) Back-
   (Devlin et al. 2018) is the introduction paper for BERT,          ground data, 2) Political data, 3) Other; in our release, we
a model that will be used extensively. It also shows the re-         will be releasing both the annotated and raw versions to
sults of fine-tuning BERT. These indirectly or directly will         facilitate custom use. Wikipedia page sections don’t have
be used either as pre-trained constraints or as tuning meth-         a fixed format, each politician has different key sections.
ods. petroni2019language                                             For instance, Early Life and Background can be split into
   (Petroni et al. 2019) Demonstrates the ability of pre-            many sections such as Education, Career, Family, Personal
trained high-capacity models like BERT and ELMo to be                History, etc. So all these sections are grouped into a sin-
used as knowledge repositories. This is mainly based on 3            gle category Background. Similarly, anything related to their
observations, (1) The relational knowledge of these models           political affiliation, elections, campaigns and positions held
is competitive to that of an NLP with access to certain oracle       during their tenure are categorized into a single annotation
knowledge. (2) The effectiveness of BERT in an open do-              Political Career. All other categories such as Awards, Con-
main question answer test and (3) The fact that certain facts        troversies, Business related activity, Post political career are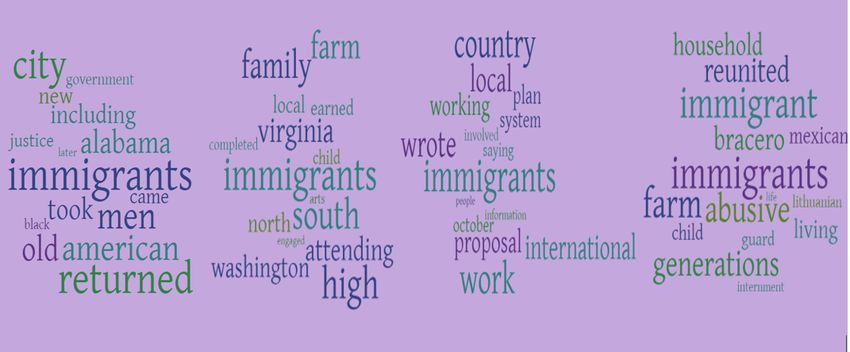
clubbed under the Others category. This way, only relevant
data is selected under each category by manually chang-
ing the annotation based on the content inside each cate-
gory. To conclude, for just Phase 4, a total of 1656 cate-
gories were merged into 3 categories for 1631 instances in
the first pass spread over roughly 26 years(1995-2021). This
data still contains information names, organizations, loca-
tions, numbers, etc. which need to be cleaned. We first run
a NER model on the data to remove the names and organi-
zation. However, we remove location names only from the
political section. The reasoning behind this is, to make sure
information from the political section is not influenced by
location information. However, for background, we want to
understand where a person was born and raised affects their
political views and for this only this was kept but others were
deleted. This information, after the NER, is passed to re-                             Figure 3: Political
move numbers and other irrelevant regular expressions. This
makes sure the data being passed for other downstream tasks
is clean and gives unbiased answers.                              et al. 2019) have been state of the art since 2018 but when
                                                                  it comes to our dataset, these models have a drawback, that
                                                                  is, their ability to process longer sequences since the cost of
                                                                  attention grows on the order of O(N2 ). Longformer(Beltagy,
                                                                  Peters, and Cohan 2020) and other variants are useful for
                                                                  this task, they accept 4096 input tokens as opposed to 512
                                                                  for BERT. It reduces model complexity by reformulating the
                                                                  self-attention computation. The performance of Longformer
                                                                  against the current SOTA is represented by the table present
                                                                  below on the raw data.

                                                                                        Experiments
                                                                  Preliminary Experiments
                                                                  Our initial experiments were aimed at gaining insights about
         Figure 1: Webscraping based on each Tag                  patterns or trends that might be present in our data, and
                                                                  also questioning if polarization exists. We do these prelimi-
                                                                  nary experiments using the Doc2Vec(Le and Mikolov 2014)
                                                                  and Word2Vec(Mikolov et al. 2013) models. The Doc2Vec
                                                                  model was built from scratch with the raw data, where each
                                                                  Wikipedia page is considered to be a document. We first
                                                                  use the Doc2Vec model with K-means clustering and get
                                                                  a classification accuracy of 59.52% with political data and
                                                                  61.846% with background data. We then used the same
                                                                  Doc2Vec model with binary SVM classifier and achieved an
                                                                  accuracy of 72.872% with political data and 63.564% with
                                                                  background data. These results are summarized in the ta-
                                                                  ble presented below. The Word2Vec tests were run on pre-
                                                                  trained models as well as models we built from scratch and
                                                                  trained using the data we collected. We used the Word2Vec
                                                                  approach to find approximate nearest neighbors and exact
                                                                  nearest neighbors for certain words on both the Democratic
                                                                  and the Republican sides. This nearest-neighbor approach
                                                                  led to some interesting insights. We expected to see some
                   Figure 2: Background                           disparity in the nearest neighbor searches for the Repub-
                                                                  lican data and Democratic data basis the assumption that
                                                                  there is polarization. However using the simple Word2Vec
                    Language Model                                models the 15 nearest neighbors we got were quite simi-
Natural Language Processing based applications have been          lar but as there were certain words for whom the order of
dominated by transformer-based language models where              the neighbors changed based on the party, for example, for
models like BERT(Devlin et al. 2018) and RoBERTa(Liu              the word ’GUN’ , ’VIOLENCE’ is the 2nd nearest neigh-
bor(approximate nearest neighbor using spotify’s annoy al-
gorithm) for democratic data however the same word is 9th
for the republican case, similarly the word ’CHECKS’ is
the 3rd nearest neighbor for democrats while it is the 8th
for republicans. There are more such interesting examples
which coupled with the results from the Doc2Vec classifica-
tion results, prove that political polarization exists and can
be learned using Natural Language Processing based tech-
niques.
Main analysis Figure 4: Nearest neighboring words to the word immigrant in the
As part of our preliminary analysis, we use RoBERTa, democratic corpus across time from left to right, as we can see, words
we notice the removal of the words ”Democratic”, ”Re- like americans were closely associated in the early 20th century.
publican” etc. causing a drop in classification. This is ex-
pected as we lose obvious information and classifying just
based on the first 512 tokens is challenging. We hence
use Longformer since it can consider 4096 tokens at a
time. As expected, this increases the score significantly, as
can be seen in the table. There are two versions of Long-
former - ”longformer-base-4096” and ”longformer-large-
4096. Longformer base provides a significant improvement
over the previous model RoBERTa and simpler models such
as Doc2Vec. However Longformer large provided a better
score and has been the best performing model when it comes
Figure 5: Nearest neighboring words to the word immigrant in the re-
to classifying a given candidate’s political party. We also an-
publican corpus, the words are similar in the 1st era, the early 20th
alyze using BigBird which is yet another model which can
century, but in the most recent era it is related to other politically sen-
consider tokens with lengths of 4096, the results of these
sitive words.
experiments are in the table. We use this information to un-
derstand how different scores are affected by different words
and relate this with our broader aim of Political polarization.
For that, we calculate the global attention scores of the last background dataset to get insight into the factors that in-
layer and then find the words that have the highest atten- fluence political polarization. The obtained results are pre-
tion scores for self-attention with the < s > token. This sented in the following table.
has shown some interesting results, for example, for Ted Apart from these accuracy tests, we also leverage the at-
Stevens, a Republican, some obvious words like, ”public”, tention mechanism of the Longformer model. We find the
”federal”, ”legislature”, ”Wisconsin” show up higher which words with the highest attention scores to correlate them
is expected since the main information from the political text with our theory of political polarization. We have also de-
is related to their work, but the word ”abortion” showed up signed an interactive website that helps you to understand if
in the top 10 percentile words, more such analysis is being polarization exists. The website finds the nearest neighbors
done which we believe will give more interesting results, the of the selected politicians from the Longformer output. Then
above analysis for simpler models like BERT isn’t as im- depending on the ratio of Republicans to Democrats in the
pressive since the information is local and for Longformer nearest neighbors, we estimate the politician’s polarization.
this not trivial since Longformer looks as context using slid- One such example is shown below-
ing windows, however, the Longformer architecture allows In the graph, the x-axis is the rank of the 20 closest neigh-
for certain tokens to have global attention and choosing the bors for the politician you choose given the dataset and the
CLS token allows us to look at the attention of all 4096 to- y-axis shows their respective closeness scores. The color
kens with this word. Another hypothesis that we have been blue is for Democrats and red for Republicans. The ratio
testing is that the background of a candidate can also help us is Blue vs Red points in this graph, so one of our hypothe-
identify the political leaning of a person which if the world ses is that if a politician isn’t polarized this ratio should be
was not polarized would not be the case and only the po- 0.5(democrat/total) if we just look at the background data.
litical information would help us classify, however as can
be seen in the table the background matters significantly as
Model Data Accuracy
well.
Doc2Vec Political 59.520
Doc2Vec Background 61.846
Results Allenai/longformer-large-4096 Political 52.128
We tested different models with the annotated raw dataset Allenai/longformer-large-4096 Background 56.383
to understand the polarization in the text. The three mod-
els were tested with both the political career dataset and the Table 1: K-means Classification ResultsModel Data Accuracy stand the views of a candidate and measure how polarizing
Doc2Vec Political 72.872 their views are. We also hope that the spread of this data
Doc2Vec Background 63.564 across multiple decades will help us understand how politi-
Allenai/longformer-large-4096 Political 76.862 cal ideas have changed over time.
Allenai/longformer-large-4096 Background 69.681
Table 2: Binary SVM Classification Results Future Work
For future work, we aim to use other metrics for finding the
political polarization of individuals and communities again
using the Wikipedia dataset. Specifically, we want to use the
attention tokens mentioned above to look at the ratio of to-
kens from the background to the political given text from a
candidate that is equally distributed across the background
and political.
Acknowledgments
We would like to thank Yash Jain and Viraj Ranade for their
contributions.
References
Belcastro, L.; Cantini, R.; Marozzo, F.; Talia, D.; and Trun-
Figure 6: Nearest neighbors for political data belonging fio, P. 2020. Learning political polarization on social media
to Mitch McConnell (Republican) using neural networks. IEEE Access, 8: 47177–47187.
Beltagy, I.; Peters, M. E.; and Cohan, A. 2020. Long-
former: The long-document transformer. arXiv preprint
arXiv:2004.05150.
Bhatt, S.; Joglekar, S.; Bano, S.; and Sastry, N. 2018. Illu-
minating an ecosystem of partisan websites. In Companion
Proceedings of the The Web Conference 2018, 545–554.
Center, P. R. 2019. In a politically polarized era, sharp di-
vides in both partisan coalitions. In a Politically Polarized
Era, Sharp Divides in Both Partisan Coalitions.
Chen, Z.; Li, Z.; and Liu, S. 2022. The price of political po-
larization: Evidence from municipal issuers during the coro-
navirus pandemic. Finance Research Letters, 102781.
DeSilver, D. 2022. The polarization in today’s Congress has
roots that go back decades.
Figure 7: Nearest neighbors for background data belong- Devlin, J.; Chang, M.-W.; Lee, K.; and Toutanova, K. 2018.
ing to Ayenna Presley (Democrat) Bert: Pre-training of deep bidirectional transformers for lan-
guage understanding. arXiv preprint arXiv:1810.04805.
Hamilton, W. L.; Leskovec, J.; and Jurafsky, D. 2016. Di-
The above graph in Figure 10 shows the neighbors for Mitch achronic word embeddings reveal statistical laws of seman-
McConnell (Republican) and it is very evident that majority tic change. arXiv preprint arXiv:1605.09096.
of the neighbors are Republican (red in color) whereas the Jiang, S.; Robertson, R. E.; and Wilson, C. 2020. Reasoning
Democrat count is only 2 out of 20. So one can infer that the about political bias in content moderation. In Proceedings of
polarization ratio is 0.9 for Mitch McConnell. Similarly, in the AAAI Conference on Artificial Intelligence, volume 34,
Figure 11, we can see that Ayenna Presley who is a Demo- 13669–13672.
crat has 16 neighbors belonging to the same party resulting
in a ratio of 0.8 for background data. Scaled-up versions of Khadilkar, K.; KhudaBukhsh, A. R.; and Mitchell, T. M.
such websites with more metrics that highlight the political 2022. Gender bias, social bias, and representation: 70 years
views of a member as radical or moderate will be beneficial of BHollywood. Patterns, 3(2): 100409.
to the voters. KhudaBukhsh, A. R.; Sarkar, R.; Kamlet, M. S.; and
Also, we show the worthiness of this data and hope that Mitchell, T. 2021. We Don’t Speak the Same Language: In-
this will be useful to the research community in examining terpreting Polarization through Machine Translation. In Pro-
the idea of political polarization in candidates and how it is ceedings of the AAAI Conference on Artificial Intelligence,
linked to other attributes of the candidate. Also, to under- volume 35, 14893–14901.KhudaBukhsh, A. R.; Sarkar, R.; Kamlet, M. S.; and Mitchell, T. M. 2022. Fringe news networks: dynamics of US news viewership following the 2020 presidential elec- tion. In 14th ACM Web Science Conference 2022, 269–278. Le, Q.; and Mikolov, T. 2014. Distributed representations of sentences and documents. In International conference on machine learning, 1188–1196. PMLR. Liu, Y.; Ott, M.; Goyal, N.; Du, J.; Joshi, M.; Chen, D.; Levy, O.; Lewis, M.; Zettlemoyer, L.; and Stoyanov, V. 2019. Roberta: A robustly optimized bert pretraining ap- proach. arXiv preprint arXiv:1907.11692. Mikolov, T.; Chen, K.; Corrado, G.; and Dean, J. 2013. Ef- ficient estimation of word representations in vector space. arXiv preprint arXiv:1301.3781. Palakodety, S.; KhudaBukhsh, A. R.; and Carbonell, J. G. 2020. Mining insights from large-scale corpora using fine- tuned language models. In ECAI 2020, 1890–1897. IOS Press. Petroni, F.; Rocktäschel, T.; Lewis, P.; Bakhtin, A.; Wu, Y.; Miller, A. H.; and Riedel, S. 2019. Language models as knowledge bases? arXiv preprint arXiv:1909.01066. Poole, K. T.; and Rosenthal, H. 1984. The polarization of American politics. The journal of politics, 46(4): 1061– 1079. Rajani, N. F.; McCann, B.; Xiong, C.; and Socher, R. 2019. Explain yourself! leveraging language models for common- sense reasoning. arXiv preprint arXiv:1906.02361. Vaswani, A.; Shazeer, N.; Parmar, N.; Uszkoreit, J.; Jones, L.; Gomez, A. N.; Kaiser, Ł.; and Polosukhin, I. 2017. At- tention is all you need. Advances in neural information pro- cessing systems, 30.
You can also read