UEFA Against the Champions? An Evaluation of the Recent Reform of the Champions League Qualification - Corvinus Research Archive
←
→
Page content transcription
If your browser does not render page correctly, please read the page content below
Original Research Article
                                                                            Journal of Sports Economics
                                                                                                    1-26
                                                                                  © The Author(s) 2022
UEFA Against the                                                                Article reuse guidelines:
                                                                       sagepub.com/journals-permissions
Champions? An Evaluation                                               DOI: 10.1177/15270025221074700
                                                                           journals.sagepub.com/home/jse
of the Recent Reform of
the Champions League
Qualification

László Csató1,2

Abstract
The paper evaluates the impact of the only reform in the Champions Path of UEFA
Champions League qualifying system, effective from the 2018/19 season. In contrast
to previous studies, our methodology considers five seasons instead of only one to
filter out any possible season-specific attributes. The chances of some national
champions decrease much stronger than suggested by the reduction in the number
of available slots. Since the negative effects depend to a large extent on the arbitrary
cutoffs in the access list, we propose to introduce some randomness into the deter-
mination of entry stages.

Keywords
football, simulation, sports rules, tournament design, UEFA Champions League
MSC class: 62F07, 68U20
JEL Classification Codes: C44, C63, Z20

1
    Institute for Computer Science and Control (SZTAKI), Eötvös Loránd Research Network (ELKH),
    Laboratory on Engineering and Management Intelligence, Research Group of Operations Research and
    Decision Systems, Budapest, Hungary
2
    Corvinus University of Budapest (BCE), Department of Operations Research and Actuarial Sciences,
    Budapest, Hungary

Corresponding Author:
Institute for Computer Science and Control (SZTAKI), Eötvös Loránd Research Network (ELKH),
Budapest, Hungary.
Email: laszlo.csato@sztaki.hu
2 Journal of Sports Economics 0(0)
“For unto every one that hath shall be given, and he shall have abundance: but from him
that hath not shall be taken away even that which he hath.”
(Matthew 25:29, King James version)
Introduction
Competitive balance is a major issue in team sports because it is commonly assumed
that a more balanced competition in a league and a higher uncertainty of outcome
ceteris paribus increases the interest of fans and sponsors (Szymanski, 2003).
Unsurprisingly, several academic papers have addressed various policies used to
improve competitive balance such as luxury taxes (Dietl et al., 2010; Marburger,
1997), promotion and relegation (Dietl et al., 2015), revenue sharing (Szymanski
& Késenne, 2004), or salary caps (Dietl et al., 2009; Késenne, 2000). On the other
hand, the tournament format has received much less attention in this respect, even
though it might influence the competitive balance of individual matches (Scarf
et al., 2009) and the organiser has a lot of freedom in choosing these rules.
The current study aims to uncover how the only significant reform in the UEFA
Champions League qualification process since 2009, effective from the 2018/19
season, has raised the barriers for upcoming competitors, in particular, for the cham-
pions of the lower-ranked UEFA member associations.
This international tournament, organised by the Union of European Football
Associations (UEFA), is the most prestigious annual club football competition in Europe.
While its predecessor, the European Champion Clubs’ Cup, was a standard knockout tour-
nament contested exclusively by the champions of national leagues in the previous year, the
rebranding of the competition in the 1992/93 season has added a round-robin group stage
and provided slots to more teams from the strongest national leagues. Consequently, now
most champions of the UEFA member associations should play in the Champions Path
of the qualification stage to reach the lucrative group stage of the Champions League.
The qualification is a knockout tournament currently consisting of five rounds, where
each team enters the stage determined by the rank of its national association.
Although the qualification matches attract less media attention than later clashes in
the group stage, and the teams considered here often only “make up the numbers” in
the Champions League, qualification for the Champions League generates consider-
able local interest as it remains a significant achievement for the majority of the
national champions in Europe. For example, Hungarian teams played only
three times out of the 30 Champions League seasons (Ferencváros in 1995/96 and
2020/21, and Debrecen in 2009/10). For these clubs, this means practically the
only opportunity to play against the leading European clubs.
In the following, we provide a statistical evaluation of the Champions League
qualification, which is the first in the academic literature. Since the actual real-world
results represent only some realisations of several random variables, the expected
qualifying probabilities are calculated through Monte-Carlo simulations. ComparedCsató 3
to similar research focusing on the Champions League, we are forced to use a simpler
approach because the qualification involves several teams from small UEFA associ-
ations, which play few matches outside their domestic league in a season.
Nonetheless, while some precaution is needed in interpreting the numerical results,
the qualitative implications of the reform will turn out to be robust.
The current work has also some methodological contributions. Previous simulations of
the UEFA Champions League (Scarf et al., 2009; Corona et al., 2019; Dagaev & Rudyak,
2019) have considered only one season. However, the set of participating clubs varies
from season to season, thus these results may have some limitations due to the possible
season-specific attributes. Therefore, we take into account the five recent seasons from
2017/18 to 2021/22 to reliably estimate the true effects of the reform. The five-year
span is picked as the UEFA club coefficient, underlying the seeding in UEFA club tourna-
ments, sums the points earned over the previous five seasons with equal weights.
Our paper has crucial messages for the organisers of sports competitions: (1) while the
number of qualifying slots is reduced by 20% (from five to four), the chances of some
national champions decrease by more than 50%, hence the effects of similar changes
can be strongly non-linear; (2) since the consequences of the reform depend to a large
extent on the somewhat arbitrary differences in the entry stages of the teams, it might
be worth smoothing them through a probabilistic mechanism like the NBA draft lottery.
The rest of the discussion is organized as follows. Section 2 gives a short overview
of connected papers. Section 3 argues that our paper can be relevant for sports eco-
nomics. The qualifying system of the Champions League is presented in Section 4,
and the simulation model is described in Section 5. Section 6 contains our findings,
and Section 7 summarises them.
Related Literature
The UEFA Champions League has been the subject of many academic works. According
to Page & Page (2007), playing the second leg at home in the knockout phase of European
cups, including the Champions League, means a significant—albeit somewhat declining
—advantage. This finding has been reinforced in Geenens & Cuddihy (2018) but has
been questioned recently by Amez et al. (2020). Eugster et al. (2011) conclude that the
observed difference can be attributed to the performance in the group stage and the
teams’ general strength. Engist et al. (2021) exploit the discontinuous nature of the
seeding system in the Champions League (and the UEFA Europa League) as a natural
experiment to estimate the causal effect of being seeded. Jost (2021) analyses the
effect of the away goals rule during extra time in the knockout rounds of the
Champions League on the competitive balance between teams.
Scarf et al. (2009) estimate various tournament metrics for several possible
designs of the Champions League. The procedure used by the UEFA for the
Round of 16 draw is found to result in strange probabilities for certain pairings
(Klößner & Becker, 2013). Therefore, Boczoń & Wilson (2018) aim to understand4 Journal of Sports Economics 0(0) and analyse the mechanism used for this draw with the tools of market design. While match outcomes in the lower rounds of the Champions League are less uncertain compared to its predecessor, the competitive balance has increased at the later stages (Schokkaert & Swinnen, 2016). Dagaev & Rudyak (2019) examine the com- petitiveness changes in the Champions League and Europa League implied by reforming the group stage seeding in the Champions League from the 2015/16 season. Corona et al. (2019) assess these two seeding regimes by taking into account the uncertainty of parameter estimates in a Bayesian framework. Csató (2020) investigates the effect of this seeding reform from a theoretical point of view. Guyon (2021a) proposes a new knockout format for the Champions League through the policy of “choose your opponent”. However, substantially less research has been devoted to studying the UEFA Champions League qualification. According to Green et al. (2015), an increase in the number of Champions League slots for a national league implies higher invest- ment in talent, especially among the clubs that just failed to qualify in the previous season. The prize money distributed by the UEFA for participation in the Champions League is found to threaten with a hegemony emerging in smaller European leagues (Menary, 2016). Finally, Csató (2019) studies the incentive com- patibility of the Champions League entry. Our paper is also strongly connected to the studies examining different real-world tournament designs due to its methodology. Besides the already mentioned papers focus- ing on the UEFA Champions League (Scarf et al., 2009; Corona et al., 2019; Dagaev & Rudyak, 2019; Goossens et al., 2012) evaluate four formats that have been considered by the Royal Belgian Football Association with respect to the importance of the games. Lasek & Gagolewski (2018) analyse the efficacy of the tournament formats used in the majority of European top-tier association football competitions, Csató (2021) com- pares the designs of recent World Men’s Handball Championships, while Csató (2020) challenges the paradigm of balanced groups in hybrid tournaments consisting of a round-robin group stage followed by the knockout phase. The Economic Relevance of the Proposed Methodology and the UEFA Champions League Qualification This section discusses how our methodology can be used to address various economic issues and why the Champions League qualification is important for European football. Potential Applications of Our Methodology Estimating the incidence of upsets. The unpredictable nature of football is a crucial reason why it is considered the beautiful game. For instance, on 29 September 2021, the Moldovan champion Sheriff Tiraspol has produced one of the greatest upsets in the history of the UEFA Champions League after defeating the multiple
Csató                                                                                5

winner Spanish Real Madrid in its own stadium, even though it has had only a 1.4%
chance of victory before the match (CNN, 2021). However, the occurrence of similar
events has a crucial premise: the underdog should qualify for the Champions League
to play against the best European teams. The suggested approach can contribute to
determining the probability of such clashes.

Quantifying long-term competitive balance. Ranking mobility in the European domestic
soccer leagues is found to significantly affect average stadium attendance per game
(Gyimesi, 2020). Therefore, dynamic long-term competitive balance is worth studying
for commercial reasons. However, in contrast to a single league, Champions League
participation is a “stochastic” variable in the sense that it depends on the outcome of
the qualification. Consequently, the effects of reforming the qualifying process cannot
be reliably uncovered by simply considering which teams played in the Champions
League. Decision-makers need to apply a method analogous to our suggestion in
order to understand the implications of changing the tournament format.

Designing an appropriate incentive scheme. With the launch of the UEFA Europa
Conference League—the third tier of European club football—in the 2021/22 season,
the club competitions organised by the UEFA are more integrated than ever. For
example, 10 losers from the Champions League play-off round qualify for the UEFA
Europa League group stage, whereas 10 teams eliminated in the Europa League play-
offs play in the Conference League group stage. Therefore, the organisers can only
assess via similar simulations what kind of probabilistic options are available for a
given team and associate a financial reward for them to optimise the chosen objective.

Balancing the effects of the COVID-19 pandemic. The qualification for the 2020/21
UEFA Champions League would originally have started in June 2020 but had
been delayed to August because of the COVID-19 pandemic. Therefore, each qual-
ifying round prior to the play-off round was played as a single-legged match hosted
by one of the teams decided randomly instead of the standard two-legged home-away
tie. The proposed simulation techniques can be used to reveal the financial conse-
quences of this restructuring and compensate the teams that were adversely affected
by this exogenous shock at the expense of the favoured clubs.

Evaluating reform plans. European football is one of the most successful and popular
sports around the world due to its continuous evolution. Currently, the Champions
League season starts with a round-robin group stage played in eight groups of four
clubs each. However, there will be a single league made up of all 36 competing
clubs from the 2024/25 season (Guyon, 2021b; UEFA, 2021b). Furthermore, the
French mathematician Julien Guyon—whose idea has already inspired UEFA to
modify the knockout bracket of the UEFA European Championship (Guyon,
2018)—has recently suggested the so-called “Choose You Opponent” format for
the Champions League, where the advancing teams could pick their opponents
6                                                         Journal of Sports Economics 0(0)

during much anticipated TV shows (Guyon, 2021a). Since any plan aimed at reform-
ing the Champions League should naturally deal with its qualification, similar pro-
posals can be compared and investigated by our methodology.

The Market Effects of Reforming the Champions League Qualification
The Champions League means a crucial source of revenue for teams coming from minor
leagues even if they have a low probability to win matches in the group stage. The qual-
ification of the Swedish champion Helsingborg in the 2000/01 season pushed its annual
revenue by 80% compared to the previous and subsequent years (Menary, 2016).
Analogously, even though the Hungarian champion Debrecen was eliminated from
the 2009/10 Champions League after losing all group games, this brought in 9
million Euros prize money, while the total revenue in 2011 was only 3.4 million
Euros (Menary, 2016).
    In the 2021/22 season, the clubs eliminated in the last round of the Champions
League qualification automatically go to the second-tier competition UEFA Europe
League with a starting fee of 3.63 million Euros (UEFA, 2021a). However, participation
in the Champions League group stage yields 15.64 million Euros. The performance
bonuses paid for each match are also remarkably higher in the Champions League
(2.8 million per win and 0.93 million per draw, respectively) than in the Europa
League (0.63 million per win and 0.21 million per draw, respectively) (UEFA, 2021a).
    Therefore, a conservative “back of the envelope” calculation shows that qualifica-
tion for the Champions League means more than 10 million Euros in additional
revenue. This amount is worth comparing to the total market value of the players
of the four teams eliminated in the last round of the 2021/22 Champions League qual-
ification: 24.00 million for Brøndby, 109.50 for Dynamo Zagreb, 36.25 for
Ferencváros, and 34.50 for Ludogorets Razgrad (all numbers were obtained from
https://www.transfermarkt.de on 7 September 2021). From another point of view,
each percentage point change in the probability of qualification for the Champions
League is equivalent to approximately 100 thousand Euros. Beyond these direct
financial effects, the decisions of the clubs can be affected in other ways by modify-
ing the qualifying probabilities: according to Green et al. (2015), changes in the
number of slots available for a national league in the Champions League leads to
changes in talent investment amongst those clubs most affected at the margin.
    Finally, although it is debated that competitive balance has recently worsened in
the UEFA Champions League (Schokkaert & Swinnen, 2016), the Bosman ruling has
led to increasing inequality among European football clubs according to several eco-
nomic models (Binder & Findlay, 2012; Milanovic, 2005). In particular, the ruling
has created a liquid market for star players with stiff bidding competition between
incumbent clubs, hence the reward for nursery clubs from selling star players is
found to exceed the reward from keeping them and challenging the more established
clubs (Norbäck et al., 2021). Our results support this argument: obviously, if UEFA
severely restricts the access of smaller European clubs to the Champions League,
Csató 7
they opt for selling their best players since challenging the leading teams becomes
riskier and less profitable in the short and medium run.
The Qualifying System of the Champions League
The slots in the UEFA Champions League are allocated based on the ranking of
UEFA member associations according to their UEFA coefficients, which are deter-
mined by the performances of the corresponding clubs during the previous five
seasons of the Champions League and the UEFA Europa League. Dagaev &
Rudyak (2019, Appendix A.1) provide the details of its calculation. Higher-ranked
associations are entitled to more places in the group stage and/or their teams have
to contest fewer qualification rounds, the only exception being that certain positions
are not distinguished in the access list. For example, the champions of the 14th and
15th associations alike enter the third qualifying round in the current system. The
access list for the 2021/22 UEFA Champions League can be found in UEFA
(2021c, Annex A).
Teams without a guaranteed slot in the Champions League participate in its qual-
ification tournament that is divided into two separate paths since the 2009/10 season:
the Champions Path for the champions of lower-ranked national associations, and the
League Path contested by the teams that did not win their higher-ranked domestic
leagues.1 The number of UEFA member associations competing in the Champions
League is fixed at 55 since the 2017/18 season when the champion of Kosovo joined.
There is another way to obtain a berth in the group stage. The English Premier
League received four places in the 2005/06 season, however, the winner of the
2004/05 Champions League, Liverpool, finished only fifth in the championship.
Therefore, UEFA made a one-off exception by allowing the team to defend its
title and amended the qualification criteria such that the Champions League title-
holder has a slot in the next season. Analogously, the winner of the UEFA Europa
League from the previous season entered the play-off round of the League Path in
the three seasons played between 2015 and 2018, while it directly qualifies for the
group stage of the Champions League since the 2018/19 season.
Both policies can create a vacant slot somewhere in the qualifying system if a
titleholder also qualifies from its domestic championship. Filling the vacancy is a
nontrivial task since it may lead to incentive incompatibility (Dagaev & Sonin,
2018), for instance, in the Champions League between 2015 and 2018 (Csató,
2019). For the sake of simplicity, the Champions League titleholder is assumed to
qualify for the group stage through its domestic championship in all our simulations.2
Because a vacancy created in the group stage by the Europa League titleholder is
filled via rebalancing the League Path, it is sufficient to assume that this team
is not the champion of a national association ranked 12th or lower, which seems
reasonable, too.8 Journal of Sports Economics 0(0)
The Champions League qualification is regulated in three-year cycles since 2012,
namely, the access list that allocates the slots available for a given rank among the
national associations is unchanged for three seasons (2012-15, 2015-18, 2018-21,
2022-24). On the other hand, the actual ranking is updated every year. For
example, the 11th association was the Netherlands in the 2020/21 and Turkey in
the 2021/22 season, thus Ajax and Beş iktaş directly entered the group stage in
these seasons, respectively.
Since 2009, the qualification has seen the only substantial reform between the
2015-18 and 2018-21 cycles. The impact of this change on the Champions Path,
that is, on the probability of qualification for the champions of lower-ranked
leagues, will be evaluated in the current paper.
Table 1 summarises the two variants to be compared via Monte-Carlo simulations:
the old (pre-2018, Table 1) and the new (post-2018, Table 1) regimes in the
Champions Path of the Champions League qualification.3
The preliminary round (PR), launched in the 2018/19 season, is played as two
one-legged semi-finals and a final hosted by one of the four competing clubs
drawn randomly. In the qualifying rounds Q1–Q3 and in the play-off round (PO),
the teams play two-legged home-and-away matches.
In all rounds, the clubs are separated into seeded and unseeded pots containing the
same number of teams based on their UEFA club coefficients at the beginning of the
season, which quantifies their performance in the last five seasons of the UEFA
Champions League and Europa League. Dagaev & Rudyak (2019, Appendix A.2)
Table 1. The UEFA Champions League qualification for the champions.
Qualifying Number Teams advancing from
round of teams Teams entering in this round the previous round
(a) 2017/18 season
First (Q1) 10 10 champions from associations —
46–55
Second (Q2) 34 29 champions from associations 5 winners from Q1
16–45 (except Liechtenstein)
Third (Q3) 20 3 champions from associations 13–15 17 winners from Q2
Play-off (PO) 10 — 10 winners from Q3
Group stage 17 12 champions from associations 1–12 5 winners from PO
(b) All seasons since 2018/19
Preliminary 4 4 champions from associations 52–55 —
(PR)
First (Q1) 32 31 champions from associations 1 winner from PR
20–51 (except Liechtenstein)
Second (Q2) 20 4 champions from associations 16–19 16 winners from Q1
Third (Q3) 12 2 champions from associations 14–15 10 winners from Q2
Play-off (PO) 8 2 champions from associations 12–13 6 winners from Q3
Group stage 15 11 champions from associations 1–11 4 winners from POCsató 9
details the computation of the UEFA club coefficient. A seeded team is always drawn
against an unseeded team.
Although the UEFA club coefficients of the teams are fixed during the whole qual-
ification, the winners of the previous round are usually not known at the time of the
draws, hence the club with the higher coefficient is assumed to advance. In other
words, if an unseeded team qualifies for the next round, it effectively carries over
the coefficient of its opponent to the next round but not further.
However, the play-off round of the pre-2018 system was drawn after the third
qualifying round had finished, thus the coefficients of the participating teams
could have been used directly. We have decided to disregard this minor difference
in the simulations because it is connected to the match calendar, not to the format
of the qualification.
As an illustration, consider the case of the Hungarian champion Ferencváros in the
2021/22 UEFA Champions League qualification. Since Hungary was the 33rd asso-
ciation, the club entered the first qualifying round (Q1). Its coefficient was 13.5.
Ferencváros managed to reach the play-off round as follows:
• Q1: it was seeded, and played against the unseeded Prishtina from Kosovo,
which qualified from the preliminary round (PR) with a coefficient of 2.25.
Ferencváros advanced to the second qualifying round (Q2).
• Q2: it was considered with a coefficient of 13.5, was seeded, and played
against Ž algiris Vilnius from Lithuania, which was considered with a coeffi-
cient of 6.5 as Ž algiris advanced against Linfield from Northern Ireland (coef-
ficient: 5.25) in Q1. Ferencváros advanced to the third qualifying round (Q3).
• Q3: it was considered with a coefficient of 13.5, was unseeded, and played
against Slavia Prague from the Czech Republic (coefficient: 43.5), which
entered Q3. Ferencváros advanced to the play-off round (PO).
• PO: it was considered with a coefficient of 43.5, was seeded, and played
against Young Boys from Switzerland (coefficient: 35), which entered Q2
and advanced against CFR Cluj from Romania (coefficient: 16.5) in Q3.
Ferencváros was eliminated.
Methodology
The aims of the study will be achieved by quantifying the probability of qualification
for the UEFA Champions League group stage via Monte-Carlo simulations. The two
qualifying systems are known from Section 4, thus they can be simulated repeatedly
once we have a prediction model for the outcome of the matches.
For this purpose, the strengths of the teams are estimated by the Football Club Elo
Ratings, available at http://clubelo.com/.4 The Elo rating is based on past results such
that the same outcome against a stronger opponent has more value and the influence
of a game decreases after new games are played (Van Eetvelde & Ley, 2019). While10 Journal of Sports Economics 0(0)
there exists no single nor any official Elo rating for football clubs, Elo-inspired
methods seem to outperform other measures with respect to forecasting power
(Lasek et al., 2013). They have also been widely used in the academic literature
(Hvattum & Arntzen, 2010; Lasek et al., 2016; Cea et al., 2020).
The Elo ratings of http://clubelo.com/ modify the standard Elo system by taking
home advantage and goal difference into account. Furthermore, in two-legged
matches, which are played in the Champions League qualification except for the pre-
liminary round (launched in the 2018/19 season), the clubs are not necessarily inter-
ested in winning one match and perhaps losing the other, but they focus primarily on
advancing to the next round. Hence the aggregated result over the two legs deter-
mines the total number of exchanged points, multiplied by the square root of 2 com-
pared to a single game. Until the 2020/21 season, the number of away goals scored
was the tie-breaking rule if the aggregated scores were level, thus advancing due to
away goals counts as a win by a half goal margin.
The underlying database contains all international matches played in the UEFA
Champions League, Europa League, and Conference League, as well as in their pre-
decessors (see http://clubelo.com/Data). Domestic league results are considered in the
higher-ranked associations written in bold in Table A.3, and the second division of
the five strongest associations (Spain, England, Italy, Germany, France) are also
included. Therefore, the ratings of teams from lower-ranked associations are calcu-
lated only from relatively few international matches and could be more uncertain.
However, the benefit from extending the dataset with many games involving clubs
whose Elo is pure speculation remains questionable. Furthermore, as we will see,
these teams have no reasonable chance to participate in the Champions League.
Consequently, changing the design of the qualification does not affect their odds sub-
stantially in absolute terms.
According to the methodology of the Club Elo rating (see http://clubelo.com/
System), the a priori probability that team i with an Elo of Ei advances against
team j with an Elo of Ej is given by
1
We = (1)
1 + 10−d/s
in the one-legged matches of the preliminary round PR, and by
1
We∗ = √ (2)
1 + 10− 2 d/s
in the two-legged home-and-away clashes of qualifying rounds Q1–Q3 and PO,
where d = Ei − Ej is the difference between the Elo ratings of the two teams, and
s is a scaling parameter. s = 400 is used in the calculation of Club Elo rating.
The ranking of the national associations fluctuates across seasons. Analogously,
the champion of an association has a different UEFA club coefficient and strength
in each year. While the Elo ratings are dynamic, the underlying strengths of theCsató 11
teams are assumed to remain static during the whole Champions League qualification
(played over approximately two months between the end of June and the end of
August) as the UEFA club coefficients are also fixed in a given season. In particular,
we have decided to use the Elo ratings from 1 September because it still reflects the
performance of the team during the qualification. Note that our main aim is to cor-
rectly forecast the effects of the reform, hence it is not necessary to use exclusively
ex-ante information for prediction.
The analysis is based on the last five seasons from 2017/18 to 2021/22. A simu-
lation run consists of the following steps:
1. A season is drawn randomly to determine the underlying ranking of the national
associations. The five possibilities are given in Table A.1 in the Appendix. For
example, if the season 2018/19 is drawn, then Austria is the 15th, hence its cham-
pion enters the third qualifying round (Q3) in both the pre-2018 and post-2018
regimes according to Table 1. Similarly, Poland is the 20th, thus its champion
enters the second qualifying round (Q2) in the pre-2018 format and the first
qualifying round (Q1) in the post-2018 format.
2. The characteristics of the champion of any UEFA member association is
drawn randomly from the five seasons. The UEFA club coefficients of the
champions are shown in Table S.2, while their Elo points are presented in
Table A.3 in the Appendix. The two measures are not drawn independently
for a particular association to preserve their coherence but they are drawn
independently for each country. For instance, if the attributes of both the
Austrian and the Polish champions are drawn from the season 2017/18,
then their UEFA club coefficients are 40.57 and 28.45, while their Elo
ratings are 1705 and 1483, respectively. Since the two draws are independent,
this scenario occurs with a probability of 1/25.
In order to better understand how the difference in the probabilities of quali-
fication depends on the initial rating of the teams, the simulation is carried out
such that the characteristics of the participating teams are imported from a
given season, too.5 However, in this case, the effects on the countries are not reli-
able due to the biases caused by the unexpected performance of a particular club.
For instance, it would be strongly misleading to represent the average English
champion by the 2015/16 winner Leicester City: the club was 5000-1 with book-
makers to win the league before the season started, thus it was the “most unlikely
triumph in the history of team sport” (BBC, 2016).
3. 43 clubs, the champions of the associations ranked 12–55 without
Liechtenstein, play in the qualification. Therefore, a 43 × 43 binary matrix
of match outcomes is generated randomly for all possible pairs of clubs
based on the formula (2). This matrix is plugged into both qualifying
systems to record the set of the six and four qualified teams, respectively.6
The champions of the associations ranked not lower than the 11th are
added to the set of qualified teams.12 Journal of Sports Economics 0(0) While the implementation of the last point contains no novelty, the first two parts have some value added to the modelling technique: both Corona et al. (2019) and Dagaev & Rudyak (2019) simulate only one particular season, although the authors of the former work have repeated the exercise for another season without reporting the results in the paper. The simulations have been carried out for various number of independent runs. Figure 1 shows the average Elo rating of the teams qualified for the group stage of the Champions League as the function of the number of iterations. Therefore, every sim- ulation has been run one million (106 ) times when both measures have already stabilised. Results Now we turn to evaluate the effects of changing the qualifying system of the Champions League in 2018 on the UEFA member associations. Figure 2 highlights the impact on the probability of reaching the group stage.7 The novel design seems to be detrimental to all national associations. The biggest loser is Switzerland as it has been ranked 12th in three seasons: this association should give up its guaranteed place in the Champions League group stage due to the reform. Bulgaria and Scotland considerably suffer from the new regime, too, because their cham- pions are usually relatively strong in the qualification, and they should often play one more round now. However, the effect on the Czech Republic is almost neutral since it was the 13th in three seasons, and the reform favours this champion by decreasing the Figure 1. The dependence of the average Elo rating of the teams that qualified for the UEFA Champions League on the number of iterations.
Csató                                                                                 13

Figure 2. The difference in the probabilities of qualification (under the new system minus
under the old system) for the UEFA Champions League group stage—Unweighted seasons.

number of rounds to be played from two to one (see Table 1). The reduction in the prob-
ability of qualification is over 10 percentage points—exceeding 1 million Euros in
expected prize money—for eight national associations.
14                                                         Journal of Sports Economics 0(0)

Figure 3. The probabilities of qualification for the UEFA Champions League group stage

    In relative terms, the loss in the probability of qualification remains below 25% only
for four strong associations in the sample, although a naïve guess on the basis of
Table 1 would suggest a reduction of 20% as the number of available berths is
reduced from five to four. Clearly, the reallocation of the entry positions has a substan-
tial effect and the odds of several associations are more than halved. For example, the
Csató 15 Figure 4. The difference in the probabilities of qualification (under the new system minus under the old system) for the UEFA Champions League group stage—Weighted seasons Hungarian champion has about a 7.54% chance to qualify for the Champions League according to the old format, but it is only 3.69% in the current design. Whereas increas- ing the number of participants from the best national associations in the group stage
16 Journal of Sports Economics 0(0)
will perhaps raise the overall revenue and, consequently, the prize money available in
the Champions League in the long run, it is unlikely that this will balance such a dra-
matic reduction in the probability of qualification.
Figure 3 shows the probability of qualification under both systems as the function
of the average Elo rating of the champions. There is a clear positive trend but some
outliers can be identified. For instance, the Austrian and the Dutch clubs have almost
equal average Elo ratings and probability of qualification under the old regime.
However, the chance of the former club to enter the Champions League group
stage is lower by more than 10 percentage points in the current system, caused by
the less favourable positions of Austria in the access list.
The future effects of the reform primarily depend on the ranking of the associations.
Therefore, it might be misleading to assume that the last five seasons are accurate predic-
tors because there are some remarkable trends even during this short period. According to
Table A.2, the national league in Denmark has become stronger (at least, according to the
measure of the UEFA), while the level of the Swiss championship has declined.
Consequently, it is worth studying what happens if the access lists are weighted
towards the present. We have chosen the weights 10%, 15%, 20%, 25%, and 30% for
the seasons from 2017/18 to 2021/22. For instance, the Dutch champion has to play
in the qualification with a probability of 35% instead of the unweighted 40% as this
country was ranked lower than the 11th in the 2018/19 and 2019/20 seasons.
These calculations are reported in Figure 4. The pattern mainly follows the
unweighted case, however, the loss of Switzerland is decreased by 3.5 percentage
points. The reason is that the country was ranked the 12th in the first three seasons,
and the new system forces its champion to play in the play-off round (PO) instead of
providing a slot in the group stage. The weighting favours the Danish club, its probability
of qualification increases from 20.4% to 22.8% under the new policy, while the Swiss
champion is found to be in a worse position (52.1% vs. 49.3%). With this assumption,
seven associations (Austria, Bulgaria, Croatia, Cyprus, Greece, Scotland, Serbia) plus the
already mentioned Switzerland lose more than 1 million Euros in expected prize money.
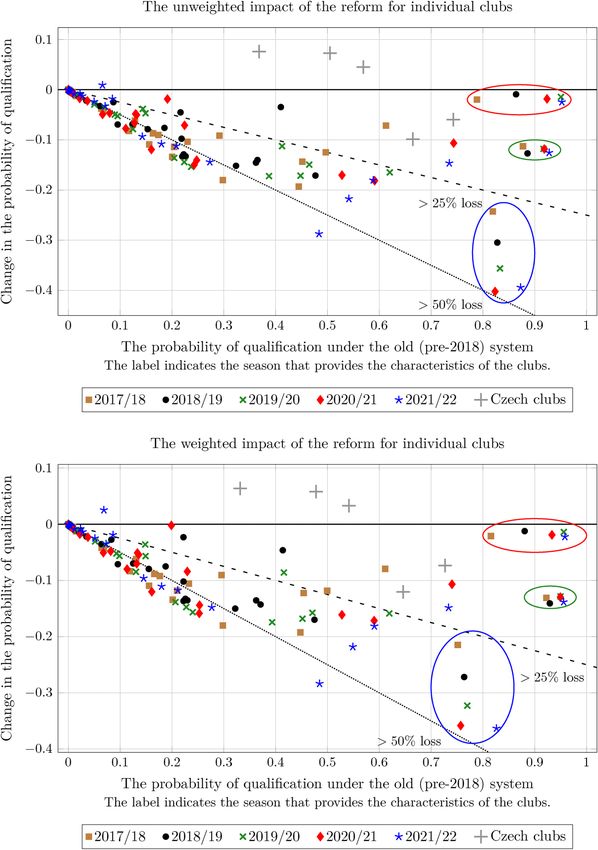
Finally, Figure 5 considers the characteristics of the teams from the five seasons
separately, that is, they are not drawn randomly but provided by a given season
(while the positions of the associations are allowed to vary). The arrangements are
similar across the seasons both in the unweighted and weighted scenarios, thus the
effects are driven by the tournament design itself, not by the initial ratings of the
teams. In particular, they are determined mainly by the association of the champion
as the three ellipses—containing the Dutch (at the top of the chart; red in the coloured
online version), Austrian (at the middle of the chart; green in the coloured online
version), and Swiss (at the bottom of the chart; blue in the coloured online
version) clubs, respectively—show. Furthermore, the reform favours a champion
only in four cases, and three of them affect the champion of the Czech Republic,
which reinforces the findings of Figures 2 and 4. The only exception is Brøndby,
the representative of Denmark in the 2021/22 qualification, hence it comes from
another country that remains relatively unaffected by the rule change. To conclude,Csató 17 Figure 5. The difference in the probability of qualification (under the new system minus under the old system) for the UEFA Champions League group stage—Separate seasons the reform of the Champions League qualifying system hits the member associations quite differently but it can be beneficial for at most one lower-ranked association, the Czech Republic.
18                                                             Journal of Sports Economics 0(0)

Conclusions
We have studied how the new qualifying system of the UEFA Champions League, intro-
duced in the 2018/19 season, has changed the probability of participation in the group
stage for the champions of the 44 lowest-ranked UEFA associations. According to our
simulations, the winners of several leagues have lost more than one million Euros in
expected prize money but the negative effects are unevenly distributed and strongly
depend on the association of the clubs. The results are robust with respect to the weight-
ing of the underlying data toward the recent seasons.
   The methodological novelty of the paper resides in its multi-season perspective:
the true impact of a rule change can be identified only if the characteristics (strength,
UEFA club coefficients, etc.) of the contestants are good proxies to the expected
values. While the solution proposed to address this problem is straightforward, we
hope it can become a standard approach of similar investigations based on
Monte-Carlo simulations.
   It is important to recognise that the distribution of the effects caused by the reform
largely depends on the somewhat arbitrary but sharp differences between some posi-
tions of the access list. Perhaps UEFA can use a more random procedure to decide
whether a particular champion has to play one, two, or three qualifying rounds.
For instance, instead of fixing that the club from the 13th association enters the
play-off in the qualification and the club from the 14th association enters the third
qualifying round, the right of playing one round less can be drawn randomly accord-
ing to 60%–40%, or 70%–30% between these two teams. Such a mechanism would
flatten the odds, which would be fairer in our opinion.
   UEFA has undeniably raised the barriers to participation in the Champions
League for most European champions since the 2018/19 season. Consequently, the
Champions League has become rather a playground of leading European associa-
tions, and has moved farther from its original concept of being a “league of champi-
ons”. While the goal of the amendments has been probably commercial or political,
the findings presented above yield important insight into the possible effects of
changing the qualifying system. Our contribution can be valuable for all stakehold-
ers, especially as UEFA plans to make the Champions League even more distorted
for the elite clubs (Guyon, 2021b; Panja, 2019; UEFA, 2021b).

Declaration of Conflicting Interests
The author declared no potential conflicts of interest with respect to the research, authorship,
and/or publication of this article.

Funding
The author disclosed receipt of the following financial support for the research of this article:
Magyar Tudományos Akadémia (Premium Postdoctoral Research Program).
Csató                                                                                          19

ORCID iD
László Csató      https://orcid.org/0000-0001-8705-5036

Notes
1. Before this separation, a champion may meet with a strong team coming from a leading
   association. For instance, FC Barcelona (the third team in Spain) played against Wisła
   Kraków (the champion in Poland) in the third qualifying round of the 2008/09 season.
2. There were two exceptions after the case of Liverpool in 2005: AC Milan would have qual-
   ified only for the third qualifying round of the 2007/08 Champions League as being the
   fourth team in Italy, while Chelsea failed to qualify for the 2012/13 Champions League
   as being the sixth team in the 2011/12 Premier League.
3. The 2019/20 Champions League titleholder, Bayern Munich, qualified for the 2020/21
   Champions League group stage via its domestic league. However, due to schedule delays in
   both the 2019/20 and 2020/21 seasons caused by the COVID-19 pandemic, the 2020/21
   season started before the conclusion of the 2019/20 season. Hence the access list modifications
   could not be certain until the earlier qualifying rounds had been played and/or their draws had
   been made. UEFA used “adaptive re-balancing” to change the access list once the berths for the
   Champions League and Europa League titleholders were determined such that the competition
   rounds of the qualifying phase that have already been drawn or played at the moment the title-
   holders are determined will not be impacted (UEFA, 2020, Article 3.04). Therefore, 33 cham-
   pions from associations 18–51 (except Liechtenstein) entered the first qualifying round (Q1),
   3 champions from associations 15–17 entered the second qualifying round (Q2), and 3
   champions from associations 12–14 entered the play-off round (PO). Thus the schedule
   delay favoured association 14 (Greece) at the expense of associations 15 (Croatia), 18
   (Cyprus), and 19 (Serbia) compared to Table 1.
4. There is a parallel project at http://elofootball.com/, which also measures the strength of
   European clubs by the Elo method. However, its methodology remains more opaque,
   and historical data cannot be obtained straightforwardly.
5. We thank an anonymous reviewer for this suggestion.
6. The reform in 2018 introduced the preliminary round, where the probability of advancing
   should be computed according to formula (1).
7. In the bottom panel of Figure 2, the associations are labelled by their entry position in the
   2021/22 Champions League qualification. Note that the champion of the Netherlands, Ajax,
   has entered the group stage in 2021/22. However, the effect of the reform on this country is
   not zero (and the probability of qualification under the old system is less than one) because
   the Netherlands was ranked 13th in 2018/19 and 14th in 2019/20, thus there is a 40%
   chance that the Dutch club should play qualification matches in our simulations.

References
Amez, S., Baert, S., Neyt, B., & Vandemaele, M (2020). No Evidence for Second Leg Home
  Advantage in Recent Seasons of European Soccer Cups. Applied Economics Letters, 27(2),
  156–160.
BBC. (2016, May 2). Leicester City win Premier League title after Tottenham draw at Chelsea.
  https://www.bbc.com/sport/football/35988673.
20                                                               Journal of Sports Economics 0(0)

Binder, J. J., & Findlay, M. (2012). The Effects of the Bosman Ruling on National and Club
   Teams in Europe. Journal of Sports Economics, 13(2), 107–129.
Boczoń , M., & Wilson, A. J. (2018). Goals, constraints, and public assignment: A field study
   of the UEFA Champions League. Technical Report 18/016, University of Pittsburgh,
   Kenneth P. Dietrich School of Arts and Sciences, Department of Economics. https://
   www.econ.pitt.edu/sites/default/files/working_papers/Working%20Paper.18.16.pdf.
Cea, S., Durán, G., Guajardo, M., Sauré, D., Siebert, J., & Zamorano, G. (2020). An Analytics
   Approach to the FIFA Ranking Procedure and the World Cup Final Draw. Annals of
   Operations Research, 286(12), 119–146.
CNN. (2021). ‘A miracle’: Sheriff Tiraspol stuns Real Madrid in one of the Champions
   League’s greatest upsets. 29 September. https://edition.cnn.com/2021/09/29/football/
   sheriff-tiraspol-stuns-real-madrid-champions-league-spt-intl/index.html.
Corona, F., Forrest, D., Tena, J. D., & Wiper, M. (2019). Bayesian Forecasting of UEFA
   Champions League Under Alternative Seeding Regimes. International Journal of
   Forecasting, 35(2), 722–732.
Csató, L. (2019). UEFA Champions League Entry Has Not Satisfied Strategyproofness in
   Three Seasons. Journal of Sports Economics, 20(7), 975–981.
Csató, L. (2020). Optimal Tournament Design: Lessons From the Men’s Handball Champions
   League. Journal of Sports Economics, 21(8), 848–868.
Csató, L. (2021). A Simulation Comparison of Tournament Designs for the World Men’s Handball
   Championships. International Transactions in Operational Research, 28(5), 2377–2401.
Dagaev, D., & Rudyak, V. (2019). Seeding the UEFA Champions League Participants:
   Evaluation of the Reform. Journal of Quantitative Analysis in Sports, 15(2), 129–140.
Dagaev, D., & Sonin, K. (2018). Winning by Losing: Incentive Incompatibility in Multiple
   Qualifiers. Journal of Sports Economics, 19(8), 1122–1146.
Dietl, H., Grossmann, M., Hefti, A., & Lang, M. (2015). Spillovers in Sports Leagues with
   Promotion and Relegation. Scottish Journal of Political Economy, 62(1), 59–74.
Dietl, H. M., Lang, M., & Rathke, A. (2009). The Effect of Salary Caps in Professional Team Sports
   on Social Welfare. The B.E. Journal of Economic Analysis & Policy, 9(1), 17.
Dietl, H. M., Lang, M., & Werner, S. (2010). The Effect of Luxury Taxes on Competitive
   Balance, Club Profits, and Social Welfare in Sports Leagues. International Journal of
   Sport Finance, 5(1), 41–51.
Engist, O., Merkus, E., & Schafmeister, F. (2021). The Effect of Seeding on Tournament
   Outcomes: Evidence From a Regression-discontinuity Design. Journal of Sports
   Economics, 22(1), 115–136.
Eugster, M. J. A., Gertheiss, J., & Kaiser, S. (2011). Having the Second Leg At Home –
   Advantage in the UEFA Champions League Knockout Phase?. Journal of Quantitative
   Analysis in Sports, 7(1), 6.
Geenens, G., & Cuddihy, T. (2018). Non-parametric Evidence of Second-leg Home Advantage
   in European Football. Journal of the Royal Statistical Society: Series A (Statistics in
   Society), 181(4), 1009–1031.
Goossens, D. R., Beliën, J., & Spieksma, F. C. R. (2012). Comparing League Formats with Respect
   to Match Importance in Belgian Football. Annals of Operations Research, 194(1), 223–240.
Csató                                                                                     21

Green, C., Lozano, F., & Simmons, R. (2015). Rank-order Tournaments, Probability of
   Winning and Investing in Talent: Evidence From Champions’ League Qualifying Rules.
   National Institute Economic Review, 232(1), R30–R40.
Guyon, J. (2018). What a Fairer 24 Team UEFA Euro Could Look Like. Journal of Sports
   Analytics, 4(4), 297–317.
Guyon, J. (2021a). “Choose Your Opponent”: A New Knockout Design for Hybrid
   Tournaments. Journal of Sports Analytics, in press. https://doi.org/10.3233/JSA-200527.
Guyon, J. (2021b, February 13). Réforme de la Ligue des champions : avantages et
   inconvénients du ≪ championnat incomplet ≫. Le Monde. https://www.lemonde.fr/
   sport/article/2021/02/13/reforme-de-la-ligue-des-champions-avantages-et-inconvenients-
   du-championnat-incomplet˙6069847˙3242.html.
Gyimesi, A. (2020). League Ranking Mobility Affects Attendance: Evidence From European
   Soccer Leagues. Journal of Sports Economics, 21(8), 808–828.
Hvattum, L. M., & Arntzen, H. (2010). Using ELO Ratings for Match Result Prediction in
   Association Football. International Journal of Forecasting, 26(3), 460–470.
Jost, P.-J, (2021). Competitive Balance and the Away Goals Rule During Extra Time. Journal
   of Sports Economics, 22(7), 823–863.
Késenne, S. (2000). Revenue Sharing and Competitive Balance in Professional Team Sports.
   Journal of Sports Economics, 1(1), 56–65.
Klößner, S., & Becker, M. (2013). Odd Odds: The UEFA Champions League Round of 16
   Draw. Journal of Quantitative Analysis in Sports, 9(3), 249–270.
Lasek, J., & Gagolewski, M. (2018). The Efficacy of League Formats in Ranking Teams.
   Statistical Modelling, 18(5-6), 411–435.
Lasek, J., Szlávik, Z., & Bhulai, S. (2013). The Predictive Power of Ranking Systems in
   Association Football. International Journal of Applied Pattern Recognition, 1(1), 27–46.
Lasek, J., Szlávik, Z., Gagolewski, M., & Bhulai, S. (2016). How to Improve a Team’s Position
   in the FIFA Ranking? A Simulation Study. Journal of Applied Statistics, 43(7), 1349–1368.
Marburger, D. R. (1997). Gate Revenue Sharing and Luxury Taxes in Professional Sports.
   Contemporary Economic Policy, 15(2), 114–123.
Menary, S. (2016). One Rule for One: the Impact of Champions League Prize Money and Financial
   Fair Play At the Bottom of the European Club Game. Soccer & Society, 17(5), 666–679.
Milanovic, B. (2005). Globalization and Goals: Does Soccer Show the Way?. Review of
   International Political Economy, 12(5), 829–850.
Norbäck, P.-J., Olsson, M., & Persson, L. (2021). Talent Development and Labour Market
   Integration in European Football. The World Economy, 44(2), 367–408.
Page, L., & Page, K. (2007). The Second Leg Home Advantage: Evidence From European
   Football Cup Competitions. Journal of Sports Sciences, 25(14), 1547–1556.
Panja, T. (2019, May 9). Proposal to Restructure Champions League Leaves Out Most of
   Europe. The New York Times. https://www.nytimes.com/2019/05/09/sports/champions-
   league-europe-restructuring.html.
Scarf, P., Yusof, M. M., & Bilbao, M. (2009). A Numerical Study of Designs for Sporting
   Contests. European Journal of Operational Research, 198(1), 190–198.
22                                                           Journal of Sports Economics 0(0)

Schokkaert, J., & Swinnen, J. (2016). Uncertainty of Outcome is Higher in the Champions
   League Than in the European Cup. Journal of Sports Economics, 17(2), 115–147.
Szymanski, S, (2003). The Economic Design of Sporting Contests. Journal of Economic
   Literature, 41(4), 1137–1187.
Szymanski, S., & Késenne, S. (2004). Competitive Balance and Gate Revenue Sharing in
   Team Sports. The Journal of Industrial Economics, 52(1), 165–177.
UEFA. (2020). Regulations of the UEFA Champions League 2018-21 Cycle. 2020/21 Season.
   http://web.archive.org/web/20210603140626/https://documents.uefa.com/r/Regulations-
   of-the-UEFA-Champions-League-2020/21-Online.
UEFA. (2021a). Distribution to clubs from the 2021/22 UEFA Champions League, UEFA
   Europa League and UEFA Europa Conference League and the 2021 UEFA Super Cup.
   https://editorial.uefa.com/resources/0269-125fde34ba54-30a4c9aeea13-1000/20210520˙
   circular˙2021˙35˙en.pdf.
UEFA. (2021b, May 25). New format for Champions League post-2024: everything you need to
   know. https://www.uefa.com/uefachampionsleague/news/0268-12157d69ce2d-9f011c70f6fa-
   1000–new-format-for-champions-league-post-2024-everything-you-need-t/.
UEFA. (2021c). Regulations of the 2021/22 UEFA Champions League. https://web.archive.org/
   web/20210714180923/https://documents.uefa.com/r/Regulations-of-the-UEFA-Champions-
   League-2021/22-Online.
Van Eetvelde, H., & Ley, C. (2019). Ranking methods in soccer. In Kenett, R. S., Longford,
   T. N., Piegorsch, W., & Ruggeri, F., (Eds.), Wiley StatsRef: Statistics Reference Online
   (pp. 1–9). Springer.

Author Biography
László Csató obtained his Bachelor and Master degrees, as well as his PhD, degree in econom-
ics from Corvinus University of Budapest, Hungary. He is a research fellow at the Research
Group of Operations Research and Decision Systems, Laboratory on Engineering and
Management Intelligence, Institute for Computer Science and Control (SZTAKI), Budapest,
Hungary, and an associate professor at the Department of Operations Research and
Actuarial Sciences, Corvinus University of Budapest, Hungary. His research interests
include decision theory, operations research in sports, pairwise comparison matrices, prefer-
ence modelling, and social choice theory.

Appendix
Table A1. The UEFA Access List of the National Associations in the Last Five Seasons.

Association                  2017/18       2018/19       2019/20       2020/21      2021/22

Netherlands                     10            13            14           11            10
Austria                         16            15            11           12            12
Denmark                         24            18            17           16            13
Scotland                        25            23            26           20            14

                                                                                  (continued)
Csató 23 Table A1. (continued) Association 2017/18 2018/19 2019/20 2020/21 2021/22 Czech Republic 13 11 13 13 15 Cyprus 19 24 19 18 16 Switzerland 12 12 12 17 17 Greece 14 14 15 14 18 Serbia 27 28 25 19 19 Croatia 17 16 16 15 20 Sweden 21 21 22 22 21 Norway 22 25 29 23 22 Israel 23 22 18 27 23 Kazakhstan 28 29 28 24 24 Belarus 20 19 27 21 25 Azerbaijan 26 26 23 26 26 Bulgaria 29 27 24 28 27 Romania 15 17 20 29 28 Poland 18 20 21 25 29 Slovakia 31 31 32 30 30 Liechtenstein 32 32 31 32 31 Slovenia 30 30 30 31 32 Hungary 33 33 36 33 33 Luxembourg 43 46 48 43 34 Lithuania 45 48 43 41 35 Armenia 48 45 46 44 36 Latvia 42 41 41 42 37 Albania 39 37 34 36 38 North Macedonia 40 42 37 34 39 Bosnia and Herzegovina 38 39 40 40 40 Moldova 34 34 33 35 41 Republic of Ireland 41 38 39 37 42 Finland 37 36 38 38 43 Georgia 36 40 45 47 44 Malta 50 49 47 45 45 Iceland 35 35 35 39 46 Wales 51 50 50 48 47 Northern Ireland 46 47 49 52 48 Gibraltar 52 52 52 51 49 Montenegro 44 44 44 49 50 Estonia 47 43 42 46 51 Kosovo 55 55 55 53 52 Faroe Islands 49 51 51 50 53 Andorra 53 53 53 54 54 San Marino 54 54 54 55 55 The numbers show the rank of the national association in the corresponding UEFA access list. Liechtenstein does not organise a domestic league.
24                                                       Journal of Sports Economics 0(0)

Table A2. The UEFA Club Coefficients of the Champions in the Last Five Seasons.

Association                2017/18      2018/19     2019/20       2020/21        2021/22

Netherlands                 23.212         36         70.5          69.5           82.5
Austria                      40.57        55.5        54.5          53.5            59
Denmark                       37.8        11.5         31           14.5            7
Scotland                    42.785         31          31            34           31.25
Czech Republic               8.135         33         21.5          27.5           43.5
Cyprus                       26.21         27         25.5          5.35           5.55
Switzerland                 74.415        20.5        27.5          25.5            35
Greece                       64.58         10         23.5           43             43
Serbia                      16.075       10.75        16.75        22.75           32.5
Croatia                      15.55        17.5        29.5          33.5           44.5
Sweden                      16.945         14          5.5          4.55           18.5
Norway                      12.665          9         11.5           15            4.2
Israel                      10.875         10          16           16.5          4.875
Kazakhstan                    16.8       21.75        27.5           29             6
Belarus                     29.475        20.5        27.5         3.775           5.25
Azerbaijan                   18.05        20.5         22            21             5
Bulgaria                    34.175         37          27            26             28
Romania                       5.87        4.09         3.5          12.5           16.5
Poland                       28.45        24.5        3.85           17            16.5
Slovakia                      5.85         3.5          6            7             7.5
Liechtenstein                  —           —           —             —              —
Slovenia                    21.125         2.9        18.5          2.6             3
Hungary                       2.9         4.25         3.5           9             13.5
Luxembourg                   4.975         3.5        6.25          4.75           5.25
Lithuania                    5.825          2         4.25          6.75           6.5
Armenia                      2.525         2.5        1.05          2.5            6.5
Latvia                       1.975        1.75        1.125         3.5            5.5
Albania                      4.575        4.25          3          1.475           2.75
North Macedonia              5.125         3.5          6          1.475            9
Bosnia and Herzegovina        4.05        3.75        4.25          4.75           1.6
Moldova                      11.15       14.75        12.25        12.75           14.5
Republic of Ireland          5.815        1.75          7           8.5            4.75
Finland                       2.03          8           9           2.5            5.5
Georgia                      1.525          1         0.95          4.75           6.5
Malta                         2.8         3.25        4.25          1.15           3.75
Iceland                      6.175        1.65        2.75          2.5            4.25
Wales                        5.775          5           6           3.25           4.75
Northern Ireland              3.65          3         2.25          4.25           5.25
Gibraltar                     1.5         2.75        4.25          2.75           5.75
Montenegro                    3.3          2.5          3           4.25            6
Estonia                       1.3         1.25         3.5           4             6.25
Kosovo                         0            0          0.5          1.5            2.25
Faroe Islands                 2.95          3          1.5          2.75           2.25

                                                                              (continued)
Csató 25
Table A2. (continued)
Association 2017/18 2018/19 2019/20 2020/21 2021/22
Andorra 2.733 2.75 4 0.566 1.5
San Marino 1.566 1.75 0.75 1.5 1
Liechtenstein does not organise a domestic league.
Table A3. The Strengths of the Champions in the Last Five Seasons.
Association 2017/18 2018/19 2019/20 2020/21 2021/22
Netherlands 1619 1677 1843 1770 1818
Austria 1705 1715 1775 1764 1769
Denmark 1592 1535 1583 1578 1507
Scotland 1612 1550 1600 1623 1660
Czech Republic 1540 1585 1653 1649 1664
Cyprus 1609 1606 1607 1484 1447
Switzerland 1635 1651 1670 1666 1687
Greece 1661 1627 1642 1730 1702
Serbia 1519 1500 1545 1548 1592
Croatia 1592 1572 1682 1653 1635
Sweden 1489 1517 1494 1455 1582
Norway 1528 1542 1505 1531 1521
Israel 1561 1479 1499 1529 1493
Kazakhstan 1430 1489 1509 1446 1311
Belarus 1449 1497 1490 1363 1336
Azerbaijan 1513 1499 1475 1460 1285
Bulgaria 1523 1536 1514 1521 1530
Romania 1427 1470 1557 1600 1529
Poland 1483 1395 1385 1412 1505
Slovakia 1345 1411 1371 1374 1381
Liechtenstein — — — — —
Slovenia 1441 1373 1387 1323 1299
Hungary 1310 1436 1468 1533 1532
Luxembourg 1102 1260 1261 1163 1113
Lithuania 1185 1272 1291 1275 1184
Armenia 995 1054 1134 1118 1186
Latvia 1114 1131 1209 1203 1213
Albania 1272 1243 1148 1219 1183
North Macedonia 1340 1326 1230 1160 1185
Bosnia and Herzegovina 1190 1190 1264 1275 1195
Moldova 1318 1334 1299 1307 1426
Republic of Ireland 1273 1199 1223 1211 1174
(continued)You can also read


