Twenty seconds of visual behaviour on social media gives insight into personality
←
→
Page content transcription
If your browser does not render page correctly, please read the page content below
www.nature.com/scientificreports
OPEN Twenty seconds of visual behaviour
on social media gives insight
into personality
Callum Woods1*, Zhiyuan Luo2, Dawn Watling1 & Szonya Durant1
Eye tracking allows the researcher to capture individual differences in the expression of visual
exploration behaviour, which in certain contexts has been found to reflect aspects of the user’s
preferences and personality. In a novel approach, we recorded the eye movements of 180 participants
whilst they browsed their Facebook News Feed and employed a machine learning approach to
predict each of the self-reported Big Five personality traits from this viewing behaviour. We identify
that specific visual behaviours are informative of an individual’s personality trait information, and
can be used to psychologically profile social networking site users significantly better than chance
after collecting only 20 seconds of viewing behaviour. We discuss potential applications for user
engagement during human–computer interactions, and highlight potential privacy concerns.
Tailoring content to appeal to the user’s personality can promote consumer loyalty and engagement1. Similarly,
appealing to the user’s personality can lead to increased conversion rates during online marketing campaigns,
with personality-congruent personalised advertisements leading to up to 50% more purchases compared to non-
personalised or personality-incongruent advertisements2. As such, the ability to quickly predict the personality
of the user is of value to providers who wish to maximise the potential for users to engage with, and relate to, a
wide range of services and content.
Online social networking sites (SNS) provide content that is socially and emotionally relevant to the user
and enables users to connect, share content and interact with others as part of a personally tailored experience.
Machine learning techniques have been successfully applied to records of SNS behaviour to predict aspects of
the user’s private traits and attributes, such as their age, gender, political inclination and p ersonality3. A recent
meta-analysis identified that the self-reported ’Big Five’ personality traits (Openness, Conscientiousness, Extro-
version, Agreeableness and Neuroticism)4 were the most commonly predicted individual characteristics from
online digital traces, and that the Facebook platform was the most common SNS investigated5. The meta analysis
also found a moderate meta-correlation (0.34) between various digital traces and the Big Five personality scores
across 29 independent data sets, illustrating that an individual’s personality is reflected in their online behaviour
on Facebook5. However, currently existing methods of predicting a user’s personality from SNS engagement
require access to the user’s detailed personal content and previous behaviour, often across months or years of
use. Due to the volume of data provided by eye tracking, a possible advantage of predicting a user’s personality
from their oculomotor behaviour is that accurate predictions may not require past knowledge of SNS behaviour,
providing a stand-alone method to evaluate aspects of the user’s personal attributes from a single interaction.
Visual behaviour may provide insight into aspects of an individual’s personality because, as a reflection of
the spatial distribution of attention, it is driven in part by our endogenous associations (i.e., is shaped by our
previous experiences) with features of the visual s cene6. We tend to look longer at visual stimuli which we
find emotionally salient compared to those that we do not7,8, and eye movements are influenced by individual
attributes such as aspects of our p ersonality9 and our cognitive b iases10. Furthermore, Bargary and colleagues
found, within a sample of 1000 young adults, that an individual’s eye movements during a variety of oculomotor
tasks (e.g., following a moving object) provide a distinct and reliable ‘oculomotor signature’ that is stable across
time11. Subsequent literature builds upon this by identifying that personality traits can be decoded from visual
behaviour within both real-world locomotion12 and screen-based tasks (viewing a series of static images)13. As
such, these findings suggest that our visual behaviour provides a signal that reflects a range of our underlying
individual traits. However, the results across this literature vary from near perfect prediction of whether someone
1
Psychology Department, Royal Holloway University of London, Egham, TW20 0EX, UK. 2Computer Science
Department, Royal Holloway University of London, Egham, TW20 0EX, UK. *email: callum.woods.2014@
live.rhul.ac.uk
Scientific Reports | (2022) 12:1178 | https://doi.org/10.1038/s41598-022-05095-0 1
Vol.:(0123456789)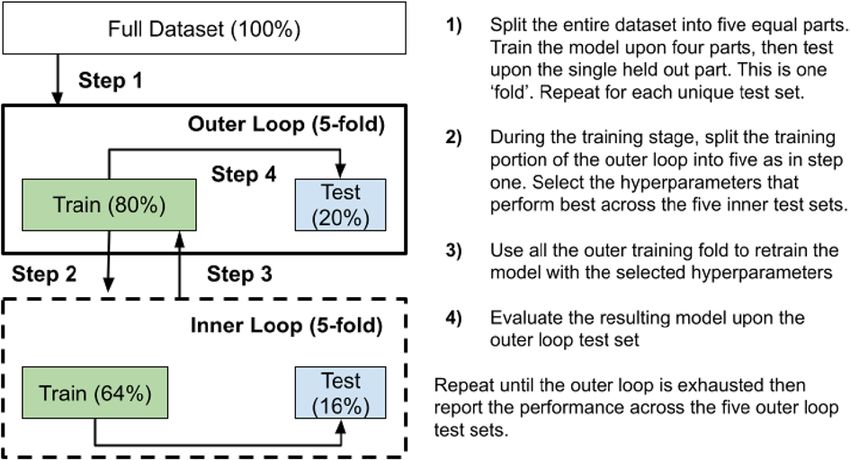
www.nature.com/scientificreports/
is low, medium or high for each personality trait in a controlled visual environment13 to barely above chance in
naturalistic conditions12.
Importantly, it is currently unknown whether an individual’s private traits and attributes can be predicted
from their visual behaviour upon their own SNS profile. We propose that it may be particularly important to show
whether eye movements are informative of personality whilst browsing SNS as it seems increasingly likely that
this data will be collected14. Thus, whilst users are aware that their eyes are being tracked, they may be unaware
of the potential for disclosing personal information simply by how they move their eyes whilst browsing their
own social media content. This leads to the key contribution of this paper; to investigate to what extent, if at all,
the eye movements made whilst participants’ browse SNS content can be used to predict their personality—a key
determinant of differences between i ndividuals15. We build upon previous literature by employing a naturalistic
stimulus (each person viewing their own Facebook News Feed), and testing a large sample of individuals. It is not
a foregone conclusion that eye movements upon SNS content will be informative of the individual’s personality
as we are varying both the low-level salience of the content (e.g., spatial frequencies, contrast), as well as the
semantic content. These changes in the stimulus across participants may induce random variance that reduces
or entirely masks the signal provided by eye movements.
In summary, we allowed participants to browse their own Facebook News F eed16 section whilst tracking
their eye movements, and employ a machine learning approach to predict whether they score low, medium or
high on each of the Big F ive4 personality traits. We formed five sets of predictor variables (in machine learning
terms, feature groups) that each describe a particular aspect of the participant’s oculomotor behaviour (outlined
in section “Feature engineering”). We then independently assessed the relative insight provided by each predictor
variable set into each of the Big Five personality traits. We chose to explore visual behaviour upon the Facebook
platform firstly because its prevalence makes it a relevant real-world stimulus and secondly because, as described
above, behaviour upon Facebook is linked to a wide range of personal a ttributes5. Finally, we chose to predict the
Big Five personality traits because of their relevance to targeting users with personalised marketing campaigns2,
and their known association with behaviour upon F acebook5. In contrast to previous literature, our aim is to
investigate what information might be contained in the eye movements alone, without taking into account details
of the content of the personal SNS feed.
Methods
Participants. Two hundred and nine participants were recruited from an undergraduate university cohort
( Mage = 20.45, SDage = 3.38, 169 Female) with age ranging from 18 to 51 years. All participants had normal, or
corrected to normal vision and owned a Facebook account. Demographic descriptors were not used as variables
in this study. Participants took part in exchange for course credits or a £5 reward. Twenty-nine participants (25
female) were excluded due to software failure, or having less than 80% valid eye position samples. Of the remain-
ing 180 participants, 161 reported using the Facebook platform daily or weekly with 14 reporting monthly usage
and five yearly. All participants provided written informed consent prior to the experiment. All experimental
protocols were approved by the Royal Holloway, University of London Research Ethics Committee. All methods
were performed in accordance with the ethical guidelines and regulations of the Declaration of Helsinki.
Eye tracking. Each participant viewed their personal Facebook News Feed using the Internet Explorer
browser (full-screen) upon a 23-inch TFT monitor (1920 × 1080). The viewing distance was 60 cm, and eye
movements were collected using a Tobii TX300 infrared eye tracker sampling at 300 Hz, allowing for free move-
ment of the head. Using Tobii Studio software, a five-point calibration procedure was followed, with the experi-
menter conducting a visual inspection of calibration accuracy before the task started. Stimuli were presented
and data was collected within Tobii Studio. Eye movements can be segmented into periods where the eye is kept
stable upon the visual scene (fixation) and information is available for cognitive p rocessing17, and into periods
where the eye is moving rapidly to a new location and less can be processed from the visual scene (saccades). The
Tobii Studio default I-VT filter (Window length: 20ms, Velocity threshold: 30 °C, Minimum fixation duration:
60ms) was used to detect fixations and saccades.
There are many different ways to characterise visual behaviour and previous attempts within the literature
broadly fall under one of two categories. One method is to describe the statistical properties of these eye move-
ments themselves (e.g., the mean duration of the fixation or saccades, as i n9,12). Such statistics capture information
about how the individual moves their eyes across the visual scene as a whole (e.g., the participant may make
frequent, short fixations interspersed with large saccades). In contrast, the other frequently used method is to
describe the distribution of fixations across multiple regions with different types of content, which has been
used successfully by researchers7,8. This is achieved by segmenting the visual scene into different areas of interest
(AOI) and describing the participant’s fixation behaviour within each region. This captures information about
how the participant attends to different regions or types of content within the visual scene (e.g., do they look
longer at videos rather than text). It is currently unknown whether the manner of describing visual behaviour
(i.e., statistical descriptions or AOI-based metrics) influences the accuracy of such classifications. In the feature
engineering section “Feature engineering” we describe how we create both statistical and AOI-based descrip-
tions of visual behaviour.
Visual stimuli. Each participant viewed (scrolled through) their own Facebook News Feed page for one
minute, resulting in a unique visual scene for each individual. We asked participants to view content as they
would usually, with two caveats: to avoid messaging other users, and avoid navigating away from the News Feed
section of their Facebook account. Participants were allowed to engage with interactive elements (e.g., click ’like‘
or comment) provided this would not navigate them away from the News Feed, and could use the mouse and/
Scientific Reports | (2022) 12:1178 | https://doi.org/10.1038/s41598-022-05095-0 2
Vol:.(1234567890)www.nature.com/scientificreports/
Figure 1. Labelling strategy for Facebook News Feed content. The content categories are ‘Create Post’, ‘Text
Content’, ‘Image Content’, ‘Video Content’, ‘Hybrid Content’, ‘Interaction Elements’, ‘Comments’. Each denotes a
unique type of content, and allows us to capture visual behaviour in response to this category of visual stimuli.
Hybrid Content refers to text overlaid upon an image. Coloured overlays are illustrative and were not displayed
to participants.
or the keyboard to scroll. The News Feed section hosts a constantly updating list of content displayed within a
dynamically generated, scrolling central column. Example items include a friend’s status updates and shared
content, along with advertisements and posts from public groups (for full details, s ee16). The Facebook platform
provides several constraints upon the location of visual stimuli that are common across participants. In particu-
lar, the dynamically generated content is always displayed within bounding boxes of varying size (depending
upon the content; e.g. multiple images, video, or text). Each bounding box is annotated with other user’s reac-
tions (likes, comments, etc.) directly below the content, and provides the user with space to engage in reacting
to the content themselves (not used within this experiment). As such, this elicits a typical viewing pattern of
observing a piece of content, followed by viewing other users’ reactions to that content.
Labelling strategy. Using in-built Tobii Studio functionality we obtain a record of the full web page con-
tent viewed, on to which visual behaviour has been mapped. Each web page is the product of concatenating
multiple screens’ worth of content that has been explored by the individual whilst scrolling through their own
News Feed. We found that the software did not always capture the full one minute viewing duration, but reliably
captured over twenty seconds. To ensure all participants were directly comparable, each participant’s content
was cropped to represent only the first twenty seconds of viewing behaviour. To protect the viewers’ and their
friends’ anonymity we obscured all content by blurring and, from earlier piloting, identify seven key types of
content (‘Create Post’, ‘Text Content’, ‘Image Content’, ‘Video Content’, ‘Hybrid Content’, ‘Interaction Elements’,
‘Comments’) that frequently occur across participants (Fig. 1). Here, ‘hybrid’ refers to content whereby an image
abelImg18.
is overlaid with text. These aspects are manually labelled using the free software L
Questionnaire materials. We collected demographic information from participants, including their age,
sex and personality traits using the NEO-FFI 60-item i nventory4. For each personality trait, a score between zero
(minimum association with the trait) and 48 (maximum association with the trait) is calculated.
Machine learning. Personality is often thought of as categorical, for example we say that someone is ‘low’
or ‘high’ upon Extroversion. Furthermore, studies that use mediation analysis to understand the link between
personality and other variables will often group individual’s as belonging to the ‘low’, ‘medium’ or ‘high’ category
of each of the personality traits19. Motivated by this, and following conventions established within previous
machine learning literature3,12,13, we approached the prediction of personality traits as a supervised classifica-
tion problem by splitting each trait into three categories (low, medium, high) using an quantile-based binning
strategy. Our binning did not result in exactly equal allocations due to discrete scores, thus, as a baseline, we
report the highest accuracy and F1macro score possible by predicting all examples to be the majority class. The
F1macro score can range from 1 (perfect score) to 0 and was chosen as it equally weights the classifier’s recall
( True Positive+False Negatives ) and precision ( True Positives+False Positives ) across the three categories (‘low’, ‘medium’,
True Positives True Positives
‘high’). This prevents a classifier from scoring highly by only learning that one category occurs more frequently
than the others, which is an advantage over reporting accuracy alone.
We apply k-nearest n eighbours20, ridge c lassification21 Support Vector M achines22, and naive Bayes
classifiers23. These algorithms were chosen because of their ability to learn from relatively few samples (i.e.,
Scientific Reports | (2022) 12:1178 | https://doi.org/10.1038/s41598-022-05095-0 3
Vol.:(0123456789)www.nature.com/scientificreports/
Figure 2. Evaluation strategy for machine learning models. Using a nested cross-validation strategy ensures
that the model is always tested upon ’out of sample’ data it has never seen before. In the outer loop we assess the
model’s performance. In the inner loop we try to find hyperparameters (settings for the model) that perform
well within the training data.
Feature group Number of features
AOI 21
AOI proportional 21
AOI with frequency 28
AOI proportional with frequency 28
Eye movement statistics (EMS) 15
Page content info 14
Table 1. Feature groups (evaluated independently). AOI Area of Interest Based.
compared to a neural network), and to represent different ways (e.g., linear, non-linear and probabilistic) of
learning from the provided data. We standardized each feature independently and within the cross-validation
scheme to avoid information about the out-of-sample data leaking into data used to train the m odel24. This
ensures each feature has a mean of zero and standard deviation of one. We utilise a nested (outer: five-fold, inner:
five-fold) cross-validation procedure, selecting hyper parameters upon the F1macro score metric within the inner
loops and collecting accuracy and F1macro scores across the outer loops. This validation scheme is illustrated in
Fig. 2. We chose to use a five-fold scheme in both the inner and outer loops as this adheres to best practices for
measuring model performance25 whilst ensuring that the test sets of the outer fold (36 instances) and inner fold
(∼29 instances) are well populated. This is important as having too small of a test set reduces the granularity of
the performance estimate (i.e., by constraining the number of values the evaluation procedure can produce).
For models that have accuracy scores greater than baseline and an F1macro score above .33 (chance), we calcu-
ermutation26, and correct these p-values
late the probability of finding the F1macro result by chance using label p
for multiple comparisons using the Benjamini Hochberg (BH) procedure27. Corrected alpha values below .05
are considered significant. Analysis is conducted using the Scikit-Learn l ibrary28.
Feature engineering. In a novel approach, this work will be the first to assess the relative capability of
using visual metrics that reflect spatial attention across broad categories of stimuli to accurately predict levels
of the Big Five personality traits whilst participants view their own SNS content. Specifically, the algorithms are
assessing the relative performance of visual metrics that reflect spatial attention, against more general statistical
descriptions of eye movements. To understand which of these measures best predict each personality trait, we
create separate groups of metrics (‘feature groups’—see Table 1) and evaluate the performance of the models
trained upon them. Each feature group is based upon the first twenty seconds of viewing behaviour. Our first
four feature groups explore area-of-interest (AOI) based metrics, whereby visual behaviour is grouped in cor-
respondence to the category of content viewed upon the web page. Our fifth group is composed of statistical
descriptions of eye movements that are not linked to any particular content. As a final sixth group, we introduce
a control feature group describing the proportion of the page occupied, and frequency of occurrence, for each
type of content labelled on the Facebook page. This allows us to understand if our oculomotor data is offering
insight into each personality trait above and beyond that available from the characteristics of the user’s Facebook
News Feed (according to the labelling strategy, as outlined in section “Labelling strategy”). We did not explore
whether including age or sex as inputs to the machine learning model improves performance due to our sample’s
narrow age range and primarily female cohort.
AOI‑based visual metrics. For each AOI category, we calculate the total fixation duration (TFD), number of
fixations, and time to first fixation (TTFF, defined as the time to fixate the first example of the AOI category)
Scientific Reports | (2022) 12:1178 | https://doi.org/10.1038/s41598-022-05095-0 4
Vol:.(1234567890)www.nature.com/scientificreports/
Event Property Metrics
Frequency Count
Saccade Duration Sum, mean, standard deviation and interquartile range
Amplitude Sum, mean, standard deviation and interquartile range
Frequency Count
Fixation
Duration Sum, mean, standard deviation and interquartile range
Vertical progress Pixels Pixels per second
Table 2. Statistical eye movement features.
values. There are seven content categories (‘Create Post’, ‘Image’, ‘Text’, ‘Video’, ‘Hybrid’, ‘Comments’, ‘Interaction
Elements’). For each participant the visual scene is different, leading to a varying proportion of the page being
accounted for by each content category across participants. Furthermore, not all categories may be present for a
particular participant. To ensure the predictor variables are in a machine friendly format (i.e., do not have miss-
ing values) when a content category never occurs for a particular participant (e.g., no videos appeared on their
News Feed section within the first twenty seconds), they receive zero for TFD and number of fixations, and the
maximum duration of 20 s for TTFF.
However, more can be done to capture additional information about the participant’s viewing behaviour. For
instance, by including the frequency of occurrence for each AOI type we can provide information about the extent
to which a participant had the opportunity to encounter a type of content (e.g., did they receive zero fixation
duration/number because they did not view a content that was present, or because it was never there?). Addi-
tionally, as stimuli size varies, some visual metrics (TFD, number of fixations) can be influenced by the amount
(proportion) of the page occupied by each category. For example, if the page is covered in text, it is perhaps less
surprising that the individual spent a longer duration than most viewing text. To address this, we can re-weight
the TFD and number of fixation metrics by the proportion of the page each category (e.g., image, video) occupies.
As such, we investigate whether incorporating this additional information influences classifier accuracy by
creating a two sets of predictor variables that have been either supplemented with the frequency of occurrence
for each AOI type (denoted by ‘with Frequency’ in Table 1), or where the TFD and number of fixations on each
AOI have been corrected for the proportion of the page the AOI accounts for (denoted by ‘Proportional’ in
Table 1). Independently evaluating each of these techniques for describing visual behaviour allows us to gain
insight into whether accounting for the aforementioned factors influences the ability of the classifier to make
accurate predictions.
Non‑AOI based visual metrics. Inspired by previous literature12,29, we create a separate set of metrics that rep-
resent overall statistical descriptions of fixation and saccadic behaviour across the Facebook News Feed. We
name this group of features ‘Eye Movement Statistics’. We consider fixations to have two attributes (frequency,
duration) and saccades to have three attributes (frequency, duration, amplitude). For the frequency attribute we
calculate the count (number of instances). For non-frequency attributes we calculate the sum, mean, standard
deviation and interquartile range. We also include the mean progress in vertical screen-based coordinates per
second (pixels per second) across the viewing duration, as an index of how quickly the participant progresses
through their exploration of the web page. This creates a total of 15 features in the statistical feature group (sum-
marised in Table 2).
Finally, to understand the insight provided by knowing the page content alone (and not the visual behaviour),
we included a control feature group consisting of the proportion of the page occupied, and the frequency of
occurrence, for each content category (14 features).
Results
Personality questionnaire distribution. Our personality questionnaire data contained one participant
with one missing questionnaire item response, which was imputed as the mean of the remaining trait-congruent
questionnaire items. Each trait has 12 relevant questionnaire items, and within our sample the internal consist-
ency ranged between ’Good’ (a = 0.710, Openness) and ’Very Good’ (a = 0.869, Conscientiousness). This illus-
trates that the questionnaire scores are reliable within our sample. The Shapiro-Wilk test for normality identifies
that trait Conscientiousness scores show evidence of being non-normally distributed (W = 0.974, p = 0.002),
and as such these scores may not be representative of the general population. No further traits demonstrated
evidence of being non-normally distributed. Descriptive statistics for all traits, after splitting into low, medium
and high categories, are presented in Table 3.
Social media content and visual behaviour. In our cohort the most frequent type of content to appear
on a user’s Facebook News Feed were interaction elements (‘like’, ‘share’, etc). Since these accompany each post,
they also let us know that each participant viewed roughly 2–4 posts within the twenty second viewing dura-
tion. We report the average total fixation duration and the number of fixations on each AOI type (averaged over
participants where the content was shown) in Table 4.
Scientific Reports | (2022) 12:1178 | https://doi.org/10.1038/s41598-022-05095-0 5
Vol.:(0123456789)www.nature.com/scientificreports/
Low Medium High Support
Label Mean (SD) Mean (SD) Mean (SD) [Low, medium, high]
Openness 23.95 (2.87) 30.37 (1.48) 36.74 (3.44) [59, 49, 72]
Conscientiousness 20.28 (4.73) 29.94 (2.18) 37.38 (2.83) [53, 62, 65]
Extroversion 21.97 (3.18) 29.25 (1.51) 35.05 (2.92) [59, 48, 73]
Agreeableness 24.41 (3.45) 30.87 (1.25) 37.37 (2.90) [58, 52, 70]
Neuroticism 17.12 (3.98) 26.37 (1.69) 34.63 (3.28) [58, 59, 63]
Table 3. Descriptive statistics for big five personality trait scores (out of 48) split by category.
AOI frequency Fixation duration (ms) Number of fixations
Category Mean (SD) Mean (SD) Mean (SD)
Comments 0.88 (0.95) 844 (822) 3.55 (3.89)
Hybrid* 0.59 (0.87) 2210 (1586) 10.01 (7.17)
Image 1.83 (1.33) 2316 (1517) 10.12 (6.58)
Text 2.08 (1.70) 2907 (1919) 13.32 (8.81)
Video 0.69 (0.87) 1584 (1496) 6.65 (6.19)
Create post 1 (0) 258 (392) 1.07 (1.31)
Interaction 3.13 (1.59) 642 (610) 2.74 (2.29)
Table 4. Frequency and fixation behaviour for each area of interest (AOI) category. *An image overlaid with
text, typically in a ’meme’ type format.
Feature group Baseline
Trait (Algorithm) F1Macro (SD) Accuracy (SD) F1Macro (Accuracy)
Openness EMS (SVM) 0.346 (0.016)* 41.7% (3.0) 0.19 (40.0%)
Conscientiousness AOI proportional (ridge) 0.398 (0.079)* 42.8% (8.5) 0.18 (36.1%)
Extroversion EMS (ridge) 0.476 (0.051)*** 49.4% (5.4) 0.19 (40.6%)
Agreeableness Page content info (ridge) 0.340 (0.058) 38.9% (6.3) 0.19 (38.9%)
Neuroticism AOI (Naive Bayes) 0.334 (0.072) 35.6% (6.7) 0.17 (35.0%)
Table 5. Best classifier performance statistics for each personality trait. *p < 0.05, **p < 0.01, ***p < 0.001.
AOI Area of Interest, EMS Eye Movement Statistics, Ridge One-vs-Rest Ridge Classification, KNN K-nearest
neighbors, SVM Linear support vector machine.
Classification results. The best performance achieved across the feature groups for each personality trait
is summarised in Table 5. All significance values reported in this section are adjusted for multiple comparisons
using the Benjamini Hochberg procedure27.
Eye movement statistics. For the Eye Movement Statistics feature set we identify that the personality traits
of Openness and Extroversion can be predicted significantly better than chance, and for Extroversion this is
achieved across multiple algorithms. The best performance for Openness ( F1macro = 0.346, Accuracy = 41.7%)
comes from a linear support vector machine classifier. The best performance for Extroversion
( F1macro = 0.476, Accuracy = 49.4%) comes from using a ridge classifier. We note that the accuracy perfor-
mance for trait Openness is only marginally better than what can be achieved by classifying all instances as the
most frequently occurring category (baseline accuracy Accuracy = 40.6%).
AOI feature sets. Using the area of interest based descriptions of visual behaviour, the personal-
ity trait of Conscientiousness was predicted significantly better than chance using either the AOI
( F1macro = 0.400, Accuracy = 42.2%), or AOI proportional feature set (F1macro = 0.398, Accuracy = 42.8%).
We note that this represents a modest improvement over what can be achieved by classifying all instances as the
most frequently occurring category (baseline accuracy Accuracy = 36.1%), or through knowing only the page
content information alone ( F1macro = 0.391, Accuracy = 40.0%).
Page content information. For the control feature group of page content information, we find that no traits were
able to be predicted significantly above chance.
Scientific Reports | (2022) 12:1178 | https://doi.org/10.1038/s41598-022-05095-0 6
Vol:.(1234567890)www.nature.com/scientificreports/
Feature group F1 score (SD)
Trait (Algorithm) Low Medium High Accuracy (%)
Openness EMS (SVM)* 0.421 (0.067) 0.090 (0.075) 0.527 (0.045) 41.7
EMS (Ridge)*** 0.418 (0.083) 0.481 (0.135) 0.529 (0.092) 49.4
Extroversion
EMS (SVM)* 0.438 (0.070) 0.338 (0.093) 0.471 (0.067) 43.9
AOI Proportional (Ridge)* 0.219 (0.054) 0.493 (0.158) 0.482 (0.076) 43
Conscientiousness AOI (Ridge)* 0.284 (0.108) 0.370 (0.188) 0.546 (0.099) 42
Page Content Info (SVM)† 0.34 (0.101) 0.40 (0.091) 0.43 (0.059) 40
Table 6. Classifier performance by personality category for significant models. *p < 0.05, **p < 0.01, ***p
< 0.001 corrected via Benjamini–Hochberg procedure. †Included for comparison, Ridge One-vs-Rest Ridge
Classification, KNN K-nearest neighbors, SVM Linear support vector machine, AOI Area of Interest, EMS Eye
Movement Statistics.
Summary. Across the feature groups the traits of Openness, Conscientiousness and Extroversion were able to
be predicted significantly better than chance. No feature group gave significant insight into the personality traits
of Agreeableness or Neuroticism. We further explore the significant results presented within this section by
investigating the classifier’s performance within each category ([low, medium, high]) in the next section.
Exploratory analysis: classifier performance by trait category. For each significant model (i.e.,
with an alpha < 0.05 after BH correction), we evaluate the F1 score for each trait category (low, medium, high)
as shown in Table 6. To aid the reader, the standard deviation represents how stable the model’s performance was
across the five outer folds (i.e., how much performance varied with different training/test sets).
It is immediately clear that the classifier for trait Openness is performing very poorly for individuals who
are average scorers (i.e., those in the medium category). Alongside the earlier remark upon only being margin-
ally more accurate than our baseline, this leads to us deciding that the result for trait Openness should not be
interpreted further.
For Extroversion, the ridge classifier performs progressively better as we move from the low, to medium,
and finally to the high category. It has a similar F1 scores across each trait category, demonstrating a balanced
classifier. In contrast, the support vector machine based classifier shows a dip in performance when predicting
the medium group, demonstrating an imbalance across the categories.
For Conscientiousness, the Ridge classifier based upon the AOI proportional features has similar F1 scores for
both the medium and high categories, and substantially worse performance for the low category. The classifier’s
performance is most stable when predicting the high category, and most variable when predicting the medium
category. For the Ridge classifier built upon the AOI feature set, the performance progressively improves with
the quantile category (low < medium < high ) and is also most variable for the medium category. That each
classifier performs markedly worse when predicting the low category for Conscientiousness is intriguing. To
understand this further, we calculated how similar participants are within each category when responding to
the twelve questionnaire items used to calculate the trait score. For Conscientiousness, the average euclidean
pairwise distance between participants becomes smaller (participants respond more similarly) as the quantile-
based category increases from low (4.04) to medium (3.9) and high (3.5). As such, we propose that individual’s
scoring low upon trait Conscientiousness represent a more diverse (less homogeneous) cohort than high scorers,
which may result in a more challenging classification task.
Discussion
Online social networking sites (SNS) provide a rich and ecologically valid visual experience with a variety of
content and information being presented. Previous literature has illustrated that various aspects of a user’s
online behaviour upon SNS, such as the distribution of ‘likes’ upon Facebook3, or content of text-based posts
upon Twitter30, can be used to predict aspects of an individual’s personality. In a novel approach, we present
evidence that an individual’s pattern of eye movements, whilst browsing their own Facebook News Feed section,
is informative of aspects of their personality (Extroversion and Conscientiousness).
Main findings. Our primary finding is that the eye tracking based techniques discussed within this paper
provide a novel and non-intrusive method of predicting an individual’s Extroversion and Conscientiousness cat-
egory (low/medium/high) from a single twenty second interaction. This is a substantially shorter time scale than
employed within previous literature (e.g., 20 s versus Hoppe et al.’s 12.5 m ins12 and Berkovsky et al.’s 9.2 m
ins13).
It is also, to the authors knowledge, the first time that personality has been predicted from eye movements within
this type of stimulus. This finding may support the development of socially aware human–computer interfaces as
users’ personalities and visual behaviours are both associated with distinct information-seeking characteristics31.
Finally, we have discovered that trait Extroversion can be predicted to a greater extent than trait Conscien-
tiousness. Notably, the classifiers predicting trait Conscientiousness vary in their performance across the low,
medium and high categories—with the lowest performance when predicting low scorers, and the most success
in predicting high scorers. A possible explanation for the varying performance across the categories also comes
from the nature of the trait itself, with Conscientiousness being positively associated with task completion32, and
Scientific Reports | (2022) 12:1178 | https://doi.org/10.1038/s41598-022-05095-0 7
Vol.:(0123456789)www.nature.com/scientificreports/
adherence33. Thus, we would expect Conscientiousness to influence both an individual’s visual behaviour, and
their completion of the sixty-item personality questionnaire; with high scorers being more methodical (thus
exhibiting similar behaviour) and low scorers being less principled (thus exhibiting more varied behaviour) in
their approach. To explore this, we calculated how similar participants are within each Conscientiousness cat-
egory when responding to the twelve questionnaire items used to calculate trait Conscientiousness. Our results
support this interpretation, with the average euclidean pairwise distance between participants becoming smaller
(participants respond more similarly) as the quantile-based category increases from low to high. As such, we
propose that individual’s scoring low upon trait Conscientiousness represent a more diverse (less homogeneous)
cohort than high scorers, which is reflected within the labelling strategy and may result in a more challenging
classification task.
Interestingly, whilst we found we were able to predict trait Extroversion and Conscientiousness, we were
unable to classify participants substantially better than chance for trait Openness, Agreeableness, or Neuroticism
within our paradigm. Therefore there appears to be a performance trade-off with measuring visual behaviour
over diverse stimuli upon such short time scales when comparing to results from previous literature12,13. A
direction for future research is to evaluate how predictive accuracy varies with both longer, and shorter, record-
ing durations. We suggest that our findings are most similar t o31 who investigated whether specific personality
traits influence how individuals seek out and process information in information seeking tasks (i.e., whilst using
an online search engine). The authors investigated factual, interpretative and exploratory information seeking
paradigms and found in all three that Extroversion, Agreeableness and Conscientiousness correlated with the
number and total duration of fixations expressed by the individual. In contrast, Openness and Neuroticism
were not correlated with any of the measured eye movements. Therefore, if we conceptualise browsing Face-
book as a information search task, it is perhaps not surprising that our results indicate that Extroversion and
Conscientiousness were able to be predicted significantly better than chance, whilst Openness and Neuroticism
were not. This leaves the contradictory finding for Agreeableness, which was not predicted significantly bet-
ter than chance within our study, yet was found to significantly correlate with eye movements in information
search tasks31. Agreeableness is likely to influence the individual’s behaviour when choosing whether to accept
a particular source of information during a search task, which effectively biases the decision of when to accept
that the search goal has been fulfilled and the task has been completed. However, whilst browsing Facebook in
this study the participants were engaged in a free-viewing task and not searching for a set goal (i.e., piece of
information) and there was no explicit objective to meet. As this is not a directed search, there was no need for
participants to choose when to stop and accept the information as sufficient to fulfil the objective, which may be
why the trait of Agreeableness was found within previous literature31, but was not replicated within this study.
Overall, our study’s results suggest that browsing the Facebook News Feed is similar to information search tasks
in reflecting trait Extroversion and Conscientiousness, but our design lacked the acceptance criterion that we
speculate may be needed for the eye movements to be influenced by the individual’s Agreeableness. This provides
a key direction for future research, as experimentally manipulating the browsing task would allow the researcher
to empirically investigate if the inclusion of an acceptance criterion is essential for trait Agreeableness to be
accurately predicted from visual behaviour.
Types of SNS content that are predictive of personality. As the perceived task and type of content
influences the expression of visual behaviour34, we sought to understand how to best characterise visual behav-
iour in a way that reflects (is predictive of) personality. Within our paradigm, statistical descriptions of visual
behaviour that are not tied to any particular content are more informative of trait Extroversion than descrip-
tions of visual behaviour derived from responses to a particular category of stimuli (e.g., AOI-based metrics).
Together, this illustrates that statistical descriptions of oculomotor events are informative of trait Extroversion
within extremely short time periods, even when each participant views a diverse range of visual stimuli. Our
finding of Extroversion being linked to visual behaviour upon SNS content also expands upon the previous work
of Rauthmann et al.9, who found that in abstract video-based stimuli Extroversion was linked to visual behaviour
(being predicted by shorter dwelling times). Our finding could relate to the strong links between Extroversion
and sociability35, which, given the nature of our social media stimuli, may have provided relevant visual content
for evoking trait-congruent visual behaviour. That Extroversion appears to be rapidly manifested in statistical
descriptions of oculomotor behaviour whilst viewing SNS content has substantial consequences for the applica-
tion of personality-detection within applied settings, as this implies it is not essential to know the exact stimuli
being presented.
In a novel contribution to the literature, we identify that AOI-based metrics outperform statistical descrip-
tions of visual behaviour when predicting trait Conscientiousness. Our results suggest that, when viewing SNS
content, trait Conscientiousness is reflected in the way that the individual distributes their attention across dif-
ferent types of content within the visual scene. In considering why conscientiousness is the only trait presenting
better results for the new AOI features (in comparison with the EMS results) we note that Conscientiousness is
related to the ability for self-regulation during effortful control36, with individual’s scoring higher upon Consci-
entiousness being more likely to maintain a consistent approach to the given task. In our paradigm, the task was
to view their own Facebook News Feed, which provides the ongoing ability for the participant to decide to receive
a new stimuli during the session (e.g., ‘Do I look at the comments, or keep on scrolling?’). Thus, it may be that
the participant’s level of Conscientiousness influenced their style (e.g., systematic or more chaotic) of visually
exploring the content, leading to Conscientiousness being reflected within the distribution of the participant’s
visual behaviour across the different content categories.
However, our features were not informative when attempting to predict the remaining personality traits (i.e.,
the EMS and AOI-based descriptions of visual behaviour held little information above and beyond knowing
Scientific Reports | (2022) 12:1178 | https://doi.org/10.1038/s41598-022-05095-0 8
Vol:.(1234567890)www.nature.com/scientificreports/
the content upon the page, which itself was not informative). This appears to conflict with some previous find-
ings such as Berkovsky et al.13, who showed that characterising visual behaviour in response to multiple static
images can be highly informative of trait personality (> 61% accuracy upon the Big Five personality traits). The
difference in results may be attributable to methodological differences. In Berkovsky et al.13, visual behaviour
was described according to each image seen, which due to the images being identical across participants, were
directly comparable. This allows the reasonable assumption that observed variances in visual behaviour between
participants are driven by the individual differences, rather than the visual properties of the image37. In contrast,
our AOI categories represent not a single identical image, but a diverse range of content, and items within a
single category may vary in colour, spatial frequencies, subject matter, and more. Whilst this accurately reflects
the complex variety of visual and social contexts present upon a fully-featured SNS platform, the expression of
visual behaviour is influenced by the properties of the visual s timulus6,34,37. As such, our design is likely to have
introduced a substantial amount of variance in visual behaviour not directly linked to the user’s personality,
which increases the difficulty of the classification problem and may have led to reduced performance. This raises
questions regarding whether our results are directly comparable to studies utilising static free-viewing designs,
and further suggests that models built upon descriptions of oculomotor behaviour in response to the static free
viewing of images may not generalise well within applied SNS settings.
Finally, our choices for the AOI categories were informed by tasks identified as driving distinct visual behav-
iour (e.g., reading text, searching an image or watching a dynamic scene34,38), and aimed to capture visual
behaviour in relationship to sufficiently broad categories as to be reasonably comparable across the majority of
participants, whilst remaining sufficiently distinct to reflect a unique category of visual behaviour. As we kept our
descriptions of visual behaviour broad (regarding labelling of AOIs), the outlined technique could be applied to
any web page and this is a direction for future research. However, we note that alternative category choices may
lead to improved (or reduced) performance in classifying personality from visual behaviour. Future research may
wish to explore which content categorisation schemes best capture trait-congruent visual behaviour.
Practical implications. Past research has suggested that tailoring a product’s advertising to appeal to an
individual’s personality can lead to increased conversion rates during online marketing c ampaigns2, and pro-
mote consumer loyalty and engagement1. As such, it is desirable to be able to understand the personality of the
user in order to maximise the potential for presenting them with engaging human computer interactions. How-
ever, current methodologies for evaluating personality either require extensive previous knowledge about the
user’s past interactions1,5, or are disruptive to a user’s enjoyment of the experience (e.g., a user may not wish to
conduct a questionnaire before engaging in an interaction). Whilst the technology described here may not yet be
ready for practical applications, the ubiquity of eye tracking devices is g rowing14. This is especially relevant given
that our research suggests it is not essential to know the exact stimuli being presented to the individual (e.g., as
with our findings for Extroversion) when predicting their personality from visual behaviour. This reduces the
demand for rigorous labelling and processing of the users’ social media content, and may provide a privacy-
preserving method of implicitly assessing an individual’s personality.
Summary. To conclude, this study explored the ability for visual behaviour upon an SNS site to give insight
into an individual’s personality, in a situation where the classifier has no previous knowledge regarding the user’s
past behaviour upon the SNS platform. We demonstrate that within a single twenty second encounter aspects of
the users personality can be predicted significantly better than chance. This highlights the possibility of a future
where, with additional development, a provider may be able to tailor the presentation of its services or products
to the user’s attributes within a very short time frame. However, as the current performance of these classifiers is
modest, there may be situations in which visual behaviour metrics can be combined with existing data sources
to increase performance when predicting personality traits. For example, previous literature has illustrated that
existing records of an individual’s behaviour upon SNS sites (e.g., likes3 and language use39) can be informative of
personality. Future research may wish to explore alternative labelling strategies and the possibility of leveraging
existing recordings of user interaction to compliment the methodologies outlined within this paper; which may
lead to the increased performance required for practical applications.
Code availability
The code, features and outcome variables for reproducing the results of the machine learning studies is available
as a GitHub repository https://github.com/Callum-Woods/Twenty_Seconds_to_Know_You.
Received: 16 April 2021; Accepted: 16 December 2021
References
1. Matz, S. C. & Netzer, O. Using Big Data as a window into consumers’ psychology. Curr. Opin. Behav. Sci. 18, 7–12. https://doi.org/
10.1016/j.cobeha.2017.05.009 (2017).
2. Matz, S. C., Kosinski, M., Nave, G. & Stillwell, D. J. Psychological targeting as an effective approach to digital mass persuasion.
Proc. Natl. Acad. Sci. 114, 12714–12719. https://doi.org/10.1073/pnas.1710966114 (2017).
3. Kosinski, M., Stillwell, D. & Graepel, T. Private traits and attributes are predictable from digital records of human behavior. Proc.
Natl. Acad. Sci. 110, 5802–5805. https://doi.org/10.1073/pnas.1218772110 (2013).
4. McCrae, R. & Costa, P. A contemplated revision of the NEO Five-Factor Inventory. Pers. Individ. Dif. 36, 587–596. https://doi.org/
10.1016/S0191-8869(03)00118-1 (2004).
5. Settanni, M., Azucar, D. & Marengo, D. Predicting individual characteristics from digital traces on social media: A meta-analysis.
Cyberpsychol. Behav. Soc. Netw. 21, 217–228. https://doi.org/10.1089/cyber.2017.0384 (2018).
Scientific Reports | (2022) 12:1178 | https://doi.org/10.1038/s41598-022-05095-0 9
Vol.:(0123456789)www.nature.com/scientificreports/
6. Hayhoe, M. & Ballard, D. Eye movements in natural behavior. Trends Cogn. Sci. 9, 188–194. https://doi.org/10.1016/j.tics.2005.
02.009 (2005).
7. Nummenmaa, L., Hyönä, J. & Calvo, M. G. Eye movement assessment of selective attentional capture by emotional pictures. Emo‑
tion 6, 257–268. https://doi.org/10.1037/1528-3542.6.2.257 (2006).
8. Holmes, T. & Zanker, J. M. Using an oculomotor signature as an indicator of aesthetic preference. Perception 3, 426–439. https://
doi.org/10.1068/i0448aap (2012).
9. Rauthmann, J. F., Seubert, C. T., Sachse, P. & Furtner, M. R. Eyes as windows to the soul: Gazing behavior is related to personality.
J. Res. Pers. 46, 147–156. https://doi.org/10.1016/j.jrp.2011.12.010 (2012).
10. Armstrong, T. & Olatunji, B. O. Eye tracking of attention in the affective disorders: A meta-analytic review and synthesis. Clin.
Psychol. Rev. 32, 704–723. https://doi.org/10.1016/j.cpr.2012.09.004 (2012).
11. Bargary, G. et al. Individual differences in human eye movements: An oculomotor signature?. Vision Res. 141, 157–169. https://
doi.org/10.1016/j.visres.2017.03.001 (2017).
12. Hoppe, S., Loetscher, T., Morey, S. A. & Bulling, A. Eye movements during everyday behavior predict personality traits. Front.
Hum. Neurosci. 12, 105. https://doi.org/10.3389/FNHUM.2018.00105 (2018).
13. Berkovsky, S. et al. Detecting personality traits using eye-tracking data. In Proceedings of the 2019 CHI Conference on Human
Factors in Computing Systems, CHI ’19, 221:1–221:12. https://doi.org/10.1145/3290605.3300451 (2019).
14. Coldewey, D. Facebook, YouTube, Netflix and more get eye-tracking apps from Tobii (2020).
15. Costa, P. T. Work and personality: Use of the NEO-PI-R in industrial/organisational psychology. Appl. Psychol. 45, 225–241. https://
doi.org/10.1111/j.1464-0597.1996.tb00766.x (1996).
16. Centre, F. H. How News Feed Works. https://www.facebook.com/help/1155510281178725 (2019).
17. Kowler, E. Eye movements: The past 25 years. Vision Res. 51, 1457–1483. https://doi.org/10.1016/j.visres.2010.12.014 (2011).
18. Tzutalin. LabelImg. Git code. https://github.com/tzutalin/labelImg (2015).
19. Carlo, G., Okun, M. A., Knight, G. P. & de Guzman, M. R. T. The interplay of traits and motives on volunteering: Agreeableness,
extraversion and prosocial value motivation. Pers. Individ. diff. 38, 1293–1305. https://doi.org/10.1016/j.paid.2004.08.012 (2005).
20. Guo, G., Wang, H., Bell, D., Bi, Y. & Greer, K. KNN model-based approach in classification. In On the Move to Meaningful Internet
Systems, 986–996, https://doi.org/10.1007/978-3-540-39964-3_62 (Springer, Berlin, Heidelberg, 2003).
21. Friedman, J., Hastie, T. & Tibshirani, R. Regularization paths for generalized linear models via coordinate descent. J. Stat. Softw.
33, 1–22 (2010).
22. Hearst, M. A., Dumais, S. T., Osuna, E., Platt, J. & Scholkopf, B. Support vector machines. IEEE Intell. Syst. Appl. 13, 18–28. https://
doi.org/10.1109/5254.708428 (1998).
23. Zhang, H. The optimality of Naive Bayes. AAI 1, 6 (2004).
24. Yarkoni, T. & Westfall, J. Choosing prediction over explanation in psychology: Lessons from machine learning. Perspect. Psychol.
Sci. 12, 1100–1122. https://doi.org/10.1177/1745691617693393 (2017).
25. Rodriguez, J. D., Perez, A. & Lozano, J. A. Sensitivity analysis of k-fold cross validation in prediction error estimation. IEEE Trans.
Pattern Anal. Mach. Intell. 32, 569–575. https://doi.org/10.1109/TPAMI.2009.187 (2010).
26. Ojala, M. & Garriga, G. C. Permutation tests for studying classifier performance. J. Mach. Learn. Res. 11, 1833–1863 (2010).
27. Benjamini, Y. & Hochberg, Y. Controlling the false discovery rate: A practical and powerful approach to multiple testing. J. R. Stat.
Soc. B 57, 289–300 (1995).
28. Pedregosa, F. et al. Scikit-learn: Machine learning in python. J. Mach. Learn. Res. 12, 2825–2830 (2011).
29. Baranes, A., Oudeyer, P. Y. & Gottlieb, J. Eye movements reveal epistemic curiosity in human observers. Vision Res. 117, 81–90.
https://doi.org/10.1016/j.visres.2015.10.009 (2015).
30. Arnoux, P.-H. et al. 25 tweets to know you: A new model to predict personality with social media. In AAAI Conference on Web
and Social Media, vol. 11, 472–476 ( AAAI Press, 2017).
31. Al-Samarraie, H., Eldenfria, A. & Dawoud, H. The impact of personality traits on users’ information-seeking behavior. Inf. Process.
Manag.https://doi.org/10.1016/j.ipm.2016.08.004 (2016).
32. Claessens, B. J. C., Eerde, W. V., Rutte, C. G. & Roe, R. A. Things to do today...: A daily diary study on task completion at work.
Appl. Psychol. 59, 273–295. https://doi.org/10.1111/j.1464-0597.2009.00390.x (2010).
33. Molloy, G. J., O’Carroll, R. E. & Ferguson, E. Conscientiousness and medication adherence: A meta-analysis. Ann. Behav. Med. 47,
92–101. https://doi.org/10.1007/s12160-013-9524-4 (2014).
34. Tatler, B. W., Wade, N. J., Kwan, H., Findlay, J. M. & Velichkovsky, B. M. Yarbus, eye movements, and vision. Perception 1, 7–27.
https://doi.org/10.1068/i0382 (2010).
35. Plomin, R. Extraversion: Sociability and impulsivity?. J. Pers. Assess. 40, 24–30. https://d
oi.o
rg/1 0.1 207/s 15327 752jp
a4001_6 (2010).
36. Jensen-Campbell, L. A. et al. Agreeableness, conscientiousness, and effortful control processes. J. Res. Pers. 36, 476–489. https://
doi.org/10.1016/S0092-6566(02)00004-1 (2002).
37. Itti, L. & Koch, C. Computational modelling of visual attention. Nat. Rev. Neurosci. 2, 194–203. https://doi.org/10.1038/35058500
(2001).
38. Bulling, A., Ward, J. A., Gellersen, H. & Tröster, G. Eye movement analysis for activity recognition using electrooculography. IEEE
Trans. Pattern Anal. Mach. Intell. 33, 741–753. https://doi.org/10.1109/TPAMI.2010.86 (2011).
39. Park, G. et al. Automatic personality assessment through social media language. J. Pers. Soc. Psychol. 108, 934–952. https://doi.
org/10.1037/pspp0000020 (2015).
Acknowledgements
We thank Jenna Morshead, Tatiana Tsaryuk and Vrishni Kanhye for invaluable help in collecting and labelling
the data set.
Author contributions
C.W. contributed toward the conception of the studies, conducted the data collection and analysis, and wrote
the manuscript. Z.L. advised upon machine learning techniques, and contributed toward the conception of
the studies. D.W. contributed toward the the conception of the studies and interpretation of the results. S.D.
contributed toward the conception of the studies and interpretation of the results. All authors reviewed and
contributed towards the manuscript.
Competing interests
The authors declare no competing interests.
Additional information
Correspondence and requests for materials should be addressed to C.W.
Scientific Reports | (2022) 12:1178 | https://doi.org/10.1038/s41598-022-05095-0 10
Vol:.(1234567890)You can also read