Trends Analysis of Non-Hodgkin Lymphoma at the National, Regional, and Global Level, 1990-2019: Results From the Global Burden of Disease Study 2019
←
→
Page content transcription
If your browser does not render page correctly, please read the page content below

ORIGINAL RESEARCH
                                                                                                                                       published: 23 September 2021
                                                                                                                                      doi: 10.3389/fmed.2021.738693

                                              Trends Analysis of Non-Hodgkin
                                              Lymphoma at the National, Regional,
                                              and Global Level, 1990–2019: Results
                                              From the Global Burden of Disease
                                              Study 2019
                                              Wenwen Cai 1,2† , Qingle Zeng 3† , Xingxing Zhang 1,2 and Weiqing Ruan 1*
                                              1
                                               Huiqiao Medical Center, Nanfang Hospital, Southern Medical University, Guangzhou, China, 2 School of Nursing, Southern
                                              Medical University, Guangzhou, China, 3 Department of Interventional Radiology, Nanfang Hospital, Southern Medical
                                              University, Guangzhou, China

                                              Background: Non-Hodgkin lymphoma is a common hematologic malignancy. This
                           Edited by:         article aimed to estimate the trends of non-Hodgkin lymphoma (NHL) globally from 1990
               Uday Prakash Kulkarni,         to 2019.
        Christian Medical College and
                       Hospital, India        Methods: Data on the NHL burden were explored from the Global Burden of Disease
                       Reviewed by:           study 2019. The trends of NHL burden were estimated using age-standardized rate (ASR)
                    Sushil Selvarajan,
                                              and estimated annual percentage change (EAPC).
        Christian Medical College and
                        Hospital, India       Results: The ASR of NHL incidence showed an increasing trend worldwide from 1990
                       Nabhajit Mallik,
    Post Graduate Institute of Medical
                                              to 2019, with an EAPC of.56 [95% CI: 0.45–0.66]. Meanwhile, increasing trends were
             Education and Research           observed in both sexes and in most geographic regions, particularly East Asia (EAPC =
                     (PGIMER), India
                                              3.57, 95% CI: 3.29–3.86). The most pronounced increasing trends were seen in Georgia
                  *Correspondence:
                                              (EAPC = 4.7, 95% CI: 4.20–5.21), followed by Belarus and Uzbekistan. However, death
                       Weiqing Ruan
                    jamela@sina.com           and disability-adjusted life years (DALYs) caused by NHL showed decreasing trends
     † These
                                              globally, in which the respective EAPCs were −0.09 (95% CI: −0.17 to −0.02) and −0.28
              authors have contributed
    equally to this work and share first      (95% CI: −0.35 to −0.22). Decreasing trends were mainly seen in high and high-middle
                            authorship        sociodemographic index (SDI) areas. At the national level, the largest increasing trends
                                              of death and DALYs were observed in Georgia, in which the respective EAPCs were 4.54
                    Specialty section:
          This article was submitted to       (95% CI: 4.01–5.07) and 4.97 (95% CI: 4.42–5.52).
                            Hematology,
                                              Conclusions: Decreasing trends of death and DALYs caused by NHL were observed
                a section of the journal
                   Frontiers in Medicine      worldwide from 1990 to 2019, but NHL remains a substantial challenge globally. The
             Received: 13 July 2021           findings would inform the strategies for reducing the burden of NHL.
         Accepted: 24 August 2021
                                              Keywords: non-Hodgkin lymphoma, global burden of disease, age-standardized rate, estimated annual
      Published: 23 September 2021
                                              percentage change, epidemiological trend
                            Citation:
 Cai W, Zeng Q, Zhang X and Ruan W
             (2021) Trends Analysis of
      Non-Hodgkin Lymphoma at the
                                              INTRODUCTION
 National, Regional, and Global Level,
 1990–2019: Results From the Global
                                              Non-Hodgkin lymphoma is a kind of lymphoma characterized by a wide range of morbid features
      Burden of Disease Study 2019.           and difficulties in diagnosis (1) and accounts for 90% of all lymphoma incidences (2).
               Front. Med. 8:738693.            According to the Global Cancer Statistics 2018, the burden of non-Hodgkin lymphoma
     doi: 10.3389/fmed.2021.738693            (NHL) aggravated in many regions, and reached 509,590 incidences and 248,724 deaths in 2018,

Frontiers in Medicine | www.frontiersin.org                                         1                                      September 2021 | Volume 8 | Article 738693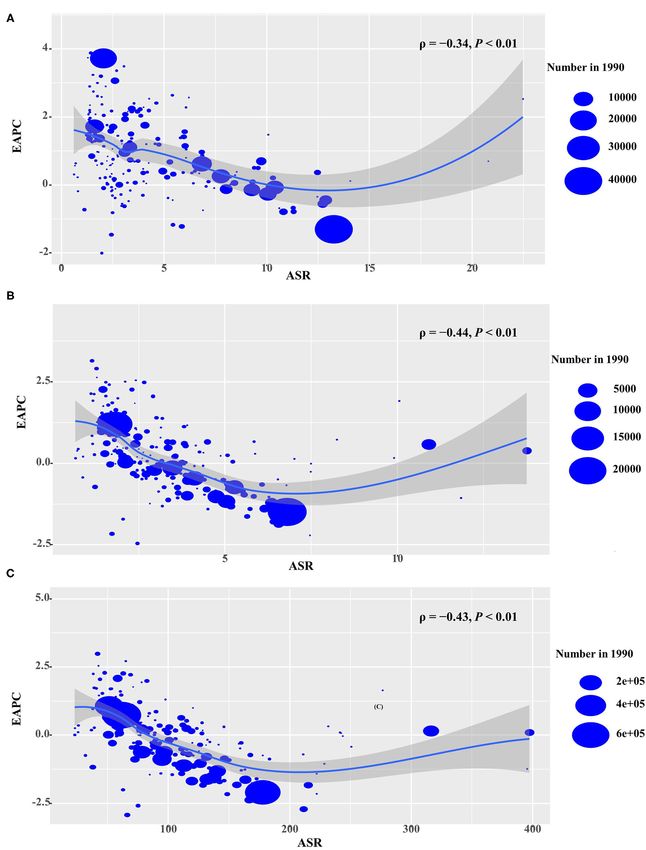
Cai et al.                                                                                                          Trends Analysis of Non-Hodgkin Lymphoma

accounting for 2.8 and 2.6%, respectively, of the total incidence                    Statistical Analysis
and mortality of 36 cancers involved (3). In the United States,                      When comparing the disease distribution of several different
for example, the incidence of NHL has increased significantly                        age structures or the same population over a period of
over the past few decades, and now accounts for ∼4% of total                         time with different age structures, age standardization is
cancer incidence (4). Conversely, improved survival in NHL was                       necessary to adjust for potential age structure confusion. Age-
commonly reported in recent years. In the 1970s, just over one-                      standardized rate (ASR) (/100,000 people) is calculated using the
fifth of people with NHL survived more than 10 years, but now                        following formula:
the proportion has increased to almost two-thirds (5). Of these,                                               PA
survival in the UK has seen a 3-fold increase in the last 40 years                                                    ai wi
(5). The reasons for the increasing NHL incidence involve many                                         ASR = Pi=1
                                                                                                               A
                                                                                                                              × 100, 000
                                                                                                                   i=1 wi
social factors. The major risk factors for the development of
NHL are various, including AIDS infection, immunosuppressive                         Age-standardized rate is equal to the sum of the products of
drugs, occupational exposures, pesticide contiguity, and smoking                     ai (the age-specific rates, where i denotes the ith age class) and
(6–9). In terms of the typologies of NHL, it has been studied                        wi (the number of persons or weight) in the same age group i of
that most NHL evolved from mature B lymphocytes, with a few                          the chosen reference standard population, then divided by the
from T lymphocytes or natural killer (NK) cells (10). In Western                     sum of standard population weights.
countries, the majority of NHL cases are B-cell lymphomas                                The estimated annual percentage change is equal to the annual
(∼85%), but T-cell lymphoma is less common (∼15%), while the                         change over the specified range and is calculated on a linear scale.
reversed proportion occurs in developing regions (5, 11), which                      The natural logarithm of the regression-line is fitted to ASR with
probably explains the significant geographic heterogeneity in the                    the following formula: y = α + β x + ε, where y = ln (ASR), and
distribution of NHL burden.                                                          x = calendar year. Estimated annual percentage change (EAPC)
    The Global Burden of Disease study (GBDs) comprehensively                        and its 95% CI were calculated as 100 × [exp(β)−1] with the
assessed the burden caused by cancers globally (12, 13),                             linear regression model (15, 16). The trends were determined as
which facilitated the tracking of the temporal trends of the                         follows: when both the EAPC and its lower limit of 95% CI were
disease burden. Strategies such as adjusting causes of death                         >0, it meant there was an increasing trend; when both the EAPC
to compensate for incomplete data, developing maps to adjust                         and its upper 95% CI were
Cai et al. Trends Analysis of Non-Hodgkin Lymphoma
TABLE 1 | Number and age-standardized rate of non-Hodgkin lymphoma incidence on a global scale by sex, SDI areas, and geographic regions in 1990 and 2019, and
the percentage change of absolute number and the EAPCs from 1990 to 2019.
1990 2019 1990–2019
Characteristics Number ASR/100,000 Number ASR/100,000 Percentage EAPC
×103 (95% UI) (95% UI) ×103 (95% UI) (95% UI) change (%) (95%CI)
Overall 190.73 4.65 457.08 5.73 139.65 0.56
(179.03–203.62) (4.37–4.93) (416.89–498.78) (5.21–6.25) (0.45–0.66)
Sex
Male 108.17 5.64 266.09 7.20 146.00 0.78
(101.46–116.46) (5.31–6) (241.38–291.09) (6.55–7.88) (0.69–0.87)
Female 82.56 3.79 190.98 4.45 131.33 0.25
(76.85–88.72) (3.52–4.05) (169.14–210.59) (3.95–4.91) (0.11–0.40)
SDI
Low 6.19 2.10 14.55 2.19 135.21 0.38
(5.11–7.70) (1.82–2.42) (11.99–17.7) (1.83–2.62) (0.29–0.48)
Low-middle 15.89 2.09 44.48 2.99 180.02 1.32
(13.37–19.49) (1.84–2.43) (39.6–50.68) (2.68–3.38) (1.26–1.39)
Middle 28.46 2.18 94.44 3.84 231.89 2.42
(25.4–32.02) (1.99–2.40) (84.78–105.25) (3.46–4.27) (2.26–2.58)
High-middle 41.73 3.83 109.88 5.85 163.30 1.48
(39.17–44.57) (3.59–4.09) (98.18–122.32) (5.24–6.48) (1.35–1.60)
High 98.35 9.71 184.16 9.93 87.25 −0.37
(92.37–104.10) (9.15–10.25) (161.68–206.62) (8.84–11.11) (−0.56 to −0.18)
Regions
East Asia 21.61 2.12 95.93 5.04 343.84 3.57
(18.55–25.57) (1.85–2.46) (81.21–113.06) (4.31–5.89) (3.29–3.86)
South Asia 11.36 1.56 38.92 2.53 242.60 1.68
(9.17–14.82) (1.32–1.88) (32.86–47.02) (2.15–3.01) (1.61–1.74)
Southeast Asia 8.83 2.77 24.13 3.88 173.31 1.11
(7.57–10.28) (2.44–3.17) (20.67–28.16) (3.34–4.49) (1.07–1.16)
Central Asia 1.00 1.73 2.45 2.96 144.32 1.74
(0.87–1.18) (1.54–1.99) (2.12–2.84) (2.58–3.39) (1.55–1.92)
High-income, 12.23 6.30 36.24 8.06 196.31 0.70
Asia Pacific (11.5–12.94) (5.93–6.66) (30.09–42.22) (6.89–9.34) (0.51–0.89)
Oceania 0.06 1.60 0.14 1.71 135.87 0.18
(0.05–0.07) (1.37–1.84) (0.12–0.17) (1.46–2.03) (0.11–0.25)
Australasia 3.01 12.95 5.54 11.31 83.95 −1.12
(2.79–3.24) (12.03–13.91) (4.38–6.87) (8.97–14.07) (−1.39 to −0.85)
Eastern Europe 7.62 3.05 13.38 4.61 75.60 1.77
(7.10–8.23) (2.83–3.31) (11.91–14.96) (4.12–5.13) (1.48–2.07)
Western Europe 48.09 8.95 88.44 10.11 83.88 −0.01
(45.12–50.89) (8.44–9.43) (75.34–101.72) (8.65–11.61) (−0.23–0.22)
Central Europe 5.54 3.99 12.27 6.49 121.54 1.76
(5.18–5.93) (3.73–4.27) (10.74–14.12) (5.71–7.43) (1.55–1.96)
High–income 45.61 13.22 69.46 11.28 52.29 −1.20
North America (42.72–48.3) (12.42–14) (59.74–79.49) (9.74–12.9) (−1.43 to −0.97)
Andean 0.86 3.34 3.59 6.21 318.27 2.41
Latin America (0.76–0.97) (2.99–3.73) (2.91–4.48) (5.03–7.76) (2.24–2.57)
Central 3.23 2.82 10.40 4.32 222.07 1.46
Latin America (3.01–3.5) (2.66–3.02) (8.91–12.17) (3.71–5.05) (1.33–1.59)
Caribbean 1.59 5.39 2.82 5.58 76.95 0.17
(1.47–1.71) (5.02–5.78) (2.37–3.32) (4.69–6.58) (0.02–0.32)
Tropical 3.51 3.04 9.27 3.92 164.46 0.99
Latin America (3.28–3.8) (2.87–3.25) (8.59–9.99) (3.63–4.22) (0.80–1.18)
Southern 2.37 5.02 5.30 6.64 123.35 0.63
Latin America (2.18–2.57) (4.61–5.42) (4.15–6.73) (5.19–8.44) (0.34–0.92)
Eastern Sub- 2.16 2.41 5.41 2.78 150.53 0.58
Saharan Africa (1.74–2.67) (2.08–2.76) (4.49–6.55) (2.37–3.27) (0.49–0.66)
(Continued)
Frontiers in Medicine | www.frontiersin.org 3 September 2021 | Volume 8 | Article 738693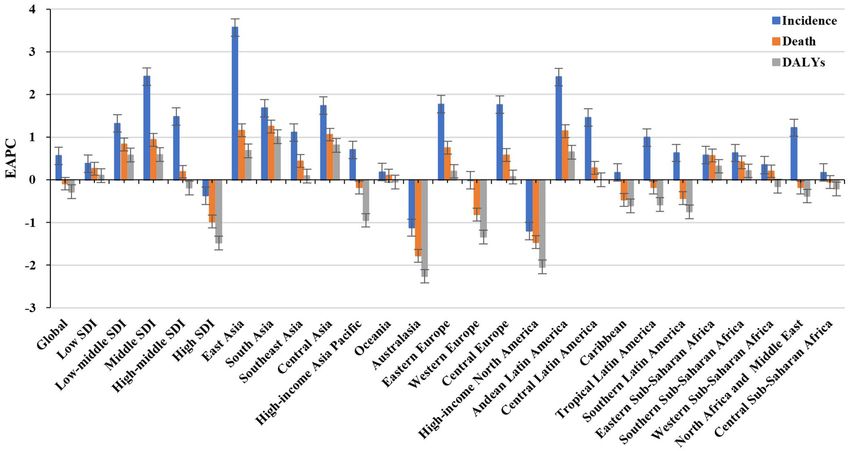
Cai et al.                                                                                                                          Trends Analysis of Non-Hodgkin Lymphoma

TABLE 1 | Continued

                                                   1990                                               2019                                              1990–2019

Characteristics                    Number                  ASR/100,000                Number                   ASR/100,000               Percentage                   EAPC
                                 ×103 (95% UI)               (95% UI)               ×103 (95% UI)                (95% UI)                change (%)                  (95%CI)

Southern Sub-Saharan                   1.09                      3.03                     2.35                      3.58                    115.50                      0.63
Africa                             (0.97–1.21)               (2.69–3.35)              (2.05–2.67)               (3.16–4.02)                                         (0.48–0.78)
Western Sub-                           2.62                      2.00                     6.76                      2.32                    157.65                      0.35
Saharan Africa                     (2.01–3.53)               (1.63–2.44)              (5.11–9.00)               (1.88–2.85)                                         (0.24–0.47)
North Africa and                       7.67                      3.40                    22.61                      4.72                    194.83                      1.22
Middle East                         (6.32–9.3)               (2.87–3.97)             (19.76–25.81)              (4.15–5.38)                                         (1.08–1.36)
Central Sub-                           0.66                      2.26                     1.67                      2.34                    154.33                  0.17
Saharan Africa                     (0.52–0.81)               (1.74–2.82)              (1.18–2.26)               (1.61–3.32)                                     (−0.01–0.35)

EAPC, estimated annual percentage change; ASR, age-standardized rate; CI, confidence interval; UI, uncertainty interval; SDI, sociodemographic index.

  FIGURE 1 | Trends in the incidence, death, and DALYs of non-Hodgkin lymphoma in the globe, SDI areas, and geographic regions from 1990 to 2019. SDI,
  sociodemographic index; DALYs, disability-adjusted life years.

in which the respective EAPCs were 3.57 (95% CI: 3.29–3.86)                                 whereas 28 countries/territories showed decreasing trends, with
and 2.41 (95%CI: 2.24–2.57). Downward trends in ASIR were                                   the lowest EAPCs occurring in Zimbabwe (EAPC = −2, 95% CI:
only seen in high-income North America and Australasia, whose                               −2.31 to −1.69), followed by Kazakhstan and the United States
EAPCs were −1.2 (95% CI: −1.43 to −0.97) and −1.12 (95%                                     of America (Supplementary Table 2, Figures 3A–C).
CI: −1.39 to −0.85), respectively (Table 1, Figures 1, 2B,C). At
the national level, the ASIR in 2019 varied from 0.68/100,000 in                            Trends in Death Caused by NHL
Mali to 14.86/100,000 in Andorra. During the period 1990–2019,                              Over the past 30 years, deaths due to NHL in the world increased
the largest growing percentages of incident number occurred in                              steadily by increased 101.94% and reached up to 254.61 × 10³
Qatar (965.24%) and the United Arab Emirates (782.81%), but                                 (95% UI: 237.71 × 10³ to 270.35 × 10³ ) in 2019. The overall
the lowest one was in Zimbabwe (4.72%). One hundred fifty                                   age-standardized death rate (ASDR) presented a decreasing
countries/territories showed varying degrees of increase in ASIR,                           trend from 1990 to 2019 (EAPC = −0.09, 95% CI: −0.17 to
particularly Georgia and Belarus, in which the respective EAPCs                             −0.02) (Supplementary Table 3, Figure 1). A slight increasing
were 4.7 (95% CI: 4.20–5.21) and 3.96 (95% CI: 3.47–4.44);                                  trend in ASDR was observed in male patients (EAPC = 0.08,

Frontiers in Medicine | www.frontiersin.org                                             4                                          September 2021 | Volume 8 | Article 738693
Cai et al. Trends Analysis of Non-Hodgkin Lymphoma FIGURE 2 | Incident number of non-Hodgkin lymphoma in age groups, SDI areas, and geographic regions from 1990 to 2019. (A) Incident number in age groups; (B) ASIR in SDI areas; (C) incident number in geographical regions. SDI, sociodemographic index; ASIR, age-standardized incidence rate. 95% CI: 0.01– 0.15), while a downward trend was observed with the most significant one occurring in Georgia (EAPC = in female patients (EAPC = −0.34, 95% CI: −0.44 to −0.23) 4.54, 95% CI: 4.01–5.07), followed by Uzbekistan and Belarus. (Supplementary Table 3). Among the age groups, the largest However, decreasing trends appeared in 75 countries/territories, number of deaths was seen in the age group with participants particularly in the Syrian Arab Republic and Bermuda, in which over 80 years old in 2019 (58.77 × 10³ ). From 1990 to 2019, the EAPCs were −2.46 (95% CI: −3.05 to −1.86) and −2.21 the increasing percentages in death were observed in all age (95% CI: −2.46 to −1.96), respectively (Supplementary Table 4, groups of above 15 years, with the most notable one showing Supplementary Figures 3A–C). in the age group of over 80 years (231.1%). However, the percentage declined in patients aged younger than 14 years Trends in DALYs Caused by NHL (Supplementary Table 1, Supplementary Figure 1A). Upward Globally, the DALYs number of NHL has increased by 68.59% trends were observed in most SDI areas, especially the middle since 1990, and it went by up to 6991.3 × 103 (95% UI: SDI areas, with an EAPC of 0.94 (95% CI: 0.84–1.03). However, 6570.14 × 103 to 7450.47 × 103 ) in 2019. The overall ASR of a decreasing tendency only occurred in high SDI areas (EACP = DALYs declined from 1990 to 2019, with an EAPC of −0.28 −0.98, 95% CI: −1.15 to −0.82). Among 21 regions, the highest (95% CI: −0.35 to −0.22). Trends in the ASR of DALYs death number in 2019 occurred in East Asia (46.45 × 10³ ), had a minor increase in male patients but had a decrease in while the lowest one was in Oceania (0.13 × 10³ ). During the female patients (EAPC = −0.34, 95% CI: −0.44 to −0.23) period 1990–2019, the largest increasing percentage was observed (Supplementary Table 5, Figure 1). Among the age groups, the in Andean Latin America (218.58%) and South Asia (210.46%). largest number of DALYs in 2019 was seen in patients aged Increasing trends in ASDR were seen in 12 regions, and the 65–69 years (733.13 × 10³ ). During the period 1990–2019, the most pronounced one was in South Asia (EAPC = 1.25, 95% CI: percentage of DALYs number decreased in age groups younger 1.18–1.32). On the other hand, decreasing trends were observed than 14 years, but decreased in the rest, particularly in the age in eight regions, particularly in Australasia (EAPC = −1.78, group of above 80 years (226.13%) (Supplementary Table 1; 95%CI: −2.01 to −1.56) (Supplementary Table 3, Figure 1, Supplementary Figure 2A). Increasing trends in the ASR Supplementary Figures 1B,C). At the national level, the highest of DALYs were observed in all the SDI areas, except the ASDR in 2019 occurred in San Marino (9.56/100,000), while the high SDI area (EACP = −1.48, 95% CI: −1.65 to −1.31). lowest one occurred in Mali (0.7/100,000). During the period Among 21 geographic regions, the highest DALYs number in 1990–2019, the largest increases in numbers of deaths were in 2019 was seen in East Asia (1362.18 × 103 ), and the lowest the United Arab Emirates (609.26%) and in Qatar (491.98%), one was seen in Oceania (5.08 × 10³ ). During the period but the pronounced decreasing one was in Niue (−2.86%). 1990–2019, the largest increasing percentage was observed in Increasing trends in ASDR occurred in 102 countries/territories, Andean Latin America (138.6%) and South Asia (149.70%). Frontiers in Medicine | www.frontiersin.org 5 September 2021 | Volume 8 | Article 738693
Cai et al.                                                                                                                 Trends Analysis of Non-Hodgkin Lymphoma

  FIGURE 3 | ASIR, percentage changes in the incident number, and EAPCs of non-Hodgkin lymphoma at the national level, 1990–2019. (A) ASIR in 2019; (B)
  percentage changes in incident numbers between 2000 and 2019; (C) distribution of EAPCs presented in countries/territories. Countries/territories with extreme
  values were annotated. ASIR, age-standardized incidence rate; EAPC, estimated annual percentage change.

Frontiers in Medicine | www.frontiersin.org                                        6                                       September 2021 | Volume 8 | Article 738693
Cai et al.                                                                                                              Trends Analysis of Non-Hodgkin Lymphoma

  FIGURE 4 | Correlation between EAPCs and ASR in 1990 at the national level. (A) EAPCs of incidence, (B) death, and (C) DALYs had negative associations with ASR
  in 1990. The association was calculated by a Pearson correlation analysis. The size of the circle is increased with the numbers in 1990. EAPC, estimated annual
  percentage change; ASR, age-standardized rate. DALYs, disability-adjusted life years.

Frontiers in Medicine | www.frontiersin.org                                     7                                      September 2021 | Volume 8 | Article 738693
Cai et al.                                                                                              Trends Analysis of Non-Hodgkin Lymphoma

Increasing trends in the ASR of DALYs were found in 11                      In recent years, the improved survival in NHL has been
regions, especially South Asia and Central Asia, with EAPCs              largely attributed to medical advances, such as the development
of 1.01 (95% CI:0.94 to 1.09) and.81 (95% CI:0.62–1.01),                 and clinical application of effective treatments like rituximab (a
respectively. However, decreasing trends were demonstrated in            monoclonal antibody)(30). However, the heterogeneity in NHL
six regions, particularly in high-income North America (EAPC             burden between regions and countries was deeply influenced
= −2.04, 95%CI: −2.27 to −1.82) (Supplementary Table 5,                  by local economic development, disease prevalence (11), and
Figure 1, Supplementary Figures 2B,C). Among the 204                     local health systems (24). Interestingly, we observed a significant
countries/territories, the ASR of DALYs in 2019 ranged from              increase in the disease burden in some countries of the former
23.53/100,000 in Mali to 409.87/100,000 in Monaco. From                  Soviet Union, where Georgia showed the most pronounced
1990 to 2019, the largest increases in DALYs were in the                 trends in its increases in incidence, death, and DALYs, which
United Arab Emirates (561.34%) and in Qatar (471.66%),                   may reflect the insufficient level of early HIV diagnosis; although
but the pronounced decreasing one was in Mali (−39.28%).                 medical and economic conditions have improved in recent years,
Increasing trends in the ASR of DALYs were observed in 80                more than half of the cases still do not receive timely and effective
countries/territories, and the most pronounced ones were in              treatment (31, 32). The late-stage diagnoses of HIV also occurred
Georgia (EAPC = 4.97, 95% CI: 4.42 to 5.52), followed by                 in Europe, especially in cases of co-morbid NHL, where HIV
Uzbekistan and Lesotho. On the other hand, decreasing trends             detection rates are lower than in other diseases (33). In addition,
were seen in 90 countries/territories, particularly Kazakhstan           the increased morbidity in Belarus may also be related to the
and Malawi, with EAPCs of −2.92 (95%CI: −3.59 to −2.25)                  high prevalence of HIV and the rapid spread of HIV variants in
and −2.71 (95%CI: −2.95 to −2.47) (Supplementary Table 6,                recent years (32). Nevertheless, the explanations still need to be
Supplementary Figures 4A–C), respectively.                               supported by more in-depth studies because of the sparse data
                                                                         in the epidemiological literature on NHL in Eastern Europe and
Analysis on the Influential Factors of EAPC                              Central Asia. However, the incidence of NHL has significantly
For the period 1990–2019, EAPCs had negative relationships               declined in developed countries, such as Australia and the
with the ASR of incidence, death, and DALYs attributable to NHL          United States, because of highly active antiretroviral therapy
(ρ = −0.34, p < 0.01; ρ = −0.44, p < 0.01; ρ = −0.43, p <                (HAART) (34, 35). Meanwhile, we also note an interesting point:
0.01, respectively) (Figures 4A–C). In addition, EAPC was also           the relative risk of HIV-associated NHL in whites is twice that of
negatively correlated with HDI in 2019 in DALYs attributable to          blacks in countries such as the United States, which may be due
NHL (ρ = −0.2, p = 0.005) (Supplementary Figure 5).                      to differences in immune system regulatory genes caused by racial
                                                                         distinguishments (36). It is also certain that the decline in trend
DISCUSSION                                                               in Zimbabwe is also associated with the widespread availability
                                                                         of antiretroviral therapy or possibly with the loss of public health
In this article, increasing trends in the ASIR of NHL were               data (37).
observed worldwide and in most regions and countries from                   Western diet and lifestyle caused by industrial and economic
1990 to 2019, which were due to population growth and                    development might be responsible for the increasing NHL
aging, diagnostic improvements, the AIDS epidemic, and                   burden in East Asia (38–40). However, in contrast to the
environmental pollution such as organic matter and heavy metals          pattern of multiple lymph node disorders in Western countries,
caused by urban industrialization (17–21). The significantly             Asian countries exhibit intermediate-grade to high-grade diffuse
increasing burden was observed in old patients with NHL, and             aggressive lymphomas, peripheral T-cell NHL, and extra-lymph
was probably related with age, which is a strong negative factor         node disease more often (41). The poor medical source,
in all lymphoma subtypes (22–24). In part, it is also affected           misdiagnosis and omission by lacking high quality pathological
by various co-morbidities (17), such as cancer, cardiovascular           diagnosis of NHL, and the heavy burden of chemotherapy
disease, and stroke (6). The decline in mortality and DALYs for          drugs on the masses had brought the worse prognosis of NHL
children aged below 14 years compared with adults may be due to          patients in South Asia (18, 42). In Central Asia, the situation
biological differences across the age groups. For example, in the        of death, DALYs, and the burden of NHL is far more severe
case of diffuse large B-cell lymphoma (DLBCL) and anaplastic             in Uzbekistan than in Kazakhstan, probably because of the fact
large cell lymphoma (ALCL), pediatric patients are more likely           that HIV genotyping studies have been conducted for a long
to have GCB disease (a main subtype of DLBCL) and anaplastic             time in Kazakhstan, while they were just beginning in Uzbekistan
lymphoma kinase (+) ALCL (ALK+ ALCL), both of which have                 (32). In contrast, in South Africa, excluding major changes in
superior prognostic features of NHL (25–27). Thus, comparing             society and the lifestyles of the people, scholars hypothesized
pathogenesis patterns by NHL subtypes may provide key clues              that the development of NHL was delayed because of the
for future etiologic investigations (28). Meanwhile, the lower           receipt of various anti-infective treatments (43–46). Researchers
burden of NHL in female patients was similar to the previous             have applied a low-intensity EPOCH (etoposide, prednisolone,
epidemiological studies, in which 5- and 10-year survival was            vincristine, cyclophosphamide, doxorubicin) infusion regimen
demonstrated to be generally higher in women (3, 29). However,           in sub-Saharan Africa, which may have contributed to the
the difference in survival is independent of race, ethnicity, year       decline in DALYs in Malawi because the infusion regimen is
of diagnosis, or NHL subtypes (24), and this may be caused by            a treatment that can improve outcomes for adolescents and
different lifestyles between sexes or hormonal influences (22).          adults with Burkitt lymphoma (BL) in Malawi and reduce drug

Frontiers in Medicine | www.frontiersin.org                          8                                  September 2021 | Volume 8 | Article 738693
Cai et al. Trends Analysis of Non-Hodgkin Lymphoma
toxicity reactions (47). There were several limitations in this DATA AVAILABILITY STATEMENT
study. First, the quality and quantity of data sources determined
the accuracy and reliability of GBDs estimates; thus, potential The original contributions presented in the study are included
bias probably derived from unreported cases, incomplete testing, in the article/Supplementary Material, further inquiries can be
miscoding, and misclassification, which were described in detail directed to the corresponding author/s.
in the previous GBDs articles (12–14). Second, the diagnosis and
classifications of NHL had been revised differently in various AUTHOR CONTRIBUTIONS
countries over time, and this has had a significant impact on data
estimation, which was an important limitation. Third, the basis WC: project administration and drafting. QZ: data analysis and
of estimating data for most middle- and low-income countries is validation. XZ: data analysis and visualization. WR: supervision,
largely derived from high-income countries with strong cancer drafting, and editing. All the authors contributed to the article
registration systems, which still introduces some uncertainty in and approved the submitted version.
the veracity of the data due to the heterogeneity across countries.
Last but not least, despite the use of tools to correct data, it is FUNDING
impossible for GBDs to fully control biases in data collection,
entry, and veracity (14, 48). This study was supported by the Science and Technology
Planning Project of Guangdong Province of China (Grant Nos:
2015A070707005 and 2020A1414040014).
CONCLUSIONS
In the past three decades, slow decreasing trends in the deaths ACKNOWLEDGMENTS
and DALYs of NHL were observed worldwide. Meanwhile,
increasing incident trends in NHL highlighted that NHL burden Thanks to the Institute for Health Metrics and Evaluation
remained a substantial challenge. Furthermore, the impact of (IHME) and the Global Burden of Disease study collaborations.
NHL varies widely worldwide and is the result of a combination
of factors, such as environmental and genetic, so performing SUPPLEMENTARY MATERIAL
more systematic comparative analyses of NHL by geographic
region is warranted (36, 49). The findings also indicated that The Supplementary Material for this article can be found
more effective strategies should be established to improve the online at: https://www.frontiersin.org/articles/10.3389/fmed.
management and treatment of patients with NHL. 2021.738693/full#supplementary-material
REFERENCES 9. Hartge P, Devesa SS. Quantification of the impact of known risk factors
on time trends in non-Hodgkin’s lymphoma incidence. Cancer Res. (1992)
1. Darbà J, Marsà A. Burden of Hodgkin and non-Hodgkin lymphoma 52(19 Suppl.):5566s−9s.
in Spain over a 10-year period: productivity losses due to 10. Bowzyk AA, Ajithkumar T, Behan S, Hodson DJ. Non-Hodgkin lymphoma.
premature mortality. Expert Rev Pharmacoecon Outcomes Res. (2020) BMJ. (2018) 362:k3204. doi: 10.1136/bmj.k3204
21:87–92. doi: 10.1080/14737167.2020.1769478 11. Perry AM, Diebold J, Nathwani BN, MacLennan KA, Müller-
2. Shankland KR, Armitage JO, Hancock BW. Non-Hodgkin lymphoma. Lancet. Hermelink HK, Bast M, et al. Non-Hodgkin lymphoma in the
(2012) 380:848–57. doi: 10.1016/S0140-6736(12)60605-9 developing world: review of 4539 cases from the International Non-
3. Bray F, Ferlay J, Soerjomataram I, Siegel RL, Torre LA, Jemal A. Global Hodgkin Lymphoma Classification Project. Haematologica. (2016)
cancer statistics 2018: GLOBOCAN estimates of incidence and mortality 101:1244–50. doi: 10.3324/haematol.2016.148809
worldwide for 36 cancers in 185 countries. CA Cancer J Clin. (2018) 68:394– 12. Fitzmaurice C, Abate D, Abbasi N, Abbastabar H, Abd-Allah F, Abdel-
424. doi: 10.3322/caac.21492 Rahman O, et al. Global, regional, and national cancer incidence, mortality,
4. Pratap S, Scordino TS. Molecular and cellular genetics of non-Hodgkin years of life lost, years lived with disability, and disability-adjusted
lymphoma: diagnostic and prognostic implications. Exp Mol Pathol. (2019) life-years for 29 cancer groups, 1990 to 2017: a systematic analysis
106:44–51. doi: 10.1016/j.yexmp.2018.11.008 for the global burden of disease Study. JAMA Oncol. (2019) 5:1749–
5. UK. CR. Non-Hodgkin lYmphoma (NHL) Statistics Key Facts. Available online 68. doi: 10.1001/jamaoncol.2019.2996
at: https://www.cancerresearchuk.org/health-professional/cancer-statistics/ 13. Fitzmaurice C, Allen C, Barber RM, Barregard L, Bhutta ZA, Brenner H,
statistics-by-cancer-type/non-hodgkin-lymphoma#heading-Two (accessed et al. Global, regional, and national cancer incidence, mortality, years of life
Feb27, 2018). lost, years lived with disability, and disability-adjusted life-years for 32 cancer
6. Simard JF, Baecklund F, Chang ET, Baecklund E, Hjalgrim H, Olov AH, groups, 1990 to 2015: a systematic analysis for the global burden of disease
et al. Lifestyle factors, autoimmune disease and family history in prognosis of study. JAMA Oncol. (2017) 3:524–48. doi: 10.1001/jamaoncol.2016.5688
non-hodgkin lymphoma overall and subtypes. Int J Cancer. (2013) 132:2659– 14. Global, regional, and national age-sex specific all-cause and cause-specific
66. doi: 10.1002/ijc.27944 mortality for 240 causes of death, 1990–2013: a systematic analysis
7. Alexander DD, Mink PJ, Adami HO, Chang ET, Cole P, Mandel JS, et al. for the Global Burden of Disease Study 2013. Lancet. (2015) 385:117–
The non-Hodgkin lymphomas: a review of the epidemiologic literature. Int 71. doi: 10.1016/S0140-6736(14)61682-2
J Cancer. (2007) 120(Suppl. 12):1–39. doi: 10.1002/ijc.22719 15. Ou Z, Yu D, Liang Y, He W, Li Y, Zhang M, et al. Analysis of the Global
8. Dal Maso L, Franceschi S. Epidemiology of non-Hodgkin lymphomas and Burden of Disease study highlights the trends in death and disability-adjusted
other haemolymphopoietic neoplasms in people with AIDS. Lancet Oncol. life years of leukemia from 1990 to 2017. Cancer Commun. (2020) 40:598–
(2003) 4:110–9. doi: 10.1016/S1470-2045(03)00983-5 610. doi: 10.1002/cac2.12094
Frontiers in Medicine | www.frontiersin.org 9 September 2021 | Volume 8 | Article 738693Cai et al. Trends Analysis of Non-Hodgkin Lymphoma
16. Gao S, Yang WS, Bray F, Va P, Zhang W, Gao J, et al. Declining rates of 36. Skrabek P, Turner D, Seftel M. Epidemiology of non-Hodgkin lymphoma.
hepatocellular carcinoma in urban Shanghai: incidence trends in 1976–2005. Transfus Apher Sci. (2013) 49:133–8. doi: 10.1016/j.transci.2013.07.014
Eur J Epidemiol. (2012) 27:39–46. doi: 10.1007/s10654-011-9636-8 37. Chokunonga E, Borok MZ, Chirenje ZM, Nyakabau AM, Parkin DM. Trends
17. Hester LL, Park SI, Wood WA, Stürmer T, Brookhart MA, Lund JL. Cause- in the incidence of cancer in the black population of Harare, Zimbabwe
specific mortality among Medicare beneficiaries with newly diagnosed non- 1991–2010. Int J Cancer. (2013) 133:721–9. doi: 10.1002/ijc.28063
Hodgkin lymphoma subtypes. Cancer-Am Cancer Soc. (2019) 125:1101– 38. Chihara D, Ito H, Matsuda T, Shibata A, Katsumi A, Nakamura S,
12. doi: 10.1002/cncr.31821 et al. Differences in incidence and trends of haematological malignancies
18. Nair R, Arora N, Mallath MK. Epidemiology of Non-Hodgkin’s Lymphoma in in Japan and the United States. Br J Haematol. (2014) 164:536–
India. Oncology. (2016) 91(Suppl. 1):18–25. doi: 10.1159/000447577 45. doi: 10.1111/bjh.12659
19. Ortega-García JA, López-Hernández FA, Cárceles-Álvarez A, Fuster-Soler 39. Lee H, Park HJ, Park EH, Ju HY, Oh CM, Kong HJ, et al. Nationwide
JL, Sotomayor DI, Ramis R. Childhood cancer in small geographical areas statistical analysis of lymphoid malignancies in Korea. Cancer Res Treat.
and proximity to air-polluting industries. Environ Res. (2017) 156:63– (2018) 50:222–38. doi: 10.4143/crt.2017.093
73. doi: 10.1016/j.envres.2017.03.009 40. Liu W, Liu J, Song Y, Zeng X, Wang X, Mi L, et al. Burden of lymphoma in
20. Núñez O, Fernández-Navarro P, Martín-Méndez I, Bel-Lan A, China, 2006–2016: an analysis of the Global Burden of Disease Study 2016. J
Locutura JF, López-Abente G. Arsenic and chromium topsoil levels Hematol Oncol. (2019) 12:115. doi: 10.1186/s13045-019-0785-7
and cancer mortality in Spain. Environ Sci Pollut Res Int. (2016) 41. Müller AM, Ihorst G, Mertelsmann R, Engelhardt M. Epidemiology of non-
23:17664–75. doi: 10.1007/s11356-016-6806-y Hodgkin’s lymphoma (NHL): trends, geographic distribution, and etiology.
21. Maifredi G, Donato F, Magoni M, Orizio G, Gelatti U, Maiolino Ann Hematol. (2005) 84:1–12. doi: 10.1007/s00277-004-0939-7
P, et al. Polychlorinated biphenyls and non-Hodgkin’s lymphoma: a 42. Montgomery ND, Liomba NG, Kampani C, Krysiak R, Stanley CC,
case-control study in Northern Italy. Environ Res. (2011) 111:254– Tomoka T, et al. Accurate real-time diagnosis of lymphoproliferative
9. doi: 10.1016/j.envres.2010.12.006 disorders in Malawi through clinicopathologic teleconferences: a model for
22. Pfreundschuh M. Age and Sex in Non-hodgkin lymphoma therapy: it’s not pathology services in Sub-Saharan Africa. Am J Clin Pathol. (2016) 146:423–
all created equal, or is it? Am Soc Clin Oncol Educ Book. (2017) 37:505– 30. doi: 10.1093/ajcp/aqw118
11. doi: 10.14694/EDBK_175447 43. Buabeng KO, Duwiejua M, Dodoo AN, Matowe LK, Enlund H. Self-reported
23. Sandlund JT, Martin MG. Non-Hodgkin lymphoma across the pediatric and use of anti-malarial drugs and health facility management of malaria in
adolescent and young adult age spectrum. Hematology Am Soc Hematol Educ Ghana. Malar J. (2007) 6:85. doi: 10.1186/1475-2875-6-85
Program. (2016) 2016:589–97. doi: 10.1182/asheducation-2016.1.589 44. Maclean KH, Dorsey FC, Cleveland JL, Kastan MB. Targeting
24. Crozier JA, Sher T, Yang D, Swaika A, Foran J, Ghosh R, et al. persistent lysosomal degradation induces p53-dependent cell death and prevents
disparities among patients with t-cell non-hodgkin lymphomas and b-cell cancer in mouse models of lymphomagenesis. J Clin Invest. (2008)
diffuse large cell lymphomas over 40 years: a SEER database review. Clin 118:79–88. doi: 10.1172/JCI33700
Lymphoma Myeloma Leuk. (2015) 15:578–85. doi: 10.1016/j.clml.2015.06.005 45. Mbulaiteye SM, Bhatia K, Adebamowo C, Sasco AJ. HIV
25. Wood WA, Lee SJ. Malignant hematologic diseases in adolescents and young and cancer in Africa: mutual collaboration between HIV and
adults. Blood. (2011) 117:5803–15. doi: 10.1182/blood-2010-12-283093 cancer programs may provide timely research and public health
26. Savage KJ, Harris NL, Vose JM, Ullrich F, Jaffe ES, Connors data. Infect Agent Cancer. (2011) 6:16. doi: 10.1186/1750-9378-
JM, et al. ALK- anaplastic large-cell lymphoma is clinically and 6-16
immunophenotypically different from both ALK+ ALCL and 46. Morgan D, Mahe C, Mayanja B, Whitworth JA. Progression to symptomatic
peripheral T-cell lymphoma, not otherwise specified: report from disease in people infected with HIV-1 in rural Uganda: prospective
the International Peripheral T-Cell Lymphoma Project. Blood. (2008) cohort study. BMJ. (2002) 324:193–6. doi: 10.1136/bmj.324.7331.
111:5496–504. doi: 10.1182/blood-2008-01-134270 193
27. Gascoyne RD, Aoun P, Wu D, Chhanabhai M, Skinnider BF, Greiner TC, 47. Zuze T, Ellis GK, Kasonkanji E, Kaimila B, Nyasosela R, Nyirenda R, et al.
et al. Prognostic significance of anaplastic lymphoma kinase (ALK) protein Modified EPOCH for high-risk non-Hodgkin lymphoma in sub-Saharan
expression in adults with anaplastic large cell lymphoma. Blood. (1999) Africa. Cancer Med. (2020) 9:77–83. doi: 10.1002/cam4.2631
93:3913–21. doi: 10.1182/blood.V93.11.3913 48. Mikkelsen L, Phillips DE, AbouZahr C, Setel PW, de Savigny D, Lozano
28. Morton LM, Wang SS, Devesa SS, Hartge P, Weisenburger DD, Linet MS. R, et al. A global assessment of civil registration and vital statistics
Lymphoma incidence patterns by WHO subtype in the United States, 1992– systems: monitoring data quality and progress. Lancet. (2015) 386:1395–
2001. Blood. (2006) 107:265–76. doi: 10.1182/blood-2005-06-2508 406. doi: 10.1016/S0140-6736(15)60171-4
29. Monnereau A, Troussard X, Belot A, Guizard AV, Woronoff AS, Bara S, et al. 49. Fetica B, Achimas-Cadariu P, Pop B, Dima D, Petrov L, Perry AM, et al. Non-
Unbiased estimates of long-term net survival of hematological malignancy Hodgkin lymphoma in Romania: a single-centre experience. Hematol Oncol.
patients detailed by major subtypes in France. Int J Cancer. (2013) 132:2378– (2017) 35:198–205. doi: 10.1002/hon.2266
87. doi: 10.1002/ijc.27889
30. Harrison AM, Thalji NM, Greenberg AJ, Tapia CJ, Windebank AJ. Rituximab Conflict of Interest: The authors declare that the research was conducted in the
for non-Hodgkin’s lymphoma: a story of rapid success in translation. Clin absence of any commercial or financial relationships that could be construed as a
Transl Sci. (2014) 7:82–6. doi: 10.1111/cts.12111 potential conflict of interest.
31. Chkhartishvili N, Chokoshvili O, Bolokadze N, Tsintsadze M, Sharvadze L,
Gabunia P, et al. Late presentation of HIV infection in the country of Georgia: Publisher’s Note: All claims expressed in this article are solely those of the authors
2012–2015. PLoS ONE. (2017) 12:e186835. doi: 10.1371/journal.pone.0186835 and do not necessarily represent those of their affiliated organizations, or those of
32. Bobkova M. Current status of HIV-1 diversity and drug resistance monitoring
the publisher, the editors and the reviewers. Any product that may be evaluated in
in the former USSR. Aids Rev. (2013) 15:204–12.
this article, or claim that may be made by its manufacturer, is not guaranteed or
33. Raben D, Mocroft A, Rayment M, Mitsura VM, Hadziosmanovic V, Sthoeger
ZM, et al. Auditing HIV testing rates across europe: results from the HIDES 2 endorsed by the publisher.
study. PLoS ONE. (2015) 10:e140845. doi: 10.1371/journal.pone.0140845
34. van Leeuwen MT, Vajdic CM, Middleton MG, McDonald AM, Law M, Copyright © 2021 Cai, Zeng, Zhang and Ruan. This is an open-access article
Kaldor JM, et al. Continuing declines in some but not all HIV-associated distributed under the terms of the Creative Commons Attribution License (CC BY).
cancers in Australia after widespread use of antiretroviral therapy. Aids. (2009) The use, distribution or reproduction in other forums is permitted, provided the
23:2183–90. doi: 10.1097/QAD.0b013e328331d384 original author(s) and the copyright owner(s) are credited and that the original
35. Engels EA, Pfeiffer RM, Goedert JJ, Virgo P, McNeel TS, Scoppa SM, et al. publication in this journal is cited, in accordance with accepted academic practice.
Trends in cancer risk among people with AIDS in the United States 1980– No use, distribution or reproduction is permitted which does not comply with these
2002. Aids. (2006) 20:1645–54. doi: 10.1097/01.aids.0000238411.75324.59 terms.
Frontiers in Medicine | www.frontiersin.org 10 September 2021 | Volume 8 | Article 738693You can also read