TRAFFIC IMPACT STUDY - City of Summit
←
→
Page content transcription
If your browser does not render page correctly, please read the page content below
TRAFFIC IMPACT STUDY
                                       PROPOSED CHILD DAY CARE

Proposed Child Day Care
480 & 490 Morris Avenue
Block 505, Lots 1 & 2
City of Summit, Union
County, New Jersey

Prepared For: Primrose
Schools

September 11, 2020
Revised: December 10, 2020
SE&D Job No. T-19313

John R. Corak, PE
Project Manager
NJ P.E. License #54973

Matthew J. Seckler PE, PP, PTOE
Principal
NJ P.E. License #48731

                                         STONEFIELD
                                  92 Park Avenue, Rutherford, NJ 07070
S T O N E F I E L D E N G I N E E R I N G & D E S I G N , LLC                                                                PROPOSED PRIMROSE SCHOOL
                                                                                                             CITY OF SUMMIT, UNION COUNTY, NEW JERSEY

                                                                  TABLE OF CONTENTS

EXECUTIVE SUMMARY.............................................................................................................. 1

INTRODUCTION ......................................................................................................................... 2

METHODOLOGY ......................................................................................................................... 2

2020 EXISTING CONDITION .................................................................................................... 3
              2020 Existing Roadway Conditions ............................................................................................................... 3
              2020 Existing Traffic Volumes ......................................................................................................................... 4
              2020 Existing LOS/Capacity Analysis............................................................................................................. 5

2022 NO-BUILD CONDITION ................................................................................................... 5
              Background Growth .......................................................................................................................................... 5
              Other Planned Development Projects .......................................................................................................... 5
              2022 No-Build Traffic Volumes ...................................................................................................................... 6
              2022 No-Build LOS/Capacity Analysis .......................................................................................................... 6

2022 BUILD CONDITION ........................................................................................................... 6
              Trip Generation.................................................................................................................................................. 6
              Trip Assignment/Distribution.......................................................................................................................... 7
              2022 Build Traffic Volumes .............................................................................................................................. 7
              2022 Build LOS/Capacity Analysis ................................................................................................................. 7
              Comparative Level of Service (Delay) Tables ............................................................................................. 8
              Vehicle Gap Acceptance ................................................................................................................................... 9

SITE CIRCULATION/PARKING SUPPLY ................................................................................. 9

CONCLUSIONS ......................................................................................................................... 12

                                                                                           i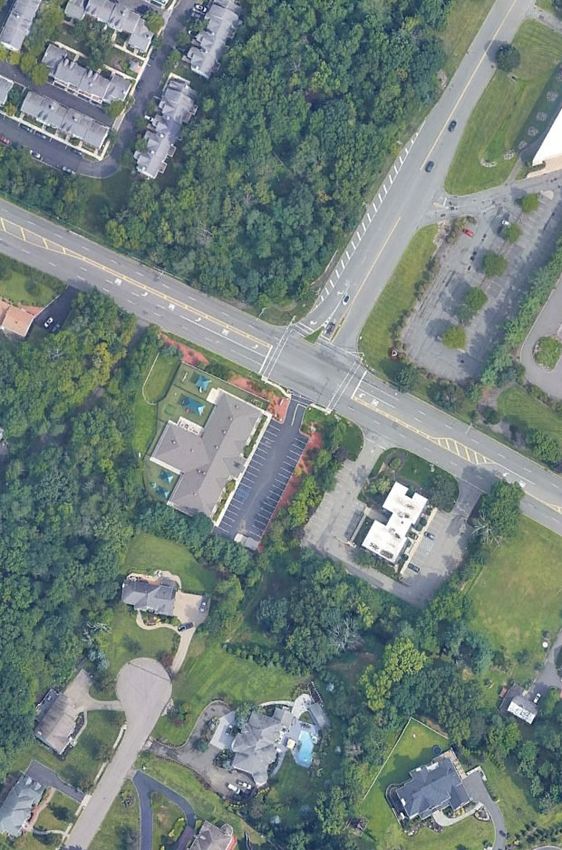
S T O N E F I E L D E N G I N E E R I N G & D E S I G N , LLC                                   PROPOSED PRIMROSE SCHOOL
                                                                                CITY OF SUMMIT, UNION COUNTY, NEW JERSEY

                                                                TECHNICAL APPENDIX

LEVEL OF SERVICE/AVERAGE CONTROL DELAY CRITERIA

TURNING MOVEMENT COUNT DATA
Morris Avenue and Gates Avenue

NJDOT COUNT DATA
Morris Avenue between Gates Avenue and Beverly Road

FIGURES
Figure 1 – Site Location Map
Figure 2 – 2020 As-Counted Traffic Volumes
Figure 3 – 2020 Existing Adjusted Traffic Volumes
Figure 4 – 2022 Base Traffic Volumes
Figure 5 – Other Planned Projects Future Traffic Volumes
Figure 6 – 2022 No-Build Traffic Volumes
Figure 7 – “New” Primrose-Generated Parent Traffic Volumes
Figure 8 – “New” Primrose-Generated Staff Traffic Volumes
Figure 9 – 2022 Build Traffic Volumes

GAP ACCEPTANCE ANALYSIS

HIGHWAY CAPACITY ANALYSIS DETAIL SHEETS
2020 Existing Traffic Conditions
2022 No-Build Traffic Conditions
2022 Build Traffic Conditions

SHARED PARKING ANALYSIS

SITE COMPARISONS

                                                                         ii
S T O N E F I E L D E N G I N E E R I N G & D E S I G N , LLC                            PROPOSED PRIMROSE SCHOOL
                                                                         CITY OF SUMMIT, UNION COUNTY, NEW JERSEY

EXECUTIVE SUMMARY

     The revised Traffic Impact Study was prepared to update the September 11, 2020 issuance of the Traffic
Impact Study based on discussions with the Planning Board. The following is a summary of the revisions:

      1. The office component of the development is no longer proposed. Accordingly, the site’s overall trip
             generation projections have decreased from 166 total trips during the critical weekday morning peak
             hour to 159 total trips during the weekday morning peak hour.
      2. This application previously sought a parking variance of eleven (11) parking spaces from the City’s
             parking requirement. Without the office component, this application now complies with the parking
             requirement. 31 spaces are required, and 39 spaces are proposed.
      3. The student drop-off and pick-up transaction time was increased to 10 minutes. This transaction time
             was utilized in recalculating the Poisson distribution to determine the 95th Percentile likelihood of
             simultaneous drop-offs and pick-ups. The maximum number of simultaneous drop-offs/pick-ups was
             determined to be 18 parent-vehicles during the morning peak hour.
      4. The overall projected maximum parking demand has decreased from 39 parked vehicles to 32 parked
             vehicles.
      5. Traffic Counts were performed on December 2, 2020 and adjusted based on NJDOT data that was
             collected pre-COVID and before construction began on the Morris Avenue railroad overpass between
             Kent Place Boulevard and Springfield Avenue. A gap acceptance study was prepared based on field
             measured values. The gap acceptance study was utilized to calibrate and model the typical vehicle
             behavior of drivers on this specific roadway network during pre-COVID periods.
      6. A Level of Service/Volume Capacity Analysis was conducted at the intersection of Morris Avenue and
             Gates Avenue. Based on the analyses conducted, the proposed Primrose School would not have a
             significant impact to the Level of Service on the adjacent roadways.
      7. A comparison of parking supply at operating Primrose sites of similar licensed capacity on standalone
             lots with no nearby on-street parking has been included.

                                                                1
S T O N E F I E L D E N G I N E E R I N G & D E S I G N , LLC PROPOSED PRIMROSE SCHOOL
CITY OF SUMMIT, UNION COUNTY, NEW JERSEY
INTRODUCTION
This Traffic Impact Study was prepared to investigate the traffic and parking characteristics of the proposed
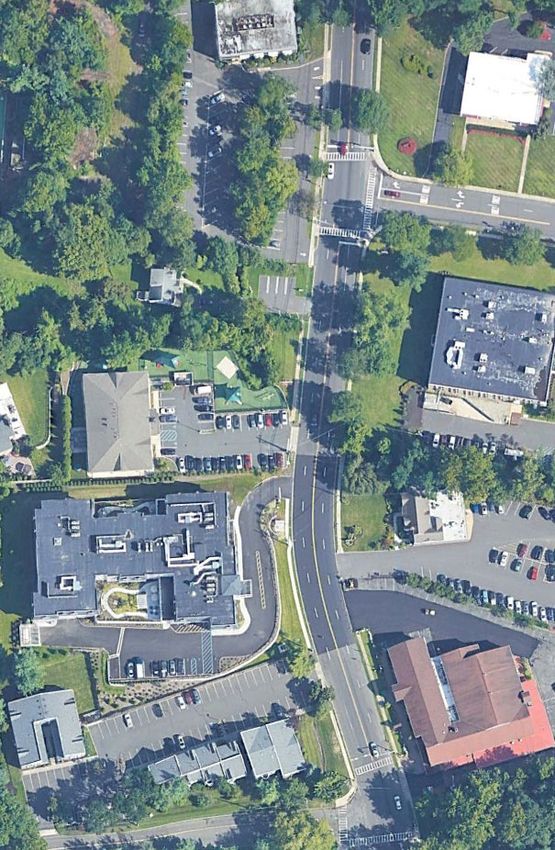
Primrose School on the adjacent roadway network. The subject property is located along Morris Avenue
between Gates Avenue and Webster Avenue in the City of Summit, Union County, New Jersey. The site
location is shown on appended Figure 1.
The subject property is designated as Block 505, Lots 1 and 2 as depicted on the City of Summit Tax Map.
The site has approximately 249 feet of frontage along Morris Avenue, approximately 170 feet of frontage along
Webster Avenue, and approximately 35 feet of frontage along Gate Avenue. The existing site contains two (2)
buildings, previously occupied by an office building and a furniture store. The existing access to Lot 1 is provided
via two (2) full-movement driveways along Webster Avenue, and the existing access to Lot 2 is provided via
one (1) ingress-only driveway along Morris Avenue and one egress-only driveway along Gates Avenue. Under
the proposed development program, the existing buildings would be renovated and redeveloped with a 14,970-
square-foot child day care facility to be operated by the Primrose School. Access is proposed via the existing
ingress-only driveway along Morris Avenue and the egress-only driveway along Gates Avenue. The two (2)
existing access points along Webster Avenue would be closed.
METHODOLOGY
Stonefield Engineering & Design, LLC has prepared this Traffic Impact Study in accordance with the
recommended guidelines and practices outlined by the Institute of Transportation Engineers (ITE) within
Transportation Impact Analyses for Site Development. A detailed field investigation was performed to assess
the existing conditions of the adjacent roadway network. A data review was completed to identify the existing
traffic volumes at the study intersections to serve as a base for the traffic analyses. Capacity analysis, a
procedure used to estimate the traffic-carrying ability of roadway facilities over a range of defined operating
conditions, was performed using the Highway Capacity Manual, 6th Edition (HCM) and the Highway Capacity
Software (HCS7) for all study conditions to assess the roadway operations.
For an unsignalized intersection, Level of Service (LOS) A indicates operations with delay of less than 10
seconds per vehicle, while LOS F describes operations with delay in excess of 50 seconds per vehicle. For a
signalized intersection, LOS A indicates operations with delay of less than 10 seconds per vehicle, while LOS F
describes operations with delay in excess of 80 seconds per vehicle. The Technical Appendix contains the
Highway Capacity Analysis Detail Sheets for the study intersections analyzed in this assessment.
2S T O N E F I E L D E N G I N E E R I N G & D E S I G N , LLC PROPOSED PRIMROSE SCHOOL
CITY OF SUMMIT, UNION COUNTY, NEW JERSEY
2020 EXISTING CONDITION
2020 EXISTING ROADWAY CONDITIONS
The proposed Primrose School is located along Morris Avenue between Gates Avenue and Webster
Avenue in the City of Summit, Union County, New Jersey. The subject property is designated as Block 505,
Lots 1 and 2 as depicted on the City of Summit Tax Map. The site has approximately 249 feet of frontage along
Morris Avenue, approximately 170 feet of frontage along Webster Avenue, and approximately 35 feet of
frontage along Gate Avenue. Land uses in the area are a mix of commercial, educational, and residential.
Morris Avenue (CR 651) is classified as an Urban Minor Arterial roadway with a general north-south
orientation and is under the jurisdiction of Union County. Along the site frontage, the roadway provides one
(1) lane of travel in each direction and has a posted speed limit of 35 mph, with a 25-mph restriction when
children are present. Curb and sidewalk are provided along both sides of the roadway, shoulders are not
provided along either side of the roadway, and on-street parking is periodically permitted along both sides of
the roadway. Morris Avenue provides north-south mobility within Summit, from Springfield Avenue (CR 512)
at its southern terminus to River Road (CR 649) at its northern terminus, for a mix of commercial, educational,
and residential uses along its length.
Webster Avenue is a local roadway with a general east-west orientation and is under the jurisdiction of
the City of Summit. Along the site frontage, the roadway provides one (1) lane of travel in each direction and
does not have a posted speed limit. Curb is provided along both sides of the roadway, sidewalk and shoulders
are not provided along either side of the roadway, and on-street parking is permitted along both sides of the
roadway with two (2) hour restrictions in effect from 8:00 a.m. to 6:00 p.m. Webster Avenue provides north-
south mobility within Summit for predominately residential uses along its length.
Gates Avenue is a local roadway with a general east-west orientation and is under the jurisdiction of the
City of Summit. Along the site frontage, the roadway provides one (1) lane of travel in each direction and does
not have a posted speed limit. Curb is provided along both sides of the roadway, sidewalk and shoulders are
not provided along either side of the roadway, and on-street parking is permitted along both sides of the
roadway with two (2) hour restrictions in effect from 8:00 a.m. to 4:00 p.m. along the westerly side of the
roadway and a no parking restriction is in effect from 8:00 a.m. to 4:00 p.m. along the easterly side of the
roadway. Gates Avenue provides east-west mobility within Summit for predominately residential uses along its
length.
Morris Avenue and Webster Avenue intersect to form an unsignalized T-intersection with the eastbound
approach of Webster Avenue operating under stop control. The northbound approach of Morris Avenue
3S T O N E F I E L D E N G I N E E R I N G & D E S I G N , LLC PROPOSED PRIMROSE SCHOOL
CITY OF SUMMIT, UNION COUNTY, NEW JERSEY
provides one (1) shared left-turn/through lane and the southbound approach of Morris Avenue provides one
(1) shared through/right-turn lane. The northbound approach of Webster Avenue provides one (1) shared left-
turn/right-turn lane. A crosswalk is provided across the westerly leg of the intersection.
Morris Avenue and Gates Avenue intersect to form an unsignalized T-intersection with the eastbound
approach of Gates Avenue operating under stop control. The northbound approach of Morris Avenue provides
one (1) shared left-turn/through lane and the southbound approach of Morris Avenue provides one (1) shared
through/right-turn lane. The northbound approach of Gates Avenue provides one (1) shared left-turn/right-
turn lane. A crosswalk is provided across the westerly leg of the intersection.
Along the site frontage of the proposed development is a bus stops that services NJ Transit Bus Route 70,
which provides service to Newark, and various points of interest throughout Essex, Union, and Morris
Counties.
2020 EXISTING TRAFFIC VOLUMES
Manual turning movement counts were collected during the typical weekday morning and evening time
periods to evaluate existing traffic conditions and identify the specific hours when traffic activity on the adjacent
roadways is at a maximum and could be potentially impacted by the development of the site. Turning movement
counts were collected at the intersection of Morris Avenue and Gates Avenue. Specifically, manual turning
movement counts were conducted on Wednesday, December 2, 2020 from 6:30 a.m. to 9:00 a.m. and from
3:30 p.m. to 6:30 p.m. Based on the review of the count data the weekday morning peak hour occurred from
7:45 a.m. to 8:45 a.m. and the weekday evening peak hour occurred from 4:00 p.m. to 5:00 p.m. As explained
herein, the proposed Primrose School is expected to experience its peak trip generation from 7:45 a.m. to
8:45 a.m. and from 5:15 p.m. to 6:15 p.m. Therefore, the peak hours of proposed activity have been analyzed
to provide an understanding of the proposed Primrose School’s impact on traffic along the nearby roadways.
The 2020 As-Counted Traffic Volumes are summarized on appended Figure 2.
Due to the ongoing COVID-19 pandemic, traffic volumes and traffic patterns have been impacted relative
to pre-COVID conditions. Therefore, Stonefield reviewed publicly available traffic data in the site vicinity. The
following sources were reviewed:
1. New Jersey Department of Transportation Daily Volume from 04/24/2017 through 04/26/2017
along Morris Avenue between Gates Avenue and Beverly Road
2. New Jersey Department of Transportation Daily Volume from 12/13/2011 through 12/15/2011
along Morris Avenue between Gates Avenue and Beverly Road
4S T O N E F I E L D E N G I N E E R I N G & D E S I G N , LLC PROPOSED PRIMROSE SCHOOL
CITY OF SUMMIT, UNION COUNTY, NEW JERSEY
3. Turning Movement Count conducted in November 2017 at the intersection of Morris Avenue and
the Celgene Driveway
Please note that the Morris Avenue railroad overpass between Kent Place Boulevard and Springfield
Avenue was under construction from 2015 to 2017. Therefore, the NJDOT data from 2011 was considered
the data that is most reflective of typical traffic conditions. The 2011 Morris Avenue traffic volumes were then
increased by 0.60% annually for nine (9) years. The growth rate was obtained from the North Jersey
Transportation Planning Authority (NJTPA) Plan 2045 Demographic Forecast growth table. The 2020 As-
counted traffic volumes were subsequently balanced with the grown NJDOT volume data. The 2020 Existing
Adjusted Traffic Volumes are summarized on appended Figure 3.
2020 EXISTING LOS/CAPACITY ANALYSIS
A Level of Service and Volume/Capacity analysis was conducted for the 2020 Existing Condition during the
study peak hours at the intersection of Morris Avenue and Gates Avenue. Under the existing condition, turning
movements at the unsignalized intersection are calculated to operate at Level of Service D or better.
2022 NO-BUILD CONDITION
BACKGROUND GROWTH
The 2020 Existing Condition traffic volume data was grown to a future horizon year of 2022, which is a
conservative estimate for when the proposed Primrose School is expected to be fully constructed. In
accordance with industry guidelines, the existing traffic volumes at the study intersections were increased by
1.00% annually for two (2) years. These volumes are summarized on appended Figure 4. The 1.00%
background growth rate was obtained from the New Jersey Department of Transportation (NJDOT) Annual
Background Growth Rate Table.
OTHER PLANNED DEVELOPMENT PROJECTS
To evaluate the future traffic conditions, it is important to consider the potential site-generated traffic of
other projects that could influence the traffic volume at the study intersections. Other planned development
projects include those that are either in the entitlement process or have recently been approved for building
permits in proximity to the proposed development. Based on consultations with Burgis Associates, Inc., it is
understood that the Celgene Corporation’s West Campus is expected to impact traffic volumes on Morris
Avenue along the site frontage. Stonefield has reviewed the Traffic Impact Study prepared by Langan Engineering
& Environmental Services, Inc., last revised September 12, 2018. Appended Figure 5 illustrates the site-
generated traffic associated with the Celegene West Campus assigned to the study area network.
5S T O N E F I E L D E N G I N E E R I N G & D E S I G N , LLC PROPOSED PRIMROSE SCHOOL
CITY OF SUMMIT, UNION COUNTY, NEW JERSEY
2022 NO-BUILD TRAFFIC VOLUMES
The site-generated trips associated with the Celegene West Campus were added to the 2022 Base Traffic
Volumes to calculate the 2022 No-Build Traffic Volumes. These volumes are summarized on appended Figure
6.
2022 NO-BUILD LOS/CAPACITY ANALYSIS
A Level of Service and Volume/Capacity analysis was also conducted for the 2022 No-Build Condition
during the study peak hours at the intersection of Morris Avenue and Gates Avenue. Under the no-build
condition, turning movements at the unsignalized intersection are calculated to continue to operate at Level of
Service D or better.
2022 BUILD CONDITION
The site-generated traffic volume of the proposed Primrose School was estimated to identify the potential
impacts of the project. For the purpose of this analysis, a complete project “build out” is assumed within two
(2) years of the preparation of this study.
TRIP GENERATION
It is noted that data contained within the ITE Trip Generation Manual, 10th Edition was considered for the
proposed day care center. However, in reviewing the specific data that has been collected by the ITE, the vast
majority of the day care centers studied are significantly smaller than the proposed Primrose School and
therefore may operate differently than how Primrose intends to operate the site. Specifically, only 4.5% of the
89 sites studied with regards to the weekday morning peak hour operations were of sites greater than 10,000
square feet, whereas 51 of the 89 sites (57%) studied were less than 5,000 square feet. Considering that the
proposed site is 14,970 square feet, it appears that the data may not be accurate for the proposed use.
Therefore, Stonefield sought to utilize data specific to the proposed user to ensure accurate trip generation
estimates.
To estimate trip generation for the Primrose School associated with student drop-off and pick-up, student
check-in and check-out data from operating Primrose Schools in Berkley Heights, NJ and Mountainside, NJ was
reviewed. Specifically, data from January 6, 2020, January 7, 2020, and January 8, 2020 at each facility was
summarized over the course of the 12-hour operation period. The data was summarized in 15-minute intervals
to identify the weekday morning and evening peak hours. The weekday morning peak hour occurred at 7:45
a.m. and the weekday evening peak hour occurred at 5:15 p.m. As some students are siblings, there were
instances that a single adult checked multiple students into or out of a facility. In these instances, only one (1)
6S T O N E F I E L D E N G I N E E R I N G & D E S I G N , LLC PROPOSED PRIMROSE SCHOOL
CITY OF SUMMIT, UNION COUNTY, NEW JERSEY
trip in each direction was tabulated. Additionally, the data was normalized based on the licensed operating
capacities at each facility. The Berkley Heights facility has a licensed operating capacity of 201 students and the
Mountainside facility has a licensed operating capacity of 194 students. The proposed facility intends to have a
licensed operating capacity of 200 students.
To estimate trip generation for the Primrose School associated with staff arrival and departure, staff
schedules from operating Primrose Schools in Berkley Heights and Mountainside were reviewed. Specifically,
staff schedules from the Mountainside facility on February 26, 2020, February 27, 2020, and February 28, 2020
and staff schedules from the Berkley Heights facility on February 3, 2020, February 4, 2020, and February 5,
2020 were reviewed. The staff schedules were utilized to establish an average percentage of the staff on-site,
based on the maximum daily staff level, in 15-minute intervals.
Table 1 provides the weekday morning and weekday evening trip generation volumes associated with the
proposed development.
TABLE 1 – PROJECTED TRIP GENERATION
Weekday Morning Weekday Evening
Peak Hour Peak Hour
Land Use Enter Exit Total Enter Exit Total
Primrose School – Student drop-off/pick-up 74 74 148 69 69 138
Primrose School – Staff 11 0 11 0 9 9
Total 85 74 159 69 78 147
TRIP ASSIGNMENT/DISTRIBUTION
The trips generated by the proposed development were distributed according to the existing travel pattern
along the adjacent roadways and the access management plan of the site. The "New" Primrose-Generated
Parent Traffic Volumes are illustrated on Figure 7, the "New" Primrose-Generated Staff Traffic Volumes are
illustrated on Figure 8.
2022 BUILD TRAFFIC VOLUMES
The site-generated trips were added to the 2022 No-Build Traffic Volumes to calculate the 2022 Build
Traffic Volumes and are shown on appended Figure 9.
2022 BUILD LOS/CAPACITY ANALYSIS
A Level of Service and Volume/Capacity analysis was conducted for the 2022 Build Condition during the
weekday morning and evening peak hours at the proposed site driveways as well as at the intersection of
Morris Avenue and Gates Avenue.
7S T O N E F I E L D E N G I N E E R I N G & D E S I G N , LLC PROPOSED PRIMROSE SCHOOL
CITY OF SUMMIT, UNION COUNTY, NEW JERSEY
Turning movements at the unsignalized Morris Avenue driveway are calculated to operate at Level of
Service B during the weekday morning and evening peak hours. Turning movements at the unsignalized Gates
Avenue driveway are calculated to operate at Level of Service A during the weekday morning and evening peak
hours. The westbound left turning movement at the unsignalized intersection of Morris Avenue and Gates
Avenue is calculated to operate at Level of Service B during each study peak hour. The northbound approach
at the unsignalized intersection of Morris Avenue and Gates Avenue are calculated to operate at Level of
Service F during the morning peak hour. Please note that the average delay for the northbound approach is
calculated be less than one minute during the morning peak hour. Tables 2 through 5 report the Level of
Service and delay time for turning movements at the site’s driveways and the studied intersection.
COMPARATIVE LEVEL OF SERVICE (DELAY) TABLES
MORRIS AVENUE & SITE DRIVEWAY
WB (Westbound) approach is the Morris Avenue approach
X (n) = Level of Service (seconds of delay)
TABLE 2 – 2022 BUILD CONDITION
Weekday Morning Weekday Evening
Lane Group Peak Hour Peak Hour
WB Left B (10.8) B (10.4)
GATES AVENUE & SITE DRIVEWAY
EB (Eastbound) approach is the site driveway approach
X (n) = Level of Service (seconds of delay)
TABLE 3 – 2022 BUILD CONDITION
Weekday Morning Weekday Evening
Lane Group Peak Hour Peak Hour
EB Left A (9.3) A (9.3)
MORRIS AVENUE & GATES AVENUE
WB (Westbound) approach is the Morris Avenue approach
NB (Northbound) approach is the Gates Avenue approach
X (n) = Level of Service (seconds of delay)
TABLE 4 – WEEKDAY MORNING PEAK HOUR
Lane Group 2020 Existing 2022 No-Build 2022 Build
WB Left B (10.1) B (10.3) B (10.3)
NB Left/Right D (27.0) D (30.4) F (55.5)
8S T O N E F I E L D E N G I N E E R I N G & D E S I G N , LLC PROPOSED PRIMROSE SCHOOL
CITY OF SUMMIT, UNION COUNTY, NEW JERSEY
MORRIS AVENUE & GATES AVENUE
WB (Westbound) approach is the Morris Avenue approach
NB (Northbound) approach is the Gates Avenue approach
X (n) = Level of Service (seconds of delay)
TABLE 5 – WEEKDAY EVENING PEAK HOUR
Lane Group 2020 Existing 2022 No-Build 2022 Build
WB Left A (9.7) B (10.1) B (10.1)
NB Left/Right C (19.4) C (21.5) D (33.4)
VEHICLE GAP ACCEPTANCE
Vehicular gap acceptance in the vicinity of the proposed development was observed and data was collected
to determine local operator characteristics of the surrounding roadway network. Video recordings were
conducted simultaneously with the turning movement counts to capture turning movements at stop-controlled
approach of Gates Avenue at its intersection with Morris Avenue. The gap acceptance data was analyzed to
identify the prevailing critical gap. The critical gap refers to the minimum time-gap in traffic that a motorist will
accept in order to complete a turning movement. The critical gap was determined using the Raff method,
which is provided within the Traffic Engineering Handbook, 7th Edition published by ITE, and is defined as “the
gap for which number of accepted gaps shorter than it is equal to the number of rejected gaps longer than it.”
Per the results of the gap acceptance analysis, left-turning vehicles conservatively require a critical gap of
5.5 seconds. This value was utilized within the capacity analyses contained herein. The calculations associated
with the gap acceptance analysis can be found within the Technical Appendix.
SITE CIRCULATION/PARKING SUPPLY
A review was conducted of the proposed Primrose School using the Site Plan prepared by Stonefield, last
revised December 10, 2020. In completing this review, particular attention was focused on the site access,
circulation, and parking supply.
Access is proposed via one (1) ingress-only driveway along Morris Avenue and one (1) egress-only driveway
along Gates Avenue, which are both operational in the existing condition. As the existing driveways will be
maintained, proper sight distance at each of the driveways will be maintained. The two (2) existing access points
along Webster Avenue would be closed. The existing one-story building proximate to Webster Avenue would
be demolished and the existing two-story building would be renovated and expanded. In the proposed
condition, the building will be located along the Morris Avenue frontage of the subject property. Parking would
be provided in the southeast corner of the subject property. The existing parking lot, which serves Lot 1 would
be replaced with a playground for the day care center.
9S T O N E F I E L D E N G I N E E R I N G & D E S I G N , LLC PROPOSED PRIMROSE SCHOOL
CITY OF SUMMIT, UNION COUNTY, NEW JERSEY
Regarding the parking requirements for the proposed development, the City of Summit Ordinance requires
a minimum of three (3) spaces plus one (1) space per employee for day care center. For the proposed
development with 28 Primrose School employees, this equates to 31 required spaces. The site would provide
39 total parking spaces, inclusive of two (2) ADA accessible parking spaces. Accordingly, this application is
compliant with the City’s requirements. The spaces would be nine (9) feet wide by 18 feet deep in accordance
with industry standards. The spaces closest to the day care entrance would be utilized for pick-up and drop-
off operations.
Based on a review of the check-in and check-out data at the existing sites studied, the proposed Primrose
School would be expected to have a maximum of eleven (11) simultaneous student drop-offs during the
morning peak hour. Accordingly, a maximum parking demand of eleven (11) spaces relating to student drop-
off is expected. Alternatively, to statistically determine the expected parking demand associated with the
random arrivals of parents throughout the entire day on 15-minute intervals, a Poisson distribution was utilized.
A 95% confidence interval was considered as per established traffic engineering standards, the duration of pick-
up/drop-off transactions was conservatively assumed to be 10 minutes, and the number of drop-off/pick-ups
were based on the rolling peak hour parent trip generation on 15-minute intervals from the Mountainside and
Berkeley Heights sites. Based on the Poisson distribution a maximum parking demand associated with parent
drop-off and pickup would be eighteen (18) spaces occurring between 7:45 AM and 8:00 AM.
As staff arrival and departure is less random than parent arrivals, the data collected at the Mountainside
and Berkeley Heights locations were utilized to generate a parking demand at 15-minute intervals for 28
employees. It is noted that this calculation conservatively assumes that all 28 employees utilize their own
vehicles, and no employees carpool, get dropped off, take mass transit, or walk to the facility. The expected
peak parking demand of 28 cars for employees would occur from 11:00 AM to 1:00 PM.
It should be noted that the parent drop-off/pick-up and employee parking for the day care would not have
simultaneous peaks in parking demand. Table 6 and appended Exhibit 1 show the expected peak parking
demand over the typical weekday with an expected cumulative peak parking demand of 32 parked cars
occurring at a time from 4:15 PM to 4:30 PM. As such, the parking supply of 39 spaces would be sufficient to
accommodate the demand of the site. It is noted that no credits for staff utilizing transit or carpooling
occupancies have been applied.
10S T O N E F I E L D E N G I N E E R I N G & D E S I G N , LLC PROPOSED PRIMROSE SCHOOL
CITY OF SUMMIT, UNION COUNTY, NEW JERSEY
TABLE 6 – PROJECTED PARKING DEMAND
Parent
Drop-off/Pick-up Primrose Employee Total Parking
Time of Day Parking Demand Parking Demand Demand
6:30 AM 7 4 11
6:45 AM 9 4 13
7:00 AM 13 6 19
7:15 AM 15 6 21
7:30 AM 17 10 27
7:45 AM 18 10 28
8:00 AM 15 14 29
8:15 AM 13 16 29
8:30 AM 10 21 31
8:45 AM 7 21 28
9:00 AM 5 23 28
9:15 AM 4 24 28
9:30 AM 2 26 28
9:45 AM 2 26 28
10:00 AM 1 27 28
10:15 AM 1 27 28
10:30 AM 1 27 28
10:45 AM 1 27 28
11:00 AM 1 28 29
11:15 AM 1 28 29
11:30 AM 1 28 29
11:45 AM 1 28 29
12:00 PM 1 28 29
12:15 PM 1 28 29
12:30 PM 1 28 29
12:45 PM 1 28 29
1:00 PM 1 27 28
1:15 PM 1 27 28
1:30 PM 1 27 28
1:45 PM 1 27 28
2:00 PM 1 26 27
2:15 PM 2 26 28
2:30 PM 3 26 29
2:45 PM 4 26 30
3:00 PM 5 25 30
3:15 PM 6 25 31
3:30 PM 7 22 29
3:45 PM 8 22 30
4:00 PM 9 21 30
4:15 PM 11 21 32
4:30 PM 11 17 28
4:45 PM 13 17 30
5:00 PM 15 15 30
5:15 PM 17 13 30
5:30 PM 16 8 24
5:45 PM 13 8 21
6:00 PM 8 6 14
6:15 PM 4 5 9
6:30 PM 0 0 0
11S T O N E F I E L D E N G I N E E R I N G & D E S I G N , LLC PROPOSED PRIMROSE SCHOOL
CITY OF SUMMIT, UNION COUNTY, NEW JERSEY
Finally, as the Primrose School operates facilities proximate to the proposed location, the licensed
capacities and parking supplies of the nearby facilities in Mountainside, Old Bridge and Florham Park were
reviewed. Table 7 presents a comparison of the licensed capacities and parking supplies of the existing and
proposed facilities.
TABLE 7 – SITE COMPARISON
Site Location Licensed Capacity Parking Supply
Mountainside 194 33
Old Bridge 210 40
Florham Park 213 37
Proposed Summit Facility 200 39
As shown in Table 7, the Primrose Schools in Mountainside, Old Bridge, and Florham Park operate
with similar licensed capacities and parking supplies. For reference, aerial exhibits showing the aforementioned
operating locations are provided in the Technical Appendix. This comparison serves to further justify that the
proposed parking supply would be sufficient to support the Primrose School operations.
CONCLUSIONS
This report was prepared to examine the potential traffic impact of the proposed Primrose School. The
analysis findings, which have been based on industry standard guidelines, indicate that the proposed driveways
and access points would operate at acceptable Levels of Service and would operate efficiently. The site
driveways and on-site layout have been designed to provide for effective access to and from the subject
property. Based on industry data and data collected from nearby sites operated by the intended end-user, the
parking supply would be sufficient to support this project.
T:\2019\T-19313 Primrose Schools - Morris Avenue & Webster Avenue, Summit, NJ\Calculations & Reports\Traffic\Reports\2020-12 TIS\2020-12 TIS.docx
12TECHNICAL APPENDIX
A1LEVEL OF SERVICE/AVERAGE CONTROL DELAY CRITERIA
A2LEVEL OF SERVICE /AVERAGE CONTROL DELAY CRITERIA
The ability of a roadway to effectively accommodate traffic demand is determined through an
assessment of the volume-to-capacity ratio, delay and Level of Service of the lane group and/or
intersection. The volume-to-capacity ratio is the ratio of traffic flow rate to capacity for a given
transportation facility. As defined within the Highway Capacity Manual 2010 (HCM 2010),
intersection delay is the total additional travel time experienced by drivers, passengers, or
pedestrians as a result of control measures and interaction with other users of the facility,
divided by the volume departing from the corresponding cross section of the facility. Level of
service is a qualitative measure describing operational conditions within a traffic stream, based
on service measures such as speed and travel time, freedom to maneuver, traffic interruptions,
comfort and convenience.
For an unsignalized intersection, LOS A indicates operations with delay less than 10 seconds per
vehicle, while LOS F describes operations with delay in excess of 50 seconds per vehicle. For a
signalized intersection, LOS A indicates operations with delay less than 10 seconds per vehicle
and LOS F denotes operations with delay in excess of 80 seconds per vehicle.
Level Of Signalized Delay Range Unsignalized Delay Range
Service (average control delay in (average control delay in
(LOS) sec/veh) sec/veh)
A 50
Source: Highway Capacity Manual 2010
A3TURNING MOVEMENT COUNT DATA
A4Intersection Morris Avenue and Gates Avenue
Survey Date 12/2/20
Project Name Primrose Schools
Job Number T-19313
Time Class Morris Avenue Morris Avenue Gates Avenue Grand
EBT EBR Total WBL WBT Total NBL NBR Total Total
6:30 AM Passenger Car 23 0 23 0 31 31 3 0 3 57
to Truck 1 1 1 1 0 2
6:45 AM Buses 2 2 2 2 0 4
Total 26 0 26 0 34 34 3 0 3 63
6:45 AM Passenger Car 43 1 44 0 55 55 1 2 3 102
to Truck 3 3 1 1 0 4
7:00 AM Buses 0 2 2 0 2
Total 46 1 47 0 58 58 1 2 3 108
7:00 AM Passenger Car 59 1 60 1 60 61 2 3 5 126
to Truck 1 1 1 1 0 2
7:15 AM Buses 2 2 3 3 0 5
Total 62 1 63 1 64 65 2 3 5 133
7:15 AM Passenger Car 87 0 87 0 70 70 1 1 2 159
to Truck 4 4 3 3 0 7
7:30 AM Buses 3 3 1 1 0 4
Total 94 0 94 0 74 74 1 1 2 170
7:30 AM Passenger Car 94 2 96 0 94 94 3 12 15 205
to Truck 7 7 1 1 0 8
7:45 AM Buses 3 3 0 0 3
Total 104 2 106 0 95 95 3 12 15 216
7:45 AM Passenger Car 143 2 145 4 125 129 2 10 12 286
to Truck 4 4 3 3 0 7
8:00 AM Buses 1 1 5 5 0 6
Total 148 2 150 4 133 137 2 10 12 299
8:00 AM Passenger Car 86 1 87 4 114 118 4 12 16 221
to Truck 2 2 5 5 0 7
8:15 AM Buses 0 3 3 0 3
Total 88 1 89 4 122 126 4 12 16 231
8:15 AM Passenger Car 106 4 110 2 119 121 3 4 7 238
to Truck 4 4 4 4 0 8
8:30 AM Buses 1 1 1 1 0 2
Total 111 4 115 2 124 126 3 4 7 248
8:30 AM Passenger Car 99 4 103 2 97 99 5 3 8 210
to Truck 8 1 9 4 4 0 13
8:45 AM Buses 1 1 4 4 0 5
Total 108 5 113 2 105 107 5 3 8 228
8:45 AM Passenger Car 85 4 89 2 101 103 0 4 4 196
to Truck 3 3 2 2 1 1 6
9:00 AM Buses 0 1 1 1 1 2
Total 88 4 92 2 104 106 1 5 6 204
\\sedfs01\ShareOne\T\2019\T-19313 Primrose Schools - Morris Avenue & Webster Avenue, Summit, NJ\Field Notes & Photos\Counts\2020-12-07\Volume Summary PM Print 12/10/2020
A5Intersection Morris Avenue and Gates Avenue
Survey Date 12/2/20
Project Name Primrose Schools
Job Number T-19313
Time Class Morris Avenue Morris Avenue Gates Avenue Grand
EBT EBR Total WBL WBT Total NBL NBR Total Total
3:30 PM Passenger Car 89 6 95 4 91 95 6 4 10 200
to Truck 6 6 7 7 0 13
3:45 PM Buses 2 2 1 1 0 3
Total 97 6 103 4 99 103 6 4 10 216
3:45 PM Passenger Car 80 2 82 2 100 102 1 2 3 187
to Truck 1 1 8 8 0 9
School Buses 0 0 0 0
4:00 PM Buses 2 2 2 2 0 4
Total 83 2 85 2 110 112 1 2 3 200
4:00 PM Passenger Car 100 2 102 1 123 124 1 5 6 232
to Truck 2 2 5 5 0 7
4:15 PM Buses 0 1 1 0 1
Total 102 2 104 1 129 130 1 5 6 240
4:15 PM Passenger Car 112 1 113 1 118 119 3 3 6 238
to Truck 4 4 7 7 0 11
4:30 PM Buses 1 1 1 1 0 2
Total 117 1 118 1 126 127 3 3 6 251
4:30 PM Passenger Car 94 4 98 0 105 105 0 4 4 207
to Truck 0 5 5 0 5
4:45 PM Buses 0 0 0 0
Total 94 4 98 0 110 110 0 4 4 212
4:45 PM Passenger Car 81 2 83 9 100 109 2 5 7 199
to Truck 1 1 4 4 0 5
School Buses 0 0 0 0
5:00 PM Buses 1 1 1 1 0 2
Total 83 2 85 9 105 114 2 5 7 206
5:00 PM Passenger Car 95 6 101 5 104 109 5 6 11 221
to Truck 3 3 4 4 1 1 8
5:15 PM Buses 0 2 2 0 2
Total 98 6 104 5 110 115 5 7 12 231
5:15 PM Passenger Car 99 0 99 2 98 100 2 4 6 205
to Truck 1 1 2 2 2 0 4
5:30 PM Buses 0 0 0 0
Total 100 1 101 2 100 102 2 4 6 209
5:30 PM Passenger Car 88 2 90 2 101 103 5 4 9 202
to Truck 2 2 0 0 2
5:45 PM Buses 2 2 1 1 0 3
Total 92 2 94 2 102 104 5 4 9 207
5:45 PM Passenger Car 70 0 70 4 104 108 4 5 9 187
to Truck 0 0 0 0
6:00 PM Buses 1 1 1 1 0 2
Total 71 0 71 4 105 109 4 5 9 189
6:00 PM Passenger Car 84 5 89 1 101 102 4 0 4 195
to Truck 0 0 0 0
6:15 PM Buses 1 1 0 0 1
Total 85 5 90 1 101 102 4 0 4 196
6:15 PM Passenger Car 67 1 68 3 69 72 5 2 7 147
to Truck 0 0 0 0
6:30 PM Buses 1 1 1 1 0 2
Total 68 1 69 3 70 73 5 2 7 149
\\sedfs01\ShareOne\T\2019\T-19313 Primrose Schools - Morris Avenue & Webster Avenue, Summit, NJ\Field Notes & Photos\Counts\2020-12-07\Volume Summary PM Print 12/10/2020
A6Intersection Morris Avenue and Gates Avenue
Survey Date 12/2/20
Project Name Primrose Schools
Job Number T-19313
AM Peak Hour
Intersection Peak Hour: 7:45 AM to 8:45 AM
Morris Avenue Morris Avenue Gates Avenue Grand
EBT EBR Total WBL WBT Total NBL NBR Total Total
Vol 455 12 467 12 484 496 14 29 43 1006
PHF 0.77 0.60 0.78 0.75 0.91 0.91 0.70 0.60 0.67 0.84
% Truck 4.0% 4.1% 3.3% 3.2% 0.0% 3.5%
% Bus 0.6% 2.7% 2.6% 0.0% 1.6%
Notes:
PM Peak Hour
Intersection Peak Hour: 5:15 PM to 6:15 PM
Morris Avenue Morris Avenue Gates Avenue Grand
EBT EBR Total WBL WBT Total NBL NBR Total Total
Vol 348 8 356 9 408 417 15 13 28 909
PHF 0.87 0.40 0.88 0.56 0.97 0.96 0.75 0.65 0.78 1.09
% Truck 1.1% 0.5% 0.0% 0.7%
% Bus 1.1% 0.5% 0.0% 0.7%
Notes:
T:\2019\T-19313 Primrose Schools - Morris Avenue & Webster Avenue, Summit, NJ\Field Notes & Photos\Counts\2020-12-07\Volume Summary TMC Peak Hour 12/10/2020
A7NJDOT TRAFFIC DATA
A8New Jersey Department of Transportation
Daily Volume from 12/13/2011 through 12/15/2011
Site Names: 112069, , Morris Avenue-.6, 20000651__, Summit City Seasonal Factor Type: 2 Urban Other Roadways
County: UNION Daily Factor Type: 2 Urban Other Roadways
Funct. Class: Urban Minor Arterial Axle Factor Type: 16
Location: Bet Gates Ave and Beverly Rd Growth Factor Type:
Sun 12/11/2011 Mon 12/12/2011 Tue 12/13/2011 Wed 12/14/2011 Thu 12/15/2011 Fri 12/16/2011 Sat 12/17/2011
ROAD W E ROAD W E ROAD W E ROAD W E ROAD W E ROAD W E ROAD W E
00:00 55 33 22 66 36 30
01:00 30 11 19 26 15 11
02:00 16 7 9 29 11 18
03:00 18 10 8 18 11 7
04:00 47 20 27 37 19 18
05:00 131 57 74 122 60 62
06:00 397 201 196 385 199 186
07:00 1,385 651 734 1,339 659 680
08:00 1,353 742 611 1,312 713 599
09:00 1,148 614 534 1,103 611 492
10:00 1,049 555 494 921 476 445
11:00 1,145 626 519 1,146 617 529
12:00 1,112 576 536 1,141 599 542
13:00 1,055 548 507 1,107 574 533
14:00 1,328 518 810 1,193 582 611
15:00 1,816 689 1,127 1,596 797 799
16:00 1,390 644 746 1,380 669 711
17:00 1,377 641 736 1,385 623 762
18:00 1,263 640 623 1,217 548 669
19:00 849 399 450 906 439 467
20:00 591 313 278 574 266 308
21:00 429 208 221 486 283 203
22:00 259 122 137 284 137 147
23:00 135 75 60 138 71 67
Volume 13,798 6,554 7,244 18,054 9,027 9,027 4,437 2,334 2,103
AM Peak Vol 1,530 769 766
AM Peak Fct 0.87 0.84 0.79
AM Peak Hr 7:30 7:45 7:30
PM Peak Vol 1,895 722 1,246 1,596 823 812
PM Peak Fct 0.93 0.90 0.86 0.96 0.89 0.87
PM Peak Hr 14:45 15:15 14:45 15:00 15:15 14:45
Seasonal Fct 1.053 1.053 1.053 1.053 1.053 1.053 1.053 1.053 1.053
Daily Fct 0.888 0.888 0.888 0.877 0.877 0.877 0.915 0.915 0.915
Axle Fct 0.489 0.489 0.489 0.489 0.489 0.489 0.489 0.489 0.489
Pulse Fct 2.000 2.000 2.000 2.000 2.000 2.000 2.000 2.000 2.000
Collected by: NJDOT
Created 02/16/2012 1:58:59PM ROAD AADT 16,552 W AADT 8,173 E AADT 8,380 DV03: Page 1 of 1
A9FIGURES
A10SITE
Primrose School
480 & 490 Morris Avenue FIGURE 1
City of Summit, New Jersey Site Location Map
Traffic Impact Study
A11Morris Avenue
484 [408]
498 [423] 12 [9]
[356] 467 [348] 455
[8] 12
[15] 14
[13] 6
24 [17]
Site
[28] 20
Gates Avenue
LEGEND
Existing Roadway
Proposed Driveway
Existing Private Driveway
AM [PM] Peak Hour Volumes
not to scale
Signalized Intersection
Primrose School
FIGURE 2
480 & 490 Morris Avenue
2020 As-Counted Traffic
City of Summit, New Jersey
Volumes
Traffic Impact Study
A12Morris Avenue
789 [643]
812 [667] 20 [14]
[790] 808 [772] 787
[18] 21
[24] 23
[21] 10
41 [32]
Site
[45] 33
Gates Avenue
LEGEND
Existing Roadway
Proposed Driveway
Existing Private Driveway
AM [PM] Peak Hour Volumes
not to scale
Signalized Intersection
Primrose School
FIGURE 3
480 & 490 Morris Avenue
2020 Existing Adjusted
City of Summit, New Jersey
Traffic Volumes
Traffic Impact Study
A13Morris Avenue
805 [656]
828 [680] 20 [14]
[806] 824 [788] 803
[18] 21
[24] 23
[21] 10
41 [32]
Site
[45] 33
Gates Avenue
LEGEND
Existing Roadway
Proposed Driveway
Existing Private Driveway
AM [PM] Peak Hour Volumes
not to scale
Signalized Intersection
Primrose School
480 & 490 Morris Avenue FIGURE 4
City of Summit, New Jersey 2022 Base Traffic Volumes
Traffic Impact Study
A14Morris Avenue
67 [12] 67 [12]
[68] 8 [68] 8
Site
Gates Avenue
LEGEND
Existing Roadway
Proposed Driveway
Existing Private Driveway
AM [PM] Peak Hour Volumes
not to scale
Signalized Intersection
Primrose School
FIGURE 5
480 & 490 Morris Avenue
Other Planned Projects
City of Summit, New Jersey
Future Traffic Volumes
Traffic Impact Study
A15Morris Avenue
872 [668]
895 [692] 20 [14]
[874] 832 [856] 811
[18] 21
[24] 23
[21] 10
41 [32]
Site
[45] 33
Gates Avenue
LEGEND
Existing Roadway
Proposed Driveway
Existing Private Driveway
AM [PM] Peak Hour Volumes
not to scale
Signalized Intersection
Primrose School
FIGURE 6
480 & 490 Morris Avenue
2022 No-Build Traffic
City of Summit, New Jersey
Volumes
Traffic Impact Study
A16Morris Avenue
38 [37]
38 [37] 38 [37]
[32] 36
[37] 38
[32] 36
Site
[69] 74
Gates Avenue
LEGEND
Existing Roadway
Proposed Driveway
Existing Private Driveway
AM MID [PM] SAT Peak Hour
not to scale
Signalized Intersection
Primrose School FIGURE 7
480 & 490 Morris Avenue "New" Primrose-
City of Summit, New Jersey Generated Parent Traffic
Traffic Impact Study Volumes
A17Morris Avenue
0 [5]
5 [0] 5 [0]
[0] 6
[5] 0
[4] 0
Site
[9] 0
Gates Avenue
LEGEND
Existing Roadway
Proposed Driveway
Existing Private Driveway
AM [PM] Peak Hour Volumes
not to scale
Signalized Intersection
Primrose School FIGURE 8
480 & 490 Morris Avenue "New" Primrose-
City of Summit, New Jersey Generated Staff Traffic
Traffic Impact Study Volumes
A18Morris Avenue
933 [734] 915 [705]
43 [37] 20 [14]
[874] 832 [856] 811
[32] 42 [18] 21
[66] 61
[57] 46
41 [32]
Site
[78] 74
[45] 33
Gates Avenue
LEGEND
Existing Roadway
Proposed Driveway
Existing Private Driveway
AM MID [PM] SAT Peak Hour
not to scale
Signalized Intersection
Primrose School
480 & 490 Morris Avenue FIGURE 9
City of Summit, New Jersey 2022 Build Traffic Volumes
Traffic Impact Study
A19GAP ACCEPTANCE ANALYSIS
A20Proposed Primrose School
Summit, New Jersey
Count Conducted: 12/02/2020
SE&D Job No. T-19313
Gates Avenue and Morris Avenue
City of Summit, New Jersey
GAPS (SECONDS)
TIME 0 - 1.99 2 - 2.49 2.5 - 2.99 3 - 3.49 3.5 - 3.99 4 - 4.49 4.5 - 4.99 5 - 5.49 5.5 - 5.99 6 - 6.49 6.5 - 6.99 7 - 7.49 7.5 - 7.99 8 - 8.49 8.5 - 8.99 9 - 9.49 9.5 +
Gap Accepted 0 0 0 0 0 0 2 0 3 2 3 4 1 3 2 1 3
Gap Rejected 68 23 29 10 17 9 4 5 1 1 5 1 1 0 0 0 0
Left Turn Gap Acceptance Per Raff Method
1
0.9
0.8
0.7
Cumulative Number of Gaps
0.6
0.5
0.4
0.3
0.2
0.1
0
0 ‐ 1.99 2 ‐ 2.49 2.5 ‐ 2.99 3 ‐ 3.49 3.5 ‐ 3.99 4 ‐ 4.49 4.5 ‐ 4.99 5 ‐ 5.49 5.5 ‐ 5.99 6 ‐ 6.49 6.5 ‐ 6.99 7 ‐ 7.49 7.5 ‐ 7.99 8 ‐ 8.49 8.5 ‐ 8.99 9 ‐ 9.49 9.5 +
Gap Length (sec.)
Gap Accepted Gap Rejected
T:\2019\T-19313 Primrose Schools - Morris Avenue & Webster Avenue, Summit, NJ\Calculations & Reports\Traffic\Analyses\Gap Acceptance\Gap Acceptance
A21HIGHWAY CAPACITY ANALYSIS DETAIL SHEETS
A22HCS7 Two-Way Stop-Control Report
General Information Site Information
Analyst AJL Intersection EXAM
Agency/Co. SED Jurisdiction
Date Performed 12/8/2020 East/West Street Morris Avenue
Analysis Year 2020 North/South Street Gates Avenue
Time Analyzed Existing Peak Hour Factor 0.84
Intersection Orientation East-West Analysis Time Period (hrs) 0.25
Project Description T19313
Lanes
Major Street: East-West
Vehicle Volumes and Adjustments
Approach Eastbound Westbound Northbound Southbound
Movement U L T R U L T R U L T R U L T R
Priority 1U 1 2 3 4U 4 5 6 7 8 9 10 11 12
Number of Lanes 0 0 1 0 0 0 1 0 0 0 0 0 0 0
Configuration TR LT LR
Volume, V (veh/h) 787 21 20 789 23 10
Percent Heavy Vehicles (%) 0 0 0
Proportion Time Blocked
Percent Grade (%) 0
Right Turn Channelized No No No No
Median Type/Storage Undivided
Critical and Follow-up Headways
Base Critical Headway (sec) 4.1 5.5 5.5
Critical Headway (sec) 4.10 4.80 5.50
Base Follow-Up Headway (sec) 2.2 3.5 3.3
Follow-Up Headway (sec) 2.20 3.50 3.30
Delay, Queue Length, and Level of Service
Flow Rate, v (veh/h) 24 39
Capacity, c (veh/h) 724 202
v/c Ratio 0.03 0.19
95% Queue Length, Q₉₅ (veh) 0.1 0.7
Control Delay (s/veh) 10.1 27.0
Level of Service, LOS B D
Approach Delay (s/veh) 0.9 27.0
Approach LOS D
Copyright © 2020 University of Florida. All Rights Reserved. HCS7™ TWSC Version 7.1 Generated: 12/9/2020 9:03:56 PM
EXAM.xtw
A23HCS7 Two-Way Stop-Control Report
General Information Site Information
Analyst AJL Intersection EXPM
Agency/Co. SED Jurisdiction
Date Performed 12/8/2020 East/West Street Morris Avenue
Analysis Year 2020 North/South Street Gates Avenue
Time Analyzed Existing Peak Hour Factor 0.91
Intersection Orientation East-West Analysis Time Period (hrs) 0.25
Project Description T19313
Lanes
Major Street: East-West
Vehicle Volumes and Adjustments
Approach Eastbound Westbound Northbound Southbound
Movement U L T R U L T R U L T R U L T R
Priority 1U 1 2 3 4U 4 5 6 7 8 9 10 11 12
Number of Lanes 0 0 1 0 0 0 1 0 0 0 0 0 0 0
Configuration TR LT LR
Volume, V (veh/h) 772 18 14 643 24 21
Percent Heavy Vehicles (%) 0 0 0
Proportion Time Blocked
Percent Grade (%) 0
Right Turn Channelized No No No No
Median Type/Storage Undivided
Critical and Follow-up Headways
Base Critical Headway (sec) 4.1 5.5 5.5
Critical Headway (sec) 4.10 4.80 5.50
Base Follow-Up Headway (sec) 2.2 3.5 3.3
Follow-Up Headway (sec) 2.20 3.50 3.30
Delay, Queue Length, and Level of Service
Flow Rate, v (veh/h) 15 49
Capacity, c (veh/h) 785 299
v/c Ratio 0.02 0.16
95% Queue Length, Q₉₅ (veh) 0.1 0.6
Control Delay (s/veh) 9.7 19.4
Level of Service, LOS A C
Approach Delay (s/veh) 0.5 19.4
Approach LOS C
Copyright © 2020 University of Florida. All Rights Reserved. HCS7™ TWSC Version 7.1 Generated: 12/10/2020 11:22:40 AM
EXPM.xtw
A24HCS7 Two-Way Stop-Control Report
General Information Site Information
Analyst AJL Intersection NBAM
Agency/Co. SED Jurisdiction
Date Performed 12/8/2020 East/West Street Morris Avenue
Analysis Year 2022 North/South Street Gates Avenue
Time Analyzed No-Build Peak Hour Factor 0.84
Intersection Orientation East-West Analysis Time Period (hrs) 0.25
Project Description T19313
Lanes
Major Street: East-West
Vehicle Volumes and Adjustments
Approach Eastbound Westbound Northbound Southbound
Movement U L T R U L T R U L T R U L T R
Priority 1U 1 2 3 4U 4 5 6 7 8 9 10 11 12
Number of Lanes 0 0 1 0 0 0 1 0 0 0 0 0 0 0
Configuration TR LT LR
Volume, V (veh/h) 811 21 20 872 23 10
Percent Heavy Vehicles (%) 0 0 0
Proportion Time Blocked
Percent Grade (%) 0
Right Turn Channelized No No No No
Median Type/Storage Undivided
Critical and Follow-up Headways
Base Critical Headway (sec) 4.1 5.5 5.5
Critical Headway (sec) 4.10 4.80 5.50
Base Follow-Up Headway (sec) 2.2 3.5 3.3
Follow-Up Headway (sec) 2.20 3.50 3.30
Delay, Queue Length, and Level of Service
Flow Rate, v (veh/h) 24 39
Capacity, c (veh/h) 706 181
v/c Ratio 0.03 0.22
95% Queue Length, Q₉₅ (veh) 0.1 0.8
Control Delay (s/veh) 10.3 30.4
Level of Service, LOS B D
Approach Delay (s/veh) 1.0 30.4
Approach LOS D
Copyright © 2020 University of Florida. All Rights Reserved. HCS7™ TWSC Version 7.1 Generated: 12/9/2020 9:05:50 PM
NBAM.xtw
A25HCS7 Two-Way Stop-Control Report
General Information Site Information
Analyst AJL Intersection NBPM
Agency/Co. SED Jurisdiction
Date Performed 12/8/2020 East/West Street Morris Avenue
Analysis Year 2022 North/South Street Gates Avenue
Time Analyzed No-Build Peak Hour Factor 0.91
Intersection Orientation East-West Analysis Time Period (hrs) 0.25
Project Description T19313
Lanes
Major Street: East-West
Vehicle Volumes and Adjustments
Approach Eastbound Westbound Northbound Southbound
Movement U L T R U L T R U L T R U L T R
Priority 1U 1 2 3 4U 4 5 6 7 8 9 10 11 12
Number of Lanes 0 0 1 0 0 0 1 0 0 0 0 0 0 0
Configuration TR LT LR
Volume, V (veh/h) 856 18 14 668 24 21
Percent Heavy Vehicles (%) 0 0 0
Proportion Time Blocked
Percent Grade (%) 0
Right Turn Channelized No No No No
Median Type/Storage Undivided
Critical and Follow-up Headways
Base Critical Headway (sec)
Critical Headway (sec)
Base Follow-Up Headway (sec)
Follow-Up Headway (sec)
Delay, Queue Length, and Level of Service
Flow Rate, v (veh/h) 15 49
Capacity, c (veh/h) 724 267
v/c Ratio 0.02 0.18
95% Queue Length, Q₉₅ (veh) 0.1 0.7
Control Delay (s/veh) 10.1 21.5
Level of Service, LOS B C
Approach Delay (s/veh) 0.5 21.5
Approach LOS C
Copyright © 2020 University of Florida. All Rights Reserved. HCS7™ TWSC Version 7.1 Generated: 12/10/2020 11:23:49 AM
NBPM.xtw
A26HCS7 Two-Way Stop-Control Report
General Information Site Information
Analyst AJL Intersection BAM
Agency/Co. SED Jurisdiction
Date Performed 12/8/2020 East/West Street Morris Avenue
Analysis Year 2022 North/South Street Gates Avenue
Time Analyzed Build Peak Hour Factor 0.84
Intersection Orientation East-West Analysis Time Period (hrs) 0.25
Project Description T19313
Lanes
Major Street: East-West
Vehicle Volumes and Adjustments
Approach Eastbound Westbound Northbound Southbound
Movement U L T R U L T R U L T R U L T R
Priority 1U 1 2 3 4U 4 5 6 7 8 9 10 11 12
Number of Lanes 0 0 1 0 0 0 1 0 0 0 0 0 0 0
Configuration TR LT LR
Volume, V (veh/h) 811 21 20 915 61 46
Percent Heavy Vehicles (%) 0 0 0
Proportion Time Blocked
Percent Grade (%) 0
Right Turn Channelized No No No No
Median Type/Storage Undivided
Critical and Follow-up Headways
Base Critical Headway (sec) 4.1 5.5 5.5
Critical Headway (sec) 4.10 4.80 5.50
Base Follow-Up Headway (sec) 2.2 3.5 3.3
Follow-Up Headway (sec) 2.20 3.50 3.30
Delay, Queue Length, and Level of Service
Flow Rate, v (veh/h) 24 128
Capacity, c (veh/h) 706 191
v/c Ratio 0.03 0.67
95% Queue Length, Q₉₅ (veh) 0.1 4.0
Control Delay (s/veh) 10.3 55.5
Level of Service, LOS B F
Approach Delay (s/veh) 1.1 55.5
Approach LOS F
Copyright © 2020 University of Florida. All Rights Reserved. HCS7™ TWSC Version 7.1 Generated: 12/9/2020 3:48:01 PM
BAM - Test (5.5s headway).xtw
A27HCS7 Two-Way Stop-Control Report
General Information Site Information
Analyst AJL Intersection BPM
Agency/Co. SED Jurisdiction
Date Performed 12/8/2020 East/West Street Morris Avenue
Analysis Year 2022 North/South Street Gates Avenue
Time Analyzed Build Peak Hour Factor 0.91
Intersection Orientation East-West Analysis Time Period (hrs) 0.25
Project Description T19313
Lanes
Major Street: East-West
Vehicle Volumes and Adjustments
Approach Eastbound Westbound Northbound Southbound
Movement U L T R U L T R U L T R U L T R
Priority 1U 1 2 3 4U 4 5 6 7 8 9 10 11 12
Number of Lanes 0 0 1 0 0 0 1 0 0 0 0 0 0 0
Configuration TR LT LR
Volume, V (veh/h) 856 18 14 705 66 57
Percent Heavy Vehicles (%) 0 0 0
Proportion Time Blocked
Percent Grade (%) 0
Right Turn Channelized No No No No
Median Type/Storage Undivided
Critical and Follow-up Headways
Base Critical Headway (sec)
Critical Headway (sec)
Base Follow-Up Headway (sec)
Follow-Up Headway (sec)
Delay, Queue Length, and Level of Service
Flow Rate, v (veh/h) 15 136
Capacity, c (veh/h) 724 259
v/c Ratio 0.02 0.53
95% Queue Length, Q₉₅ (veh) 0.1 2.8
Control Delay (s/veh) 10.1 33.4
Level of Service, LOS B D
Approach Delay (s/veh) 0.6 33.4
Approach LOS D
Copyright © 2020 University of Florida. All Rights Reserved. HCS7™ TWSC Version 7.1 Generated: 12/10/2020 11:24:49 AM
BPM.xtw
A28HCS7 Two-Way Stop-Control Report
General Information Site Information
Analyst AJL Intersection 1BAM
Agency/Co. Jurisdiction
Date Performed 12/9/2020 East/West Street Morris Avenue
Analysis Year 2022 North/South Street Site Driveway
Time Analyzed 2022 Build Peak Hour Factor 0.84
Intersection Orientation East-West Analysis Time Period (hrs) 0.25
Project Description T-19313
Lanes
Major Street: East-West
Vehicle Volumes and Adjustments
Approach Eastbound Westbound Northbound Southbound
Movement U L T R U L T R U L T R U L T R
Priority 1U 1 2 3 4U 4 5 6 7 8 9 10 11 12
Number of Lanes 0 0 1 0 0 0 1 0 0 0 0 0 0 0
Configuration TR LT
Volume, V (veh/h) 832 42 43 933
Percent Heavy Vehicles (%) 0
Proportion Time Blocked
Percent Grade (%)
Right Turn Channelized No No No No
Median Type/Storage Undivided
Critical and Follow-up Headways
Base Critical Headway (sec)
Critical Headway (sec)
Base Follow-Up Headway (sec)
Follow-Up Headway (sec)
Delay, Queue Length, and Level of Service
Flow Rate, v (veh/h) 51
Capacity, c (veh/h) 677
v/c Ratio 0.08
95% Queue Length, Q₉₅ (veh) 0.2
Control Delay (s/veh) 10.8
Level of Service, LOS B
Approach Delay (s/veh) 2.5
Approach LOS
Copyright © 2020 University of Florida. All Rights Reserved. HCS7™ TWSC Version 7.1 Generated: 12/9/2020 9:12:00 PM
1BAM.xtw
A29HCS7 Two-Way Stop-Control Report
General Information Site Information
Analyst AJL Intersection 1BPM
Agency/Co. Jurisdiction
Date Performed 12/9/2020 East/West Street Morris Avenue
Analysis Year 2022 North/South Street Site Driveway
Time Analyzed 2022 Build Peak Hour Factor 0.91
Intersection Orientation East-West Analysis Time Period (hrs) 0.25
Project Description T-19313
Lanes
Major Street: East-West
Vehicle Volumes and Adjustments
Approach Eastbound Westbound Northbound Southbound
Movement U L T R U L T R U L T R U L T R
Priority 1U 1 2 3 4U 4 5 6 7 8 9 10 11 12
Number of Lanes 0 0 1 0 0 0 1 0 0 0 0 0 0 0
Configuration TR LT
Volume, V (veh/h) 874 32 37 734
Percent Heavy Vehicles (%) 0
Proportion Time Blocked
Percent Grade (%)
Right Turn Channelized No No No No
Median Type/Storage Undivided
Critical and Follow-up Headways
Base Critical Headway (sec)
Critical Headway (sec)
Base Follow-Up Headway (sec)
Follow-Up Headway (sec)
Delay, Queue Length, and Level of Service
Flow Rate, v (veh/h) 41
Capacity, c (veh/h) 703
v/c Ratio 0.06
95% Queue Length, Q₉₅ (veh) 0.2
Control Delay (s/veh) 10.4
Level of Service, LOS B
Approach Delay (s/veh) 1.6
Approach LOS
Copyright © 2020 University of Florida. All Rights Reserved. HCS7™ TWSC Version 7.1 Generated: 12/10/2020 11:25:47 AM
1BPM.xtw
A30You can also read