Time-Lapse Camera Monitoring and Study of Recurrent Breaching Flow Slides in Cap Ferret, France
←
→
Page content transcription
If your browser does not render page correctly, please read the page content below

Article
Time-Lapse Camera Monitoring and Study of Recurrent
Breaching Flow Slides in Cap Ferret, France
Yves Nédélec * , Philippe Fouine, Cyrille Gayer and Florent Collin

                                          Cerema Sud-Ouest, 24 Rue Carton, CS 41635, CEDEX, 33073 Bordeaux, France; philippe.fouine@cerema.fr (P.F.);
                                          cyrille.gayer@outlook.fr (C.G.); florent.collin@cerema.fr (F.C.)
                                          * Correspondence: yves.nedelec@cerema.fr

                                          Abstract: In this paper, we present a low-cost method designed to monitor recurrent breaching flow
                                          slides that impact the security of a beach. This beach, located in France at the inlet of Arcachon Bay,
                                          connects a sand spit to a tidal channel while ending at the toe of a coastal defense. Monitoring is based
                                          on capturing images and intends to add continuous information to intermittent direct observations so
                                          that triggering and influencing factors can be assessed more precisely. The method is based on time-
                                          lapse picture collection and processing. The field of view shows successive emerged manifestations of
                                          flow slide phenomena, as well as some possibly related environmental elements. On-site application
                                          for 576 days provides important indications and details on flow slide event progress and beach
                                          recovery. A simple but quantitative analysis of the influence of sand spit topographic changes is
                                          proposed as a preliminary approach of the method’s suitability for studies of environmental processes
                                          in conjunction with coast protection.

                                          Keywords: coastal erosion; breaching flow slide; tidal inlet; sedimentary process; coastal defense;
                                          beach stability; low-cost


Citation: Nédélec, Y.; Fouine, P.;
Gayer, C.; Collin, F. Time-Lapse
Camera Monitoring and Study of
                                          1. Introduction
Recurrent Breaching Flow Slides in             Cap Ferret, located on the southwestern coast of France in the Gironde department, is
Cap Ferret, France. Coasts 2022, 2,       a natural sand spit stretching between the outlet of an estuarine lagoon called Arcachon
70–92. https://doi.org/10.3390/           Bay (French: Bassin d’Arcachon) and the Atlantic Ocean (Figure 1). Its southern end
coasts2020005                             splits the shoreline into an armored section, heading northward along the tidal channel
Academic Editor: Riccardo Briganti
                                          and the Atlantic shoreline. Since the erection of defenses along the tidal channel, brutal
                                          slumps have appeared due to significant processes of coast and bank erosion [1]. Since
Received: 14 March 2022                   the southern groyne was constructed in 1995, the sandy beach next to these defenses has
Accepted: 4 April 2022                    also been subject to erosion; many of these slumps have been caused by both wave action
Published: 9 April 2022                   and tidal currents that may reach high velocities at ebb time. Consequently, these have
Publisher’s Note: MDPI stays neutral      shown continuous changes in the shape and state of compaction. These slumps have
with regard to jurisdictional claims in   been identified as breaching flow slides, also called retrogressive breach failures. For a
published maps and institutional affil-   few decades, they have often occurring twice per week, or more. The frequency of these
iations.                                  events and the dangers they represent to walkers or fishers may lead to local authorities
                                          prohibiting access to the beach and seeking to improve their knowledge about this situation.
                                               Coastal flow slides or retrogressive breach failures are uncommon forms of erosion
                                          events that impact compact underwater sandy or silty slopes. They mainly occur in tidal
Copyright: © 2022 by the authors.         environments, but can be observed on riverbanks or lake shores as well. Their course is
Licensee MDPI, Basel, Switzerland.
                                          driven by gravity, but counter-intuitively, they progress upward. The complex process is
This article is an open access article
                                          triggered by processes at the toe, due to various identified factors (groundwater outflow,
distributed under the terms and
                                          dredging, and bed incisions). The release of sediment particles from a vertical wall by
conditions of the Creative Commons
                                          sand dilatancy is activated. The wall retrogrades onshore at a slow and steady rate of
Attribution (CC BY) license (https://
                                          approximately 0.8 m per minute, and can take the form of a circular excavation in the
creativecommons.org/licenses/by/
                                          beach [2–4]. It grows in height and circumference as a plume of sand is drawn away by
4.0/).

Coasts 2022, 2, 70–92. https://doi.org/10.3390/coasts2020005                                                  https://www.mdpi.com/journal/coasts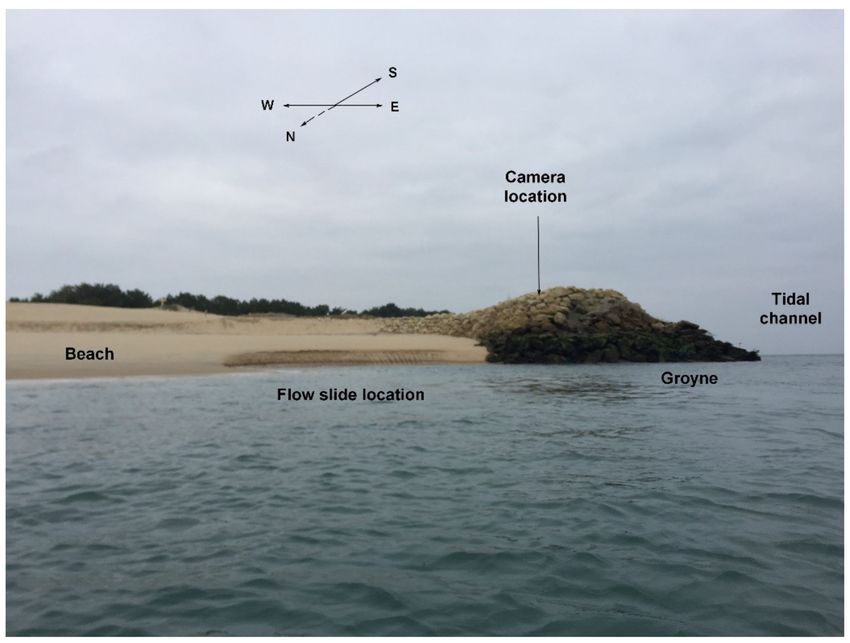
Coasts 2022, 2                                                                                                  71

                 density currents (Figure 2). The wall may fail with spectacular collapses and scars [5],
                 which are potentially a deadly threat to beach walkers or fishers, such as in the case of North
                 Wildwood, New Jersey [6]. The phenomenon may seriously endanger nearby constructions
                 too, and further studies are needed in order to properly perform hazard assessments [7].

                 Figure 1. Map of France and the Gironde department, indicating the location of Cap Ferret and the
                 study site along the coastline of Arcachon Bay.

                 Figure 2. Schematic side view of flow slide process.

                      Improvements in current knowledge and modeling about coastal flow slide dynam-
                 ics [8,9] have used several approaches. Laboratory experiments explore the physical
                 mechanisms and factors involved [10]; extensive site-scale surveys and investigations
                 enable the linking of breaching events to the morphological evolutions of estuaries [11,12];
                 and finally, field observations at predisposed locations bring information on the course,
                 size and consequences of locally recurrent events [4,13–16].
                      However, the randomness and mainly underwater character of this process make
                 assessments of it as an environmental hazard difficult, even in predisposed locations.
                      Therefore, a new method for coastal flow slide monitoring was conceived at the
                 southern end of Cap Ferret in order to inspect its superficial and emerging dynamics,
                 together with its interactions with surrounding environmental features.
Coasts 2022, 2 72
The main objective of this method was to continuously observe beach shape and
flow slide events so that frequency could be assessed. A second objective was to capture
details on event progression over a short time interval. The experiment was designed with
low-cost and robust equipment because of possible damage caused by impacts of waves or
by shocks with floating objects.
The study site, the experimental setup and the monitoring procedure are described in
this paper, followed by preliminary and qualitative results on flow slide dynamics studied
as an event-oriented chronology.
2. Study Site
The experimental site was located on the southern beach of Cap Ferret, on the south-
west Gironde coast in France (Figure 1). A camera was set up to capture views of flow slides
always located near the toe of the southern end of a riprap groyne field bordering the tidal
channel on the east. The monitored area of this beach extended from this groyne to a small
sand spit facing the Atlantic Ocean further west, enabling environmental observations.
Figure 3 shows a map of this monitored area, together with some topographic details.
Figure 3. Map of the monitored beach centered towards the southwest, and environmental points of
interest: (A) riprap in which the camera was inserted; (B) area exposed to flow slides; (C) top of a
blockhouse from World War II; (D) western sand spit; and (E) outlet of tidal channel (background
aerial view: Géolittoral Ortho-Littoral V2 © Cerema-IGN).
Five sedimentary, hydrodynamic and environmental points of interest can be found at
the study site:
1. Blocks forming the eastern groyne where site observation was performed and near to
the area susceptible to flow slides;
2. The area susceptible to flow slides itself;
3. An immovable World War II blockhouse partially stuck in the sand since, showing a
corner pointing upside, easy to spot, and providing a good sand level indicator;
4. The western end of the beach exposed to ocean waves, shaped like a moving sandy hook;
5. The outlet of the tidal channel, often marked by turbulence and strong flow patterns.
Figures 4 and 5 show the site from the water surface and from the top of the groyne,
respectively.Coasts 2022, 2 73
Figure 4. Sea view from the sea towards the part of the monitored beach where flow slides occur.
Figure 5. View from the top of the groyne towards the whole monitored beach.
3. Materials and Methods
3.1. Experimental Setup
The experiment was designed in order to meet the following objectives:
• Use simple, low-cost and robust equipment on site;
• Record and timestamp all visible flow slides in an event-oriented chronology;
• Collect a set of still pictures detailed enough to show surface manifestations of flow
slide events and allow further work on the influence of environmental factors (images
may provide visible factors such as sand features, sea conditions, clouds and rain).Coasts 2022, 2 74
An inexpensive time-lapse camera was chosen as a good compromise between ro-
bustness in a coastal environment facing oceanic waves, picture detail and accuracy, and
stability of the targeted view. A Brinno 200TLC Pro and its protection case were used and
fulfilled the first objective. Resistance to the environment was improved by inserting this
into a rock drilled with two perpendicular holes. The first one, closed by a screwed steel
plate, allowed the camera to be inserted and secured. The second and smaller hole was
open in front of the objective. Image stability was improved too by the mass of the block.
A few steps of this procedure and a view of the camera in place are shown in Figure 6.
Both the block and inserted camera were left in place between 30 July 2015 and 7
April 2017, with a capture interval of 10 min. This interval was a compromise between
obtaining details about ongoing events (retrograding slowly) and maintaining long-term
monitoring. Camera operation energy was provided by batteries that needed replacement
approximately every month. Weather conditions could alter this periodicity, especially
because of very high or very low temperatures, impacting data retrieval operations and
battery replacement. This operation successively required extraction of the block from the
groyne, and an extraction of the camera from the block. After on-site data collection by
means of a USB cable, the material replaced.
The monitoring period covered a total duration of 618 days. Unexpected losses of
battery charge led to a loss of 42 days; thus, 576 days of observations could be analyzed.
The duration of each data gap did not exceed 15 days.
Figure 6. Cont.Coasts 2022, 2 75
Figure 6. Special casing and placement of the camera: (a–d) drilling of the block, larger hole and
locking plate were placed downside at the site; (e) Brinno 200TLC Pro camera, as seen out of package
and as can be seen once in the block (large hole and steel plate are downside); (f) block inserted in
the groyne.
The monitoring data were partitioned into two sets of pictures.
A first large set of pictures was used without geometric processing as a material for
the documentation of the main visible characteristics of flow slide progression and beach
healing and recovery.
A second set of daily pictures was extracted, and geometrical processing was applied
with the purpose of classifying flow slide events and studying longer-term dynamics. These
pictures were chosen according to the quality of the image and the water level. The lowest
tide level was searched, although it was not always exactly at the low tide time, due to
some adverse weather or light conditions.
3.2. Image Processing
As specified previously, data recovery entailed block removal from the coastal struc-
ture, followed by reinsertion. Due to changes in block position between these two proce-
dures, image processing was necessary to correct them and obtain a fixed field of view
(different fields of view in raw pictures are shown in Figure 7). This was performed with
Hugin software.Coasts 2022, 2 76
Figure 7. Raw views from picture collection periods with two different block positions.
The pictures were processed so that an almost invariant field of view can be seen;
thus, differences between block positions were corrected. Hugin software, designed for
perspective manipulation, was used to transform views according to a set of two geometric
rules: (1) invariable relative coordinate x = 0.6 in the picture of the blockhouse top; and
(2) invariant tilting and relative elevation of horizon y = 0.6 in the picture. Image process-
ing by Hugin is carried out through three steps: (1) setting the camera lens parameters;
(2) calibration of three Euler angles to satisfy geometric rules; and (3) numerical calculation.
The completion of these geometric rules also yielded a quasi-straight horizon. Calibration
was performed with two pictures, preceding and following the camera manipulation for
data retrieval, respectively. Figure 8 shows the raw and processed pictures. A grid and
labels for relative coordinates on the processed picture illustrate the geometric rules.Coasts 2022, 2 77
Figure 8. Example of a raw picture (top) and processed picture with grid and labels with relative
coordinates (bottom). The black arrow indicates the sand spit end location in the picture (see
Section 4.2.2).
Verification of the geometric rules was checked on a selected set of daily pictures with
good sight conditions together with low tide conditions (the selection process is detailed in
part 3). Observed relative coordinates of the blockhouse corner and the relative elevation
and tilting on the picture of the horizon line are shown in Figures 9 and 10. Tilting of the
horizon was calculated as the slope of the line bounding two points, on the extreme left
and the extreme right of the visible horizon line, respectively (partially hidden by the sand
spit on the right). The results were considered to be good considering the overall expected
level of geometric accuracy and level of details in close observations.
Vertical dark grey lines marking data retrieval timestamps have been added to both
Figures 9 and 10.
Figure 9 reveals the movement of the block and camera during the experiment, due
to wave impacts on the groyne. This occurred during the fifth monitoring period and
produced a slight change in the blockhouse y coordinate.
Variability of the horizon data can be explained by the picture resolution being too
low to ensure a clear view of the background, together with the sensitivity of near-edge
pixels to Hugin Euler angles.Coasts 2022, 2 78
Figure 9. Blockhouse relative coordinates in the daily pictures after processing.
Figure 10. Horizon tilting (slope of the horizon line in picture) and relative elevation of the horizon
in the daily pictures after processing.
4. Results
4.1. Main Characteristics of Flow Slide Progress and Beach Healing
A list of all known events was provided by the overall examination of daily pictures,
or raw pictures as necessary. Beach changes were qualified as flow slide events when the
nearby shoreline was significantly different between two low daytime tides, and revealed a
circular scar, either freshly excavated or smoothed by an intermediate nightly tide. A few
smaller events needed to be certified after examining sequences of raw pictures with a time
step of 10 min. A total of 67 events were found with this method.
Two examples of visible changes at event scale are shown as sequences of successive
raw images.
The first example (Figure 11) is that of a small event that takes place at some distance
from the groyne (rare) and excavates the beach entirely underwater (barely observed during
the day as well). A vortex with a sand load at 8 h 21 revealed underwater slide progress.
Increased darkness of the water between 8 h 01 and 9 h 01 revealed the loss of sand below
the surface.Coasts 2022, 2 79
Figure 11. Successive raw images showing a mainly submerged event.
The second example (Figure 12) is that of an event that started around noon and
progressed into the beach, excavating its emerged part. Foam was present during most of
its progression, and was remarkably abundant at 15 h 15 and 17 h 15. The origin of this
foam cannot be determined from this set of pictures. Foam is considered by Beinssen [14]
to be a characteristic of flow slides in sands which have not been disturbed for some time.
The frequent repetition of events here indicates that there may be another cause, possibly
with the same foam generation process. Unsaturated sand is suspected to produce foam;
however, the smoothed excavation rim after 15 h 55 and an invisible part of the progressing
event suggest alternative possible explanations. Large sand plumes emitted by the sliding
phenomenon can be seen at 16 h 55. Pictures from 14 h 15 to 15 h 15 give a good idea of the
rapidity of the progress.Coasts 2022, 2 80
Figure 12. Successive raw images of an event excavating the emerged part of the beach.
Daily pictures present interesting information about the beach healing process. This
process depends on drift intensity; flow slides and coastal dynamics are closely related.
Figure 13 shows an active succession of slides (Dates of these slides: December, 14, De-
cember, 15, December, 17, December, 20, 2016) and beach healing, which demonstrates the
ability of the longshore drift to fill the void left by large flow slide events. During such
periods of intense activity, the top corner of the blockhouse is covered by sand, as will be
explained in Section 4.2.2.Coasts 2022, 2 81
Figure 13. Daily processed images showing a succession of flow slide events and subsequent healing
periods.
This sequence of images also shows that flow slides may occur before total healing
from the preceding event.
The next section will present that the flow slide frequency, influence of drift and
healing capacity are not constant between seasons and sedimentary conditions.
4.2. Long-Term Flow Slide Dynamics and Environmental Influences
The collected pictures revealed large variability in slide triggering and size of the
beach excavation; thus, a more time-related approach was sought in order to characterize
the flow slide dynamics. Two attempts for event classification by size were performed as aCoasts 2022, 2 82
preliminary assessment, prior to the further discussed assumption that the event size may
be a relevant indicator of longshore sediment transport.
The next section introduces the simple and improved classification methods based on
event intensity. The subsequent, final section introduces an application for the study of
environmental influences through the relationship between changes in the western sand
spit and the flow slide regime.
4.2.1. Classification of Breaching Flow Slide Events
The whole set of images gave the possibility to identify and characterize flow slide
events. However, it also revealed a great variety of excavation shapes, sizes and locations.
Therefore, it was first attempted to categorize these events between distinct classes, accord-
ing to magnitude. Scant quantitative data could be drawn from pictures, and the visible
shape appeared as the only criterion. Time variability was unknown as well. A group of
five classes was chosen at first, and an operator distributed events between them, basing
their choice on aspect similarity. One event was observed as significantly larger than the
others, and was separated in a sixth class.
Although a visual examination of raw pictures allows a simple evaluation of crater
sizes, and consequently, of event intensity, an alternative method was established for a
more systematic and quantitative evaluation, in order to address its severity and the danger
caused by the excavation nearshore as well as within the beach. The adopted quantitative
indicator was the alignment of the shore near the groyne, broken by the excavation in cases
of flow slide. This broken alignment can be measured as an angle formed by three points
on the shoreline.
The sets of three points were digitized on images with a script developed in Python.
Figure 14 shows a group of views captured from the digitizing process. Three sets of points
(in blue, purple and red) visualized shoreline changes between former daily views.
A red star on the left indicates that the picture was taken the day following a flow
slide event. In this case, one triplet was digitized on the distant corner side of excavation.
Following triplets were digitized close to groyne again, even during the beach healing
process. If a flow slide excavated an unhealed former event, one triplet was digitized on
the new excavation corner.
Angles associated with triplets are meant to evaluate the shoreline deflection, sub-
stantially affected by excavations. The following schematic (Figure 15) illustrates the
measurement principle. According to these principles, most angles should be close to 0,
whereas angles related to flow slide events should have greater values, reaching more than
90 degrees.
Angles and events are presented on a timeline graph split into two periods (Figure 16).
Missing dates are marked with a dotted line. Events are marked with red dots added to the
curve. They mainly appear on peaks, but may be located on other parts of the curve when
two events succeed one another before complete healing.Coasts 2022, 2 83
Figure 14. Sequence of views captured on the screen during the digitizing process. Blue and purple
lines are previous digitized shorelines, and the red line indicates the shoreline associated with the
current view. Red stars mark events.Coasts 2022, 2 84
Figure 15. Schematic of the event intensity measurement based on the calculation of the nearby
shoreline angle: ordinary case (top) and event case (bottom). Red dots and lines: current triplet used
for angle calculation; black dots and lines: shifted copy of current triplet with graphical illustration of
calculated angle; light grey and dark grey dots and lines: former locations of triplets.
Figure 16. Cont.Coasts 2022, 2 85
Figure 16. Timeline of shoreline angle and event markers.
This quantitative method was compared with the simple visual classification of events
into six classes. Figure 17 presents the angle versus the visual class. The only event in the
sixth class was left separate because of its size being slightly greater in appearance than
that of the largest class. This chart shows adequate overlapping between ranges of angles
and visual classes for the first four classes. However, the operator’s human eye could
distinguish differences between events with angles greater than 120 degrees, which could
not be distinguished by the angular method. This may be related to the loss of picture
accuracy with distance and exact shoreline shape identification. In the Discussion, it is
presented that this difference may not significantly affect season-scale interpretation.
Figure 17. Comparison graph of event angle value versus visual class.Coasts 2022, 2 86
Differences between the visual class and angle value are illustrated by the four fol-
lowing representations of an image with their corresponding point in a comparison graph
(marked by a red dot) (Figure 18). This shows the discordance between both methods due
to double event occurrence, or a lack of accuracy with distance, in particular.
Figure 18. Four examples of event views together with comparison graphs. The corresponding point
is red.Coasts 2022, 2 87
4.2.2. Application to a Study of Environmental Influences
An examination of daily images revealed that the end of the visible sand spit, moving
southward and then regressing northward, might be related to changes in the flow slide
regime. Figure 16 shows a dramatic cease in flow slide activity between November 2015
and May 2016. During this period, the sand spit was massive, whereas the beach was in a
very flat and rippled shape, as shown in Figure 19. The southward extension of spit was
particularly visible on 19 February 2016.
Figure 19. Sequence of daily pictures during low flow slide activity.
Locations of the end of the western sand spit in daily pictures (see Figures 5 and 8) were
recorded in order to study its influence. For example, in Figure 8, the relative coordinatesCoasts 2022, 2 88
of the spit end are (0.47, 0.59). All daily relative coordinates are plotted on the graph in
Figure 20. Despite the loss of accuracy due to distance- and calibration-related uncertainties,
changes in the x value were considered as good indicators of a southward extension of the
spit. This was simultaneously observed through topographic surveys by Nahon [17].
Figure 20. Relative locations of western sand spit end in daily pictures after calibration.
In the subsequent Discussion section, we develop an analysis, using the monitored
data, of the relationship between the interruption of flow slide mechanisms, as seen in
Figure 16, and movements of the sand spit, as seen in Figure 20.
5. Discussion
The image collection featured in this paper provides interesting knowledge about the
flow slide phenomenon on a site where it occurs frequently in a controlled area. The method
we introduced is a relevant survey technique considering the main characteristics of flow
slide and beach healing, as well as time-related aspects of event dynamics. It also opens the
way to programs including visual monitoring together with physical data acquisition.
5.1. Analysis of the Relationship between the Flow Slide Dynamics and Movements of the
Sand Spit
Highlighting the relationship between sand spit changes in shape and flow slide
activity was performed following a method developed for artificial drainage analysis:
drainage discharge, characterized by a peak regime, is summed into a cumulative dataset
and plotted as a function of rainfall or accumulated rainfall. This approach is of much
help in studies considering environmental impacts on groundwater drainage [18,19]. Flow
slide event angles were summed on the same principle and presented as a function of time,
together with relative spit length along the x coordinate proportionally fitted between 0
and 1 (i.e., (x − xmin )/(xmax − xmin )). The sum of the visual classes was also plotted on a
graph. This result is shown in Figure 21: blue dots indicate the evolution of spit length.
Cumulative event intensity is drawn as two normalized curves of values, one for each
classification method. Values range between 0 and 1. By doing so, both interpretations of
curves appear to be convergent, despite differences between the classifications of larger
events. The halt in flow slide dynamics can be precisely dated with this approach.Coasts 2022, 2 89
Figure 21. Timelines of cumulative sum of flow slide event angles and classes together with relative
spit end lengths along the x coordinate.
The slope of the curve indicates a relatively regular time distribution of flow slide
intensity. A relationship between this slope and average sand flux through longshore
drift may be assumed, if the volume of moved sand during each event can be associated
unambiguously with each angle or class. This may be a goal for a future study including
precise topographical surveys (see Section 5.2).
The graph in Figure 21 shows the concomitance between the ceased flow slide activity
and end of the sand spit extending southwards. It can be seen qualitatively that after
this maximum extension, sand accumulated at the spit moved towards the groyne, and
refueled the flow slide regime. This regime appeared to be fairly constant during the
experimental period.
This application shows true potential for studies of relationships between sedimentary
processes and the occurrence of flow slides, as recorded in Figure 16 and classified in
Figure 17.
The results obtained are still insufficient to assess sand transport or the influence of
non-visible factors. Hence, there is a need to compare and supplement these results with
other data acquisition methods.
5.2. Monitoring of Breaching Flow Slides Combining Visual and Physical Data
The method described above should be compared with other existing techniques
based on the capture, processing, and analysis of video or time-lapse images. Similar
qualitative or quantitative methods dedicated to coastal changes are reviewed in the
introduction of [20], as well as in [21]. Some techniques have been specifically developed
to investigate or detect coastal processes similar to those presented in this paper: instability
and failure triggering [22], cliff erosion [23], and sand feature changes and longshore
sediment transport [24–27].
The visual monitoring of an unstable cliff described in [22] indicates that the combi-
nation of frequently acquired digital images with local displacement measurements can
provide useful information regarding the evolution of a rock cliff. A similar association of
image collection described in this paper with the medium- or high-frequency acquisition of
environmental parameters could yield interesting information as well.
Weather and sea conditions may be influent factors. An overview of sea level and
roughness can be drawn from picture examinations. However, event dynamics do not
show many differences between summer and winter conditions. Flow slide triggering can
probably be better explained in terms of head gradient from the beach groundwater to
channel waterbody, leading to submarine ground discharge [8]. Measurements of other
varying parameters, such as wind speed, wave height, atmospheric pressure, groundwaterCoasts 2022, 2 90
level at the beach, or rainfall, would therefore be helpful too. All these parameters need
continuous recording, and their collection represents a project of some importance. Alterna-
tively, some indicators easily brought by visual data (sea roughness or wave runup classes,
for example) could be studied similarly to the methods presented in Section 5.1.
General knowledge on the course of flow slides distinguishes between triggering at
the toe and excavation rate and retrogradation related to beach topography [8]. There-
fore, additional topographic surveys could be conducted to answer the questions about
triggering and cross-shore progress. Other methods based on image processing include
photogrammetry to collect topographic data [25,27]. However, at this site, photogrammetry
would have been impractical because of beach surface uniformity and the difficult use of
permanent or frequently laid down ground markers.
Indications on geo-mechanical or hydraulic factors are necessary too [15,28]. Recent
investigations carried out at Amity Point [4] raise an open question about the role played
by sand compaction in the vicinity of sliding places. Adding a penetrometer field cam-
paign [29] to topography surveys will be helpful on Cap Ferret, considering the great
variety of beach shapes observed before slide events. Analysis of the combination of beach
slope, together with sand state of compaction and possible erosive currents at the toe, may
be important too, considering the high velocities observed in the tidal channel along coastal
defenses. Measurements of water velocity in the vicinity of a groyne can thus be included
within an overall appropriate monitoring program.
Collected pictures show that calm sea conditions and clear water may take place
during a flow slide event. Dynamics of flow slides are now better known on this site;
therefore, there is an interesting research opportunity to assess the physical aspects of
underwater flow slide processes. In particular, suitable experimental conditions can be met
for submarine observations and comparisons with large-scale laboratory experiments [10]
or controlled on-site experiments [15].
6. Conclusions
The method developed on the Cap Ferret site gave interesting results about breaching
flow slide dynamics, through an unusual chronological point of view. It represents a
good approach for the study of seasonal influences, because it revealed connections with
longer-term sedimentary processes. Although limited to the daytime, collected data and
information will add valuable knowledge to studies and research still engaged at other
sites [8].
These sets of pictures and flow slide event chronology open further research per-
spectives on how weather and sea conditions influence sedimentary processes at smaller
scales, and may influence studies about longshore sand movements in interactions with
flow slide events, such as estimations of post-event displaced sand volumes, interactions
between unstable area and morphological evolutions of sand spits and southern beaches,
considering longshore drift along western beaches.
Author Contributions: Conceptualization and methodology, Y.N. and C.G.; field instrumentation
and data collection, P.F.; picture processing, F.C. All authors have read and agreed to the published
version of the manuscript.
Funding: This research received no external funding.
Institutional Review Board Statement: Not applicable.
Informed Consent Statement: Not applicable.
Data Availability Statement: Not applicable.
Acknowledgments: The authors would like to thank Benoît Bartherotte, owner of the coastal defense
and groyne, for allowing access to the site during the experimental setup and data retrieval sessions.
Conflicts of Interest: The authors declare no conflict of interest.Coasts 2022, 2 91
References
1. Nédélec, Y.; Revel, J. Phénomènes d’érosion Côtière: Instabilité et Consolidation de Talus Littoraux Sur La Façade Est Du Cap
Ferret (Gironde). In Proceedings of the Rencontres Universitaires de Génie Civil, Bayonne, France, 27–29 May 2015; p. 8.
2. Alhaddad, S.; Labeur, R.; Uijttewaal, W. Breaching Flow Slides and the Associated Turbidity Current. J. Mar. Sci. Eng. 2020, 8, 67.
[CrossRef]
3. Alhaddad, S.; Wit, L.; Labeur, R.; Uijttewaal, W. Modeling of Breaching-Generated Turbidity Currents Using Large Eddy
Simulation. J. Mar. Sci. Eng. 2020, 8, 728. [CrossRef]
4. Brilli, N.; Stark, N.; Nielsen, P.; Callaghan, D.; Manning, M.; Culp, J. Field Investigation of Two Retrogressive Breach Failures at
Amity Point. In Proceedings of the Coastal Sediments 2019, St. Petersburg, FL, USA, 27–31 May 2019; pp. 434–446.
5. Van den Berg, J.; van Gelder, A.; Mastbergen, D. The Importance of Breaching as a Mechanism of Subaqueous Slope Failure in
Sand. Sedimentology 2002, 49, 81–95. [CrossRef]
6. Parry, W. Lifeguards Knew of Danger at New Jersey Beach Years Before Man Drowned. Available online: https://www.
insurancejournal.com/news/east/2016/10/27/430676.htm (accessed on 10 March 2022).
7. Cook, T. Experimenting with Underwater Sediment Slides. Eos 2020, 101. [CrossRef]
8. Mastbergen, D.; Beinssen, K.; Nédélec, Y. Watching the Beach Steadily Disappearing: The Evolution of Understanding of
Retrogressive Breach Failures. J. Mar. Sci. Eng. 2019, 7, 368. [CrossRef]
9. Alhaddad, S.; Labeur, R.; Uijttewaal, W. Preliminary Evaluation of Existing Breaching Erosion Models. In Proceedings of the
Tenth International Conference on Scour and Erosion, Virtual, 19 October 2021.
10. Alhaddad, S.; Labeur, R.; Uijttewaal, W. Large-Scale Experiments on Breaching Flow Slides and the Associated Turbidity Current.
J. Geophys. Res. Earth Surf. 2020, 125, e2020JF005582. [CrossRef]
11. Van Dijk, W.; Hiatt, M.; van der Werf, J.; Kleinhans, M. Effects of Shoal Margin Collapses on the Morphodynamics of a Sandy
Estuary. J. Geophys. Res. Earth Surf. 2019, 124, 195–215. [CrossRef] [PubMed]
12. Van Dijk, W.; Mastbergen, D.; van den Ham, G.; Leuven, J.; Kleinhans, M. Location and Probability of Shoal Margin Collapses in a
Sandy Estuary: Shoal Margin Collapses in a Sandy Estuary. Earth Surf. Process. Landf. 2018, 43, 2342–2357. [CrossRef]
13. Beinssen, K.; Neil, D. Retrogressive Breach Failure Events at Amity Point, Australia and Their Interaction with Built Defences.
In Proceedings of the 25th International Ocean and Polar Engineering Conference—ISOPE 2015, Kona, HI, USA, 21 June 2015;
Volume III, pp. 1325–1330.
14. Beinssen, K.; Neil, D.; Mastbergen, D. Field Observations of Retrogressive Breach Failures at Two Tidal Inlets in Queensland,
Australia. Aust. Geomech. J. 2014, 49, 55–63.
15. Mastbergen, D.; van den Ham, G.; Cartigny, M.; Koelewijn, A.; de Kleine, M.; Clare, M.; Hizzett, J.; Azpiroz, M.; Vellinga,
A. Multiple Flow Slide Experiment in the Westerschelde Estuary, The Netherlands. In Submarine Mass Movements and Their
Consequences; Springer: Berlin, Germany, 2016; pp. 241–249.
16. Lantuit, H.; Pollard, W. Fifty Years of Coastal Erosion and Retrogressive Thaw Slump Activity on Herschel Island, Southern
Beaufort Sea, Yukon Territory, Canada. Geomorphology 2007, 95, 84–102. [CrossRef]
17. Nahon, A. Évolution Morphologique Actuelle d’une Flèche Littorale Holocène: Le Cap Ferret, à l’Embouchure Du Bassin
d’Arcachon. Ph.D. Thesis, Université de Bordeaux, Bordeaux, France, 2018.
18. Tuohy, P.; O’ Loughlin, J.; Peyton, D.; Fenton, O. The Performance and Behavior of Land Drainage Systems and Their Impact on
Field Scale Hydrology in an Increasingly Volatile Climate. Agric. Water Manag. 2018, 210, 96–107. [CrossRef]
19. Rozemeijer, J.; Visser, A.; Borren, W.; Winegram, M.; Van der Velde, Y.; Klein, J.; Broers, H. High-Frequency Monitoring of Water
Fluxes and Nutrient Loads to Assess the Effects of Controlled Drainage on Water Storage and Nutrient Transport. Hydrol. Earth
Syst. Sci. 2016, 20, 347–358. [CrossRef]
20. Simarro, G.; Calvete, D.; Souto, P. UCalib: Cameras Autocalibration on Coastal Video Monitoring Systems. Remote Sens. 2021, 13,
2795. [CrossRef]
21. Eboigbe, M. Low-Cost, Close-Range Digital Photogrammetry for Coastal Cliff Deformation and Beach Monitoring; University of South
Wales: Newport, UK, 2021.
22. Guenzi, D.; Godone, D.; Allasia, P.; Fazio, N.L.; Perrotti, M.; Lollino, P. Brief Communication: Monitoring a Soft-Rock Coastal
Cliff Using Webcams and Strain Sensors. Nat. Hazards Earth Syst. Sci. 2022, 22, 207–212. [CrossRef]
23. Westoby, M.J.; Lim, M.; Hogg, M.; Pound, M.J.; Dunlop, L.; Woodward, J. Cost-Effective Erosion Monitoring of Coastal Cliffs.
Coast. Eng. 2018, 138, 152–164. [CrossRef]
24. Harley, M.D.; Kinsela, M.A.; Sánchez-García, E.; Vos, K. Shoreline Change Mapping Using Crowd-Sourced Smartphone Images.
Coast. Eng. 2019, 150, 175–189. [CrossRef]
25. Ahn, Y.; Shin, B.; Kim, K.-H. Shoreline Change Monitoring Using High Resolution Digital Photogrammetric Technique. J. Coast.
Res. 2017, 79, 204–208. [CrossRef]
26. Oh, J.-E.; Chang, Y.S.; Jeong, W.M.; Kim, K.H.; Ryu, K.H. Estimation of Longshore Sediment Transport Using Video Monitoring
Shoreline Data. J. Mar. Sci. Eng. 2020, 8, 572. [CrossRef]
27. Laporte-Fauret, Q.; Marieu, V.; Castelle, B.; Michalet, R.; Bujan, S.; Rosebery, D. Low-Cost UAV for High-Resolution and
Large-Scale Coastal Dune Change Monitoring Using Photogrammetry. J. Mar. Sci. Eng. 2019, 7, 63. [CrossRef]Coasts 2022, 2 92
28. De Groot, M.; Lindenberg, J.; Mastbergen, D.; van den Ham, G. Large Scale Sand Liquefaction Flow Slide Tests Revisited. In
Proceedings of the Eurofuge 2012, Delft, The Netherlands, 23 April 2012; p. 22.
29. Albatal, A.; Waldman, H.; Stark, N.; Bilici, C.; Mc Ninch, J. Investigation of Spatial and Short-Term Temporal Nearshore Sandy
Sediment Strength Using a Portable Free Fall Penetrometer. Coast. Eng. 2019, 143, 21–37. [CrossRef]You can also read