The Year of the Mudlark - JANUARY 2023 - Pershing
←
→
Page content transcription
If your browser does not render page correctly, please read the page content below
The Year of the Mudlark
JANUARY 2023

This material is intended for informational purposes only and does not constitute investment advice or an offer or solicitation to purchase, hold or sell
any securities. The opinions expressed by Lockwood are as of January 2023 and may change as subsequent conditions vary. The information and
opinions contained in this material are derived from proprietary and nonproprietary sources deemed by Lockwood to be reliable but are not
necessarily all inclusive. This material may contain forward-looking information that is not purely historical in nature. Such information may include,
among other things, projections and forecasts. There is no guarantee that any projections or forecasts made will come to pass. Reliance upon
information in this material is at the sole discretion of the reader. Please refer to the Important Disclosures at the end of this document.
THE YEAR OF THE MUDLARK                                                                                                                                   JANUARY 2023

Contents

Executive Summary ....................................................................................................................................................3
The Year of the Mudlark .............................................................................................................................................4
Scavenging for Treasure ............................................................................................................................................5
U.S. Equities .............................................................................................................................................................10
Non-U.S. Equities .....................................................................................................................................................10
Emerging Market Equities ........................................................................................................................................10
Housing.....................................................................................................................................................................11
Geopolitical Risk .......................................................................................................................................................11
Guide to Mudlarking .................................................................................................................................................12
Important Disclosures ...............................................................................................................................................13

                                                                                          2
THE YEAR OF THE MUDLARK JANUARY 2023
Executive Summary
Five Trends to Consider
1. Year of the Mudlark
A mudlark is an occupation in the United Kingdom where one makes a living by scavenging for objects of
value on the muddy banks of the Thames River in London. We expect that in 2023, investors will become
mudlarks, picking through the wreckage of the bear market to find asset classes they deem to be of
compelling value.
2. Recession Watch
Rising interest rates may have already created opportunities in fixed income. We've watched credit
spreads widen during 2022. Spreads between both U.S. high yield and investment-grade corporate bonds
have widened relative to U.S. Treasury bonds since the summer of 2021. If investment grade and high
yield bonds continue to cheapen during 2023, at some point the prices may reflect a likely recession and
offer better value.
3. Look Abroad for Value
Non-U.S. markets have already become substantially cheaper than their U.S. counterparts. Non-U.S.
performance advances could continue into 2023. In general, developed equity markets outside the U.S.
have more value-oriented stocks compared to growth-oriented stocks. As value has outperformed, so
have developed equity markets outside the U.S.
4. Escalating Geopolitical Risk
In 2022, Russia's invasion of Ukraine put an exclamation point on already tight energy, agricultural and
commodity supplies. Besides Ukraine, risks are also prevalent in the Balkans, Taiwan, North Korea and
Iran as well as on the Greek-Turkish and Chinese-Indian borders. These disturbing developments around
the globe warrant a more defensive posture in asset allocations in 2023.
5. Searching for Treasure
Meaningful opportunities may arise from the substantial damage done to valuations that has already
occurred and what may occur as we traverse the remainder of the bear market. We have begun to see
more attractive entry points in fixed income sectors and in the non-U.S. and emerging markets arenas.
3THE YEAR OF THE MUDLARK JANUARY 2023
The Year of the Mudlark
In our January 2022 commentary, we proclaimed the season as the winter of the hawk. We cautioned that
"inflationary pressures are not likely to recede in time to alter the Federal Reserve's immediate tightening
course and may not recede at all within the next several quarters." Remember, a hawk is a monetary policy
maker who is relatively more concerned with price stability and fighting inflation. A hawk advocates higher
interest rates and a relatively "tight" policy stance. It turns out that the entire year of 2022 was the Year of
the Hawk.
Here we are a year later, and both the Federal Open Market Committee (FOMC) and Federal Reserve Chairman
Jerome Hayden "Jay" Powell have disappointed markets yet again with a mix of "tighter" policy moves and
hawkish commentaries about future rate hikes. Unfriendly monetary policy wasn't the only theme of 2022.
War, geopolitical tensions, slowing global growth and lingering COVID-19 concerns all helped to take markets
down substantially in many asset classes (see table).
Market Overview
Index Returns (%) as of December 31, 2022
Index 4Q 2022 1 Yr. 3 Yr. ^ 5 Yr. ^ 2021 2020 2019 2018
S&P 500 7.6 (18.1) 7.7 9.4 28.7 18.4 31.5 (4.4)
MSCI USA Small Cap 8.0 (17.2) 5.6 6.2 19.6 18.9 27.4 (10.0)
MSCI EAFE (net of taxes) 17.3 (14.5) 0.9 1.5 11.3 7.8 22.0 (13.8)
MSCI Emerging Markets (net of taxes) 9.7 (20.1) (2.7) (1.4) (2.5) 18.3 18.4 (14.6)
Bloomberg US Aggregate Bond 1.9 (13.0) (2.7) 0.0 (1.5) 7.5 8.7 0.0
Bloomberg Global Aggregate ex-US 6.8 (18.7) (5.9) (3.1) (7.0) 10.1 5.1 (2.1)
S&P GSCI Crude Oil 1.0 6.7 9.5 5.8 55.0 (20.5) 34.5 (24.8)
S&P GSCI Gold 9.5 (0.7) 4.7 5.7 (4.3) 20.9 18.0 (2.8)
Bloomberg Commodity 2.2 16.1 12.7 6.4 27.1 (3.1) 7.7 (11.2)
Bloomberg US Treasury Bill 6–9 Month 0.6 0.2 0.5 1.2 0.0 1.2 2.6 1.8
Inflation § 0.9 7.1 5.2 4.1 7.1 1.3 2.3 1.9
^3-year and 5-year returns are annualized
Sources: MSCI; Bloomberg; Standard and Poor's (©2023, S&P Dow Jones Indices LLC. All rights reserved); Bureau of Labor Statistics.
§ Inflation data through November 2022. Visual created by Lockwood Advisors, Inc. For additional information regarding the indices shown, please
refer to the Important Disclosures at the end of this document. Indices are unmanaged and are not available for direct investment. Past
performance is not a guarantee of future results.
4THE YEAR OF THE MUDLARK JANUARY 2023
Scavenging for Treasure
2023 will be the year of the Mudlark.
Up until 1936 in the United Kingdom (UK), someone could register his/her occupation as a "mudlark." This meant a
person made his/her living by scavenging for objects of value on the muddy banks of the Thames River in London.
Perhaps the mudlark would find some coal, coins, metal or enough trinkets to scrape by a subsistence-level living. A
mudlark would also run the risk of disease or injury from the items and creatures in the Thames Estuary.
Most mudlarks were young boys or street urchins, and some turned scavenging into a full-time occupation. Sir Arthur
Conan Doyle wrote about the “Baker Street Irregulars” in the Sherlock Holmes series. These were young boys
available for hire as spies or perhaps mudlarks. Charles Dickens also wrote about scavengers in Our Mutual Friend.
Dickens had worked in a shoe polish factory on the Thames as a boy and could easily describe a life of toil and smoke.
Now that factory site is Charing Cross Station. Today, with layers of governmental authority, you needed to apply for a
Thames foreshore permit from the Port of London Authority (PLA) for mudlarking. After all, most of the Thames
Embankment is owned by the Crown. At least, you could have applied up until late November 2022, when the PLA
suspended new applications for mudlarking permits. According to the PLA, there are over 5,000 active permits, but the
5THE YEAR OF THE MUDLARK JANUARY 2023
link to apply for a new one has been suspended "to protect the historical integrity of the Thames foreshore." If you find
anything of real historical or antiquarian value, you have to comply with UK's Treasure Act of 1966. Even if you're
armed with a newfangled metal detector, you're not able to scan the riverbank for valuable detritus unless you already
have a permit. The PLA "hopes to be able to open up issuing permits again in the new year [2023]."
At some point in time during 2023, investors will become mudlarks, picking through the wreckage of the bear market to
find anything they deem to be of compelling value. Thus, here we offer our 2023 guide to mudlarking, pointing out
where we see opportunities that could arise from the aftermath of challenging bear markets.
A rising tide may lift all boats, but, for a mudlark, a falling tide exposes more territory to comb through. The timing of
macroeconomic, inflation and credit cycles will probably play a large role in determining when pockets of value may
arise this year. Some see value emerging in certain sectors already, but we expect that we're likely to find the
dominant bearish trends intact as we enter 2023. In their latest edition of the Vantage Point, BNY Mellon Investment
Management indicated that we're most likely to find ourselves in a recession sometime during 2023. Many indicators of
growth have turned sour. We're potentially debating the depth, duration and severity of the downturn rather than
whether it will arrive or not. Please see our last quarter's commentary on the labor market, which may help to lessen
the severity of the downturn. A “jobful” downturn may help mitigate the downside, even if labor is only one of many
meaningful variables that will determine the timing and depth of a potential recession.
Markets are mechanisms that discount expectations for the future. They will look ahead and around the corner to find
opportunity. Multiple asset classes will likely bottom ahead of the absolute troughs in the economic cycle, anticipating
an eventual turn of the tide in advance of the actual event.
Let's start with fixed income and credit.
In general, the rise in interest rates during 2022 may have already created opportunities. Long-duration U.S. Treasury
bonds and yield curves have already responded to the increasing likelihood of a recession. For example, the 30-year
U.S. Treasury bond interest rate was 4.38% in late October and 3.97% as of December 30, 2022. It ended December
2021 at 1.90%. As we started 2022, and for most of the last decade, yields on U.S. Treasury fixed income securities
looked anemic. Expected total returns (coupon plus price change) did not look appetizing. That has changed with the
rise in rates during 2022. It only took the worst bond market in history to make investing in bonds look more attractive.
Also, as prospects for inflation look more benign, this may help bonds find a footing as we enter 2023.
6THE YEAR OF THE MUDLARK JANUARY 2023
U.S. TIPS 10-Year Real Yield (%)
Source: Lockwood Advisors, Macrobond, U.S. Department of the Treasury. Data as of December 30, 2022.
Sectors of the governmental bond market appear more favorably priced than they have in a long time. Take TIPS, or
Treasury Inflation-Protected Securities, as an example. TIPS are priced in real (inflation-adjusted) yields. As you can
see from the chart, the real yield on 10-year TIPS burst out of a long-run trend line higher during 2022. TIPS don’t
sport the very high real yields of over 4% that they offered in the early years of issuance (1997-1998), but they look
better than they have in over a decade. The backup in yields during most of 2022 may have put TIPS on the shopping
list for mudlarks looking to lock in higher real interest rates.
U.S. Credit Spreads to U.S. Treasuries: Year-to-Date Changes (bps)
Source: Lockwood Advisors, Macrobond/Bloomberg as of December 30, 2022.
7THE YEAR OF THE MUDLARK JANUARY 2023
Any recession tends to raise credit spreads. The spreads reflect the additional premium in yield investors demand for
holding risky debt in contrast to holding theoretically riskless U.S. Treasury bills, notes and bonds. Spreads between
both high yield and investment-grade corporate bonds have widened relative to Treasury fixed income securities since
the summer of 2021 when they hit their post COVID-19 lows (see chart above). Although spreads are still much lower
than the highs seen during the immediate COVID-19 event, spreads could continue to widen from current levels this
year. In retrospect, the spread peaks in March and April of 2020 were a superb buying opportunity, but those peaks did
not last long due to the swift and decisive impact of the massive stimulus programs designed to counter the economic
and financial market impact of COVID-19. Those programs were successful in short-circuiting a more exacerbated
economic decline in 2020 and 2021 but set the stage for inflation and economic overheating we've experienced
in 2022.
We've watched spreads widen during 2022, but they could have further to go if growth expectations continue to
decline. Most of the backup in yields for the entire bond market had more to do with the general rise of all interest rates
rather than the widening of credit spreads. If investment grade and high yield bonds continue to cheapen during 2023,
at some point the prices may reflect a likely recession and offer better value. Of course, recessions can cause not only
bond prices to fall but actual defaults to rise. So, caution is warranted, especially in fixed income securities with lower
credit quality ratings. Still, mudlarks might start digging for values in the investment grade and high yield credit sectors
as we move through 2023.
U.S. Dollar Index
2018 – Present
Source: Lockwood Advisors, Macrobond, Federal Reserve. Data as of January 3, 2023.
The U.S. dollar has enjoyed an upward advance from January 2021 until November 2022. Since then, the dollar has
begun to fall, likely reflecting market expectations for an eventual pause or pivot from the Federal Reserve. Many
central banks have begun to tighten policy to try to tame inflation. As foreign interest rates rise, it makes their debt
8THE YEAR OF THE MUDLARK JANUARY 2023
more attractive to global investors and more competitive with U.S. dollar-based investments. If the dollar continues a
downward trajectory, it makes many additional non-U.S. and commodity asset classes relatively more attractive.
Moreover, currency cycles tend to have longer legs (multiple years), so the theme of dollar weakness could be with us
for a while. This may have large implications for where investors want to deploy capital.
Emerging market (EM) debt has suffered during this recent bout of U.S. dollar strength, as well as the impact to EM
debt from the war in Ukraine (Russia, Ukraine and Belarus) and the political crisis in Sri Lanka. Other than the debt
that was removed from the EM debt indices due to Russia war sanctions, this asset class could also look more
appealing as the year progresses. EM debt has attractive interest rates (i.e., carry or the return of holding the
instrument) and would benefit from a pivot or pause to global central bank tightening. While this is a riskier asset class
within fixed income and may still suffer from political risk and credit risk, it might fare better as China begins to emerge
from strict zero COVID-19 policies and high COVID-19 infection rates.
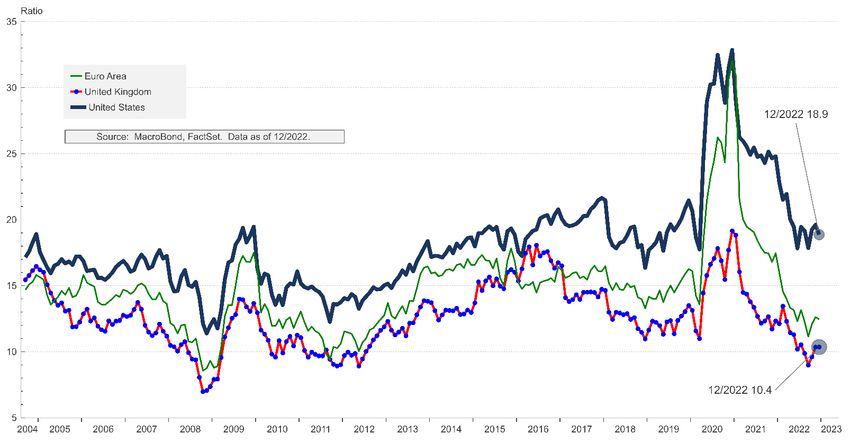
Equity Valuations: Lower but Still Above Typical Recession Lows
Source: Lockwood Advisors, Macrobond, FactSet. Data as of December 2022.
Let's not forget equity. Certainly, if markets begin to price in either a deeper or longer recession, equity valuations
likely have further to fall. The forward earnings also may look too optimistic if a general economic downturn begins to
unfold. So, equities look vulnerable to both multiple compression (P/E [price/earnings] multiples fall) and growth
downturns that will make the denominator (earnings) look too high. Equity markets have been desperate to hear more
dovish commentary about a pivot or pause in the rate-hiking cycle from the Federal Reserve. The pause will come
before the pivot, but likely only after we've seen substantial economic weakening that may coincide with significant
reduction in inflation. We would caution that the Federal Reserve has never stopped a tightening cycle short of positive
(>0) real interest rates, meaning we will likely need to see overnight policy rates (federal funds rate) above inflation
before the cycle pauses. We explored this theme thoroughly in the prior commentary, Taking the Beveridge Curve and
our views have not changed. In short, we could see inflation come down quickly, but it may exact a high price on
economic growth.
9THE YEAR OF THE MUDLARK JANUARY 2023
U.S. Equities
Higher interest rates have certainly been the biggest contributor to the re-rating of equities this year. We expect the
Federal Reserve to continue to hike interest rates into early 2023, so the impact of higher rates on multiples doesn't
appear to have run its course just yet. So, beware, because downside volatility in equity can dwarf the volatility in the
fixed income asset classes. Still, the rewards for mudlarking in developed markets equity could be exceptionally high
this year once markets have fully priced in recession and profit declines. The energy and natural resource sectors and
industries have been the stars in 2022 and might continue to lead the way in the 2023.
Non-U.S. Equities
As many central banks around the globe have embarked on tightening paths, higher rates globally could work to bring
global P/E ratios down. However, many non-U.S. equity markets have already been substantially cheaper than their
U.S. counterparts. During 2022, the relative performance baton was passed to non-U.S. equities. This is a remarkable
development, as U.S. stocks have been winning the performance derby for quite a while. Non-U.S. equity market
performance advances could continue into 2023. In general, developed equity markets outside the U.S. have more
"value" stocks compared to "growth" stocks. As value has outperformed, so have developed equity markets outside the
U.S. Remember, too, that a declining dollar could help non-U.S. earnings streams look more appealing to U.S. based
investors. That said, it's likely that recessionary forces, energy supply concerns and lack of labor mobility could force
Europe into a more protracted and deeper decline than the U.S. and other developed markets with better
demographics. Still, mudlarks would be wise to begin assessing targets around the globe for potential purchases when
they believe the price gets attractive enough in 2023.
We believe energy markets pose a significant risk to the outlook. The Group of Seven (G7), an informal grouping of
advanced economies, has followed through on a threat to set a cap on seaborne Russian crude oil at $60 (€56; £50) a
barrel. Enforcing the cap will require cooperation from other major buyers. Russia has retaliated by announcing an oil
export ban on countries that comply with the cap. The goal of the oil price cap is to reduce revenues flowing to Russia
and to help stop Moscow from using oil revenue to finance the war in Ukraine. Time will tell if the cap is successful, but
it potentially makes energy markets more politically charged and volatile.
Emerging Market Equities
Emerging markets equity has begun to look more attractive. The severe damage done to EM equity during the year
has begun to reveal attractive entry points for investors willing to take the additional risk that has historically
accompanied this asset class. The outlook for EM equity can revolve around China, which has been reeling from the
effects of high COVID-19 infection rates, attitudes towards the disease as well as a serious property crisis. See
Lockwood Investment Insights Horns of a Dilemma. Our capital markets forecasts show EM equity could be one of the
highest returning, yet riskiest, asset classes. With a more supportive currency backdrop that includes dollar weakness,
EM equity may afford compelling long-term rewards from suitable entry points in 2023.
10THE YEAR OF THE MUDLARK JANUARY 2023
United States: 30-Year Fixed Mortgage Rate Versus Case-Shiller National Index
Source: Macrobond. Data as of December 2022.
Housing
One area that looks decidedly unattractive is the housing market. The dramatic moves higher in the 30-year fixed rate
mortgage appears as if it has stopped the housing market dead in its tracks. It's possible that the deteriorating health
of the housing market gets discounted more quickly over 2023, but this looks like an area to avoid at this juncture.
Geopolitical Risk
Especially after 2022, we can't skip our quarterly disclosure that warns about growing geopolitical risks. In 2022, much
of the year had been a partial response to Russia's invasion of Ukraine. That event put an exclamation point on
already tight energy, agricultural and commodity supplies. The conflict exacerbated difficult market conditions in a host
of agricultural and commodity markets. Geopolitical risks have not abated this year by any means. Besides Ukraine,
risks are also prevalent in the Balkans, Taiwan, North Korea and Iran as well as on the Greek-Turkish and Chinese-
Indian borders. In response to these developments, large, developed nations are bolstering their defense
expenditures. Japan has doubled down on its defense commitment with an expenditure planned to rise to 2% of gross
domestic product (GDP) by 2027. We believe these disturbing developments around the globe warrant a more
defensive posture in asset allocations in 2023. There could be some value in defense equities as military layouts
increase. Keep in mind that there could be considerable upside to markets if the Ukraine conflict comes to a
negotiated end.
11THE YEAR OF THE MUDLARK JANUARY 2023
Guide to Mudlarking
So, this is our guide to mudlarking for 2023. We see the bear market continuing into 2023. Equity valuations, especially
in the U.S., do not yet appear to fully reflect substantial economic concerns and trends. Equities could offer much
better value in the near future. Even a shallow recession creates very challenging conditions that may spill over into
unexpected areas. Recessions create unknown unknowns and risks that were unforeseen. Stuff can break. At some
juncture, though, we believe meaningful opportunities will arise from the substantial damage done to valuations that
has already occurred and what may occur as we traverse the remainder of the bear market. We have begun to see
more attractive entry points in fixed income sectors and in the developed (non-U.S.) and emerging markets equity
arenas. One may need a healthy dose of fortitude to mudlark for value in the capital markets during 2023. Perhaps
you will find some overlooked treasure in the search for value.
12THE YEAR OF THE MUDLARK JANUARY 2023
Important Disclosures
©2023 Pershing LLC. All rights reserved. Diversification and strategic asset allocation do not guarantee a profit
or protect against a loss in declining markets. All investments are
Pershing LLC, member FINRA, NYSE, SIPC, is a subsidiary of The
subject to risk, including the loss of principal.
Bank of New York Mellon Corporation (BNY Mellon).
Foreign investments are subject to risks not ordinarily associated
Pershing Advisor Solutions LLC, member FINRA, SIPC, and BNY
with domestic investments, such as currency, economic and political
Mellon, N.A., member FDIC, are affiliates of Pershing LLC. Pershing
risks, and may follow different accounting standards than domestic
does not provide investment advice. Affiliated investment advisory
investments.
services, if offered, are provided by Lockwood Advisors, Inc., an
investment adviser registered in the United States under the Investments in emerging or developing markets involve exposure to
Investment Advisers Act of 1940. Technology services may be economic structures that are generally less diverse and mature, and
provided by Pershing X, Inc. to political systems that can be expected to have less stability than
those of more developed countries. These securities may be less
Trademark(s) belong to their respective owners. This material is for
liquid and more volatile than investments in US and longer
general information purposes only and is not intended to provide
established non-US markets.
legal, tax, accounting, investment, financial or other professional
advice on any matter. Pershing is not responsible for updating any Investments in fixed income securities are subject to several general
information contained within this material and information contained risks, including interest rate risk, credit risk, the risk of issuer default,
herein is subject to change without notice. liquidity risk and market risk. These risks can affect a security's price
and yield to varying degrees, depending upon the nature of the
The statements contained herein are based upon the opinions of
instrument, and may occur from fluctuations in interest rates, a
Lockwood and the data available at the time of publication and are
change to an issuer’s individual situation or industry, or events in the
subject to change at any time without notice.
financial markets. In general, a bond's yield is inversely rated to its
The statistical data contained herein has been obtained from third- price. Bonds can lose their value as interest rates rise and an
party sources (see below) believed to be reliable and accurate. While investor can lose principal. If sold prior to maturity, fixed income
Lockwood believes the information to be accurate and reliable, no securities are subject to gains/losses based on the level of interest
representations, guarantee or warranty, express or implied, can be rates, market conditions and the credit quality of the issuer.
made as to its completeness, accuracy, or reliability.
Liquidity risk increases when particular investments are difficult to
Neither the information nor any opinions expressed herein should be purchase or sell. A lack of liquidity also may cause the value of
construed as a solicitation or a recommendation by Lockwood or its investments to decline. Illiquid investments may be harder to value,
affiliates to buy, hold or sell any securities or investments. Charts are especially in changing markets. Typically, liquid investments may
for illustrative purposes only and are not indicative of the past or become illiquid, particularly during periods of market turmoil. When
future performance of any product. illiquid assets must be sold in such market conditions (to meet
redemption requests or other cash needs for example), it may be
Statements of future expectations, estimates and other forward- necessary to sell such assets at a loss.
looking statements are based on available information and
Lockwood’s view as of the time of these statements. Accordingly, Investments in small/mid-capitalization companies involve greater
such statements are inherently speculative, as they are based on risk and price volatility than an investment in securities of larger
assumptions that may involve known and unknown risks and capitalization, more established companies. Such securities may
uncertainties. Actual results, performance or events may differ have more limited marketability and the firms may have limited
materially from those expressed or implied in such statements. product lines, markets and financial resources than larger, more
established companies.
This communication does not constitute investment advice, is for
informational purposes only and is not intended to meet the Investments in gold bullion come with additional risks. The price of
objectives or suitability requirements of any specific individual or gold has fluctuated widely over the past several years. Several
account. An investor should assess his or her own investment needs factors affect the price of gold, including global supply and demand;
based on his or her own financial circumstances and investment global or regional political, economic or financial events and
objectives. situations, investors’ expectations with respect to the rate of inflation;
currency exchange rates and interest rates. There is no assurance
Lockwood in its capacity as an investment adviser and money that gold will maintain its long-term value in terms of purchasing
manager may be engaged in the purchase and sale of securities power in the future.
discussed in this article in one or more of its discretionary portfolios.
Lockwood personnel may also from time-to-time buy and sell these Investments in natural resources-related companies may be
same securities for their personal accounts. negatively impacted by variations, often rapid, in the commodities
markets, the supply of and demand for specific products and
It is important to remember that there are risks inherent in any services, the supply of and demand for oil and gas, changes in
investment and that there is no assurance that any money manager, energy prices, exploration and production spending, government
fund, asset class, index, style or strategy will provide positive regulation, economic conditions, events relating to international
performance over time. political developments, environmental and safety regulations, energy
conservation, the success of exploration projects and environmental
incidents. As a result, the securities of natural resources companies
13THE YEAR OF THE MUDLARK JANUARY 2023
may experience more price volatility than securities of companies in The index is net because dividends are reinvested after deducting a
other industries. withholding tax from dividend distributions. Since taxes are withheld
from the MSCI EAFE Index (net of taxes), the performance of the
Past performance is not a guarantee of future results. Current
MSCI EAFE Index (net of taxes) will generally be lower than that of
performance may be lower or higher than the performance data
the MSCI EAFE Index (gross of taxes).
quoted. The investment return and principal value of an investment
will fluctuate, so that an investor’s assets, when sold, may be worth MSCI Emerging Markets Index (net of taxes): The MSCI Emerging
more or less than their original cost. Markets Index (net of taxes) is a free-float adjusted, market-
capitalization index that is designed to measure equity market
Inflation is the rate at which the general level of prices for goods and
performance of emerging markets. As of June 30, 2022, the MSCI
services is rising and, consequently, the purchasing power of
Emerging Markets Index consisted of the following 24 emerging
currency is falling.
market country indices: Brazil, Chile, China, Colombia, Czech
The information on indices is presented for illustrative purposes only Republic, Egypt, Greece, Hungary, India, Indonesia, Korea, Kuwait,
and is not intended to imply the potential performance of any fund or Malaysia, Mexico, Peru, Philippines, Poland, Qatar, Saudi Arabia,
investment. Index performance assumes the reinvestment of all South Africa, Taiwan, Thailand, Turkey and United Arab Emirates.
distributions but does not assume any transaction costs, taxes, The index is net because dividends are reinvested after deducting a
management fees or other expenses, which would reduce the withholding tax from dividend distributions. Since taxes are withheld
performance shown. Indices unmanaged and are not available for from the MSCI Emerging Markets Index (net of taxes), the
direct investment. performance of the MSCI Emerging Markets Index (net of taxes) will
generally be lower than that of the MSCI Emerging Markets Index
Bloomberg Global Aggregate ex-US Bond Index: The Bloomberg (gross of taxes).
Global Aggregate ex-US Bond Index is designed to be a broad-
based measure of the global investment-grade, fixed rate, fixed MSCI USA Small Cap Index: The MSCI USA Small Cap Index is an
income corporate markets outside the United States. unmanaged index designed to measure the performance of the
small-cap segment of the US equity market. The index represents
Bloomberg US Aggregate Bond Index: The Bloomberg US approximately 14% of the free float-adjusted market capitalization in
Aggregate Bond Index represents securities that are SEC registered, the US.
taxable and dollar denominated. The index covers the US
investment-grade fixed rate bond market, with index components for S&P GSCI Gold Index: The S&P GSCI Gold Index, a subindex of
government and corporate securities, mortgage pass-through the S&P GSCI Index, provides investors with a reliable and publicly
securities and asset-backed securities. These major sectors are available benchmark for investment performance in the gold
subdivided into more specific indices that are calculated and commodity markets. The index is designed to be tradable, readily
reported on a regular basis. Securities must have at least one year to accessible to market participants and cost efficient to implement. The
final maturity regardless of call features and must have at least $250 S&P GSCI Index is widely recognized as the leading measure of
million par amount outstanding. general commodity price movements and inflation in the world
economy.
Bloomberg US Treasury Bill 6–9 Month Index: The Bloomberg US
Treasury Bill 6–9 Month Index represents United States-issued S&P GSCI Crude Oil Index: The S&P GSCI Crude Oil Index, a sub-
government debt with a bond maturity between six months and nine index of the S&P GSCI, provides investors with a reliable and
months. publicly available benchmark for investment performance in the
crude oil commodity markets. The index is designed to be tradable,
Bloomberg Commodity Index: The Bloomberg Commodity Index is readily accessible to market participants and cost efficient to
designed to be a highly liquid and diversified benchmark for the implement. The S&P GSCI is widely recognized as the leading
commodity futures market. The index is composed of exchange- measure of general commodity price movements and inflation in the
traded futures and represents 20 physical commodities, which are world economy. Spot price in the S&P GSCI means the price of the
weighted to account for economic significance and market liquidity S&P GSCI futures holdings.
(subject to weighting restrictions). On July 1, 2014, the Dow Jones
UBS Commodity Index rebranded as the Bloomberg Commodity S&P 500 Index: The S&P 500 Index, an unmanaged index, includes
Index. 500 of the largest stocks (in terms of stock market value) in the
United States; prior to March 1957, it consisted of 90 of the largest
Consumer Price Index (CPI): The Consumer Price Index (CPI), as stocks. Although the S&P 500 focuses on the large-cap segment of
measured by the U.S. Bureau of Labor Statistics, represents the market, with approximately 80% coverage of US equities, it is
changes in prices of all goods and services purchased for also used as a proxy for the total US equity market.
consumption by urban households.
Reproduction of S&P index data shown in this document in any form
MSCI EAFE (Europe, Australasia and the Far East) Index (net of is prohibited except with the prior written permission of S&P. S&P
taxes): The MSCI EAFE (Europe, Australasia and the Far East) does not guarantee the accuracy, adequacy, completeness or
Index (net of taxes) is a free-float-adjusted market-capitalization availability of any information and is not responsible for any errors or
index that is designed to measure developed market equity omissions, regardless of the cause or for the results obtained from
performance, excluding the United States and Canada. As of June the use of such information. S&P DISCLAIMS ANY AND ALL
30, 2022, the MSCI EAFE Index consisted of the following 21 EXPRESS OR IMPLIED WARRANTIES, INCLUDING, BUT NOT
developed market country indices: Australia, Austria, Belgium, LIMITED TO, ANY WARRANTIES OF MERCHANTABILITY OR
Denmark, Finland, France, Germany, Hong Kong, Ireland, Israel, FITNESS FOR A PARTICULAR PURPOSE OR USE. In no event
Italy, Japan, the Netherlands, New Zealand, Norway, Portugal, shall S&P be liable for any direct, indirect, special or consequential
Singapore, Spain, Sweden, Switzerland and the United Kingdom. damages, costs, expenses, legal fees, or losses (including lost
14THE YEAR OF THE MUDLARK JANUARY 2023
income or lost profit and opportunity costs) in connection with
subscriber’s or others’ use of S&P index data shown in this
document. ©2023, S&P Dow Jones Indices LLC.
Certain information contained herein: (1) is proprietary to
Morningstar and/or its content providers; (2) may not be copied or
distributed; and (3) is not warranted to be accurate, complete or
timely. Neither Morningstar not its content providers are responsible
for any damages or losses arising from any use of this information.
©2023 Morningstar, Inc. All Rights Reserved. Securities are not bank
deposits. They are not insured or guaranteed by Lockwood, its
affiliates or its parent companies.
Securities are not insured or guaranteed by the Federal Deposit
Insurance Corporation (FDIC), the Federal Reserve, the U. S
Securities and Exchange Commission (SEC) or any other
government agency.
For more information about Lockwood, as well as its products, fees
and services, please refer to Lockwood’s Form CRS (Customer
Relationship Summary) and applicable Form ADV Part 2 Wrap Fee
Brochure (Managed360® Program or Co-Sponsored Programs) or
the Firm Brochure, which may be obtained by writing to: Pershing,
Attn: Legal Department, 1 Pershing Plaza, Jersey City, NJ 07302, or
by calling (800) 200-3033, option 3.
All performance is expressed in US dollars. Sources: Federal
Reserve; MSCI; Standard & Poor’s, U.S. Census Bureau, Bureau of
Labor Statistics (BLS), Macrobond, U.S. Treasury Department,
Bloomberg.
15You can also read