The wireless data drain of users, apps, & platforms - Microsoft
←
→
Page content transcription
If your browser does not render page correctly, please read the page content below
The wireless data drain of users, apps, & platforms

 Ardalan Amiri Sani† , Zhiyong Tan† , Peter Washington† , Mira Chen† , Sharad Agarwal‡ , Lin Zhong† , Ming Zhang‡
                                       † Rice University, ‡ Microsoft Research
                † {ardalan, zt1, pyw1, sc25, lzhong}@rice.edu, ‡ {sagarwal, mzh}@microsoft.com

              Cellular data consumption is an important issue for users and network operators. However,
              little is understood about data consumption differences between similar apps, smartphone
              platforms, and different classes of users. We examine data consumption behavior in the
              lab, comparing different apps of the same category, comparing the same top apps across
              different platforms, and comparing network APIs that apps use across different platforms.
              We also collect data from 387 Android users in India, where users pay for cellular data
              consumed, with little prevalence of unlimited data plans. Our findings can inform users on
              how their choice of platform and apps has a drastic impact on their data bill. Our findings
              can also inform operators on how to use incentives to induce desired data consumption.

I.       Introduction                                      compare different apps and different smartphone plat-
On cellular networks, smartphone data usage can eas-       forms. We examine top apps that provide the same
ily outstrip available capacity. Cellular operators tend   functionality (weather forecasts). We examine pop-
to deal with this problem by applying economic pres-       ular apps written by professional developers that are
sure on users. Unlimited data plans are being replaced     available on all of the three major smartphone plat-
with either tiered data plans or “unlimited” plans that    forms. We exercise individual network APIs on these
throttle data rates beyond a certain usage limit, both     three platforms. Data that we collect from 387 An-
inside 1 , 2 , 3 and outside 4 , 5 the US. Technologists   droid users in India helps us understand user behavior
are attempting to deal with this problem by improv-        across different apps. Our findings include:
ing cellular standards, but user demand could outpace         • There is tremendous difference in how much
such improvements and Shannon’s limit could hold                wireless data is consumed by each launch of an
them back [4].                                                  app. This can range from 7KB to over 1MB for
   Beyond a plethora of market research studies that            simply getting the current weather forecast. This
look at cellular traffic growth curves and project the          huge difference is present across the top weather
rise of video streaming and other bandwidth hogging             apps on all three smartphone platforms.
apps, there is little published work that studies the         • There are several popular apps that are common
consumption problem in detail. How are smartphone               to all three platforms and authored by the same
users different in their data usage? How much of                professional developers – e.g. Amazon by Ama-
heavy data consumption is a result of picking one               zon Inc., and Netflix by Netflix Inc. Even when
app over another? How much does the choice of un-               comparing these apps that provide the same func-
derlying smartphone OS contribute to this problem?              tionality across the three platforms, we see large
How can answers to such questions impact the way in             differences in consumption, with factors such as
which cellular operators sell data plans to users?              5X and 10X depending on the app.
   In this paper, we explore this problem from multiple       • While the basic APIs for consuming content
angles. We conduct a number of lab experiments to               from the network are similar across the three
                                                                platforms, there are subtle differences. Compres-
     1
     http://www.dslreports.com/shownews/ATT-Kills-              sion and caching behavior is different, and maps
The-30-Unlimited-Data-Plan-108703                               consume different amounts of data.
   2
     http://www.dslreports.com/shownews/TMobile-
Kills-Unlimited-Data-for-Smartphones-114341                   • Among Android users, there are significant dif-
   3
     http://www.huffingtonpost.com/2011/07/05/                  ferences between “light” data users and “heavy”
verizon-unlimited-data-plan-july-7_n_890613.html                data users in terms of which apps they use and
   4
     http://www.fiercewireless.com/europe/story/                how they spend their time and data in these apps.
analysys-mason-truly-unlimited-mobile-data-
plans-are-rarity-western-europe/2013-05-17
                                                                Our findings suggest that given such information
   5
     http://online.wsj.com/article/                             about the user, we could predict with 58% ac-
SB10001424052970204026804577097703931127104.html                curacy which of three data usage categories they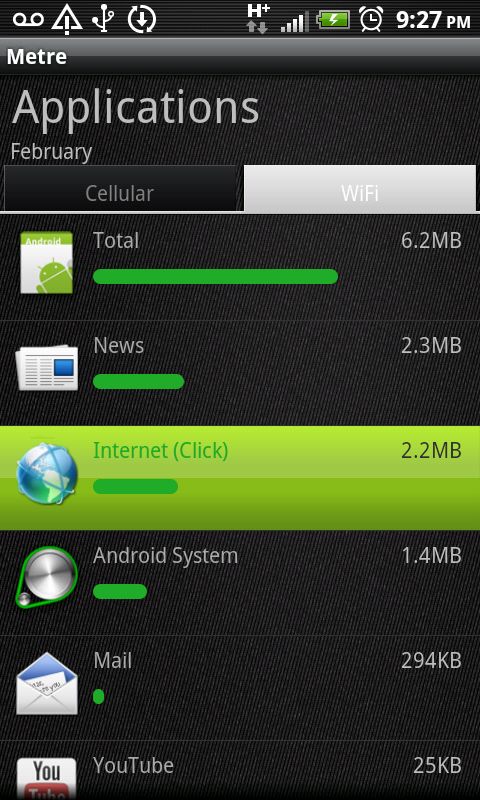
fall into, while random guessing would achieve         over Wi-Fi using Connectify-Me 6 . The laptop also
      only 33%.                                              has Wireshark 1.8.4 7 and Fiddler 2 8 installed. We use
                                                             Wireshark to inspect traffic to/from our smartphones.
Our findings have significant monetary implications          For in-depth HTTP analysis, we use Fiddler.
for users. Data-conscious users have to carefully pick          When analyzing traces, we calculate several statis-
apps and platforms. Picking the wrong weather app            tics. We calculate the total number of bytes trans-
can result in 140X higher data cost. A user that             ferred, which includes IP headers (we use IPv4 in our
primarily runs Amazon, Facebook, Fandango, Gas-              experiments). We split the bytes transferred into four
Buddy, and Walgreens with equal frequency can con-           categories – video, image, text, and other. The video
sume 3.3X more data on the worst of the three smart-         and image categories show the bytes for any HTTP
phone platforms. We can construct other scenarios            transfer, where the “Content-Type” HTTP header field
with more horrifying overconsumption.                        indicates a MIME type for video or image, respec-
   As a network operator that wants to limit spectrum        tively. The text category includes both “text” and
usage by phones, it is important to understand the user.     “application” MIME types, the latter typically includ-
When targeting a user that is a shopper, such as one         ing XML and Javascript. The “other” category in-
that relies on Amazon, Fandango, and Walgreens, it is        cludes other MIME types and non-HTTP traffic such
best to steer the user to a particular platform. When        as other TCP traffic, HTTPS, or UDP. We also cat-
targeting a user that is a news and restaurant reviews       egorize HTTP traffic by cache and compression op-
fan, a different platform is lighter. An operator can        tions. For caching, a client request can specify spe-
stereotype the user by asking a set of questions about       cific HTTP headers that will skip stale cached data in
their behavior. Based on such classification, the op-        the network. The server can include specific headers
erator could sell the user a tailored data plan, or of-      in the response that will indicate to proxies and the
fer incentives to use or stay away from certain apps         client not to cache the response. Similarly, there are
and smartphones. Operators should offer free Wi-Fi           headers where the client can indicate that it will ac-
to users as usage of it is mildly correlated with lower      cept compressed content, and the server can specify
cellular consumption.                                        that the response is compressed.
                                                                We use three phones in our experiments – iPhone
II.     Methodology                                          4 running iOS 5.1.1, Nokia Lumia 710 running Win-
                                                             dows Phone (WP) 7.5, and Samsung Galaxy Nexus
We rely on two sets of experiments in this paper – lab
                                                             running Android 4.1.1. We anonymize the identity
and field. Lab experiments allow us to evaluate data
                                                             of the smartphone platforms when reporting results in
consumption while controlling apps, APIs, and plat-
                                                             this paper 9 . When capturing traces from one phone,
forms. However, they do not capture user behavior. In
                                                             we make sure the other two phones are disconnected.
our field experiments, we collect data directly from
                                                             We evaluate a number of commercial apps and a few
users’ phones, instead of collecting network traces
                                                             custom apps we wrote, that we describe next. Prior
from cellular operators. Instrumenting phones has the
                                                             to collecting traces, for each phone, we first installed
advantage that we can observe Wi-Fi usage, user time
                                                             all the apps, and used each app twice. We then do not
in apps, and attribute consumption to the exact app.
                                                             use the phones for a period of 1 week. We turn off all
While it limits collection to those users that install our
                                                             background activity on the phone, including app back-
software, it allows us to target multiple operators and
                                                             ground activity, email sync, and OS updates. We then
specific geo-regions with more ease. In all our exper-
                                                             capture traces for each app and each phone individu-
iments, we measure the total data usage by each app.
                                                             ally by running the app to do a specific task and then
Therefore, the data the app uses for analytics and ads
                                                             exiting the app. We run each app twice in immediate
is attributed to the app itself.
                                                             succession, to observe how much data is presumably
                                                             cached between successive runs. We capture separate
II.A.     Lab experiments                                    traces for each execution of an app, starting the trace
II.A.1.    Network setup                                     capture just before we launch the app, and stopping
                                                                6
There are three components in our network setup –                 http://www.connectify.me
                                                                7
smartphones, a laptop, and the Rice University Ether-             http://www.wireshark.org
                                                                8
                                                                  http://fiddler2.com
net network. The Rice network does not use any web              9
                                                                  The identities of the platforms are not central to our conclu-
proxies. The laptop runs Microsoft Windows 7 and             sions, and indeed the platforms’ behavior may change with new
shares its Ethernet Internet connection to smartphones       OS updates.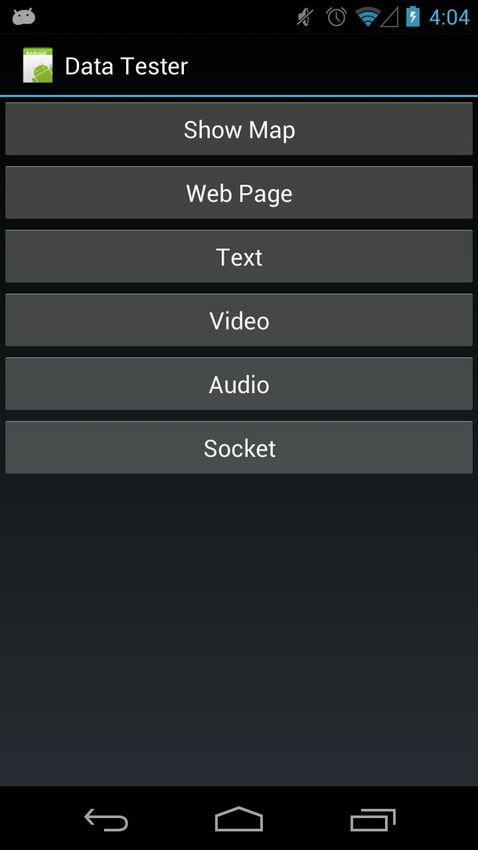
platform 1            platform 2            platform 3             app               action
 Weather Channel       Weather Channel       Weather Channel        Amazon            search for Kindle Fire; click on top item
 WeatherBug            WeatherBug            WeatherBug             CNN               click on top news story
 AccuWeather           AccuWeather           AccuWeather            Facebook          click on news feed for user
 Weather Underground   Weather Underground   Weather Underground    Fandango          click on top movie; get showtimes
 Weather Eye           MyRadar               Weather View           Fragger           play tutorial; finish first level
 Go Weather            Weather Free          WeatherDuck            GasBuddy          click on map of gas prices and nearest gas station
 Go Weather EX         Farenheit             Weather4Me             Walgreens         search for nearest store; click on store details
 Yahoo! Weather        Weather+              Weather+               Weather Channel   click on weather and forecast
 1Weather              Weather               Weather                Yelp              search for pizza; click on top item
 wetter.com            Weather HD 2 Free     WeatherForecast USA    YouTube           search for & watch “Simon’s Cat in Springtime”

Table 1: The weather apps we evaluated on each of                  Table 2: The popular apps we evaluated on each of
the three smartphone platforms.                                    the three smartphone platforms and the action we per-
                                                                   formed in each run of the app.

the trace capture just after exiting the app. In this               task        description
fashion, we believe we are capturing the “typical” net-             audio       play 5,757,568 B audio from
                                                                                http://ardalan.recg.rice.edu/audio.mp3
work consumption of these apps, as opposed to first-                show map    centered at lat 29.94, lon -95.26
run behavior which may include one-time downloads                               Google maps on iPhone, Android; Bing on WP
                                                                    socket      open TCP socket to and receive 1,024 B from
of static icons or configuration.                                               ardalan.recg.rice.edu:5661
                                                                    text        show 139,878 B text file from
                                                                                http://ardalan.recg.rice.edu/mira/pride_and_prejudice
                                                                    video       play 7,883,627 B video from
II.A.2.    Commercial apps                                                      http://ardalan.recg.rice.edu/video.3gp
                                                                    web page    show web page that is 51,452 B in total
                                                                                http://www.owlnet.rice.edu/~aa15/
We evaluate two sets of apps. The first set is the top 10
apps from the “Weather” category of each of the three
smartphone marketplaces. We picked only free apps,                 Table 3: Specific tasks that our custom apps perform
and skipped those that had specialized functionality               on each of the three smartphones.
(e.g. ski forecast). The apps are listed in Table 1 and
we used the versions offered by the respective smart-
phone marketplaces on October 1st, 2012. We config-
ured each app to report the weather for Houston, TX,
where we ran the apps. We ran each app only so far
as to get the current weather and the forecast and then
we quit the app.
   While those set of apps provide very specific func-
tionality, we also evaluated a broader set of popular
apps. We started with the top 50 free apps on each of
the three smartphone platforms. We then picked those
apps that are available on all three lists and are au-
                                                                   Figure 1: Screenshots of our custom apps on the three
thored by the same company that owns the brand (e.g.
                                                                   smartphones.
Amazon by Amazon.com Inc.). We eliminated apps
where it would be difficult to perform the same action
twice on all three phones – e.g. VoIP apps where it                II.A.3.     Custom apps
would be hard to ensure the exact same audio is being
transmitted, or multiplayer games where we cannot do               We also evaluate specific APIs that consume network
the same game play with the same players. We then                  bytes, by building three custom apps. Figure 1 shows
use the top 10 apps that remain on our list and install            screenshots for the apps and Table 3 lists the actions
the 10 apps on each of the three smartphones. The list             that each of the 6 buttons do. For maps, we use the
of these apps is in Table 2, as well as the action we per-         native maps APIs that each platform offers to display
formed in the app each time we ran it. For each action,            a specific 1 square mile region in Houston, TX. For
we waited until the app finished it (e.g. finished load-           the web page and text file downloads, we use standard
ing the news story, or finished playing the video). We             HTTP APIs in the three platforms and use the default
ran the same app on each three phones close enough                 options – i.e. we did not explicitly set any caching or
in time so that the same content is shown to the user.             compression options. On Android, we used the “An-
task Metre usage Packet traces
audio 6,149,322 B 6,582,117 B
show map 91,008 B 96,330 B
socket 1,138 B 1,778 B
text 140,418 B 152,693 B
video 8,254,200 B 8,274,370 B
web page 44,090 B 46,125 B
Table 4: Metre accuracy tests.
Stats APIs, and attributes consumption appropriately.
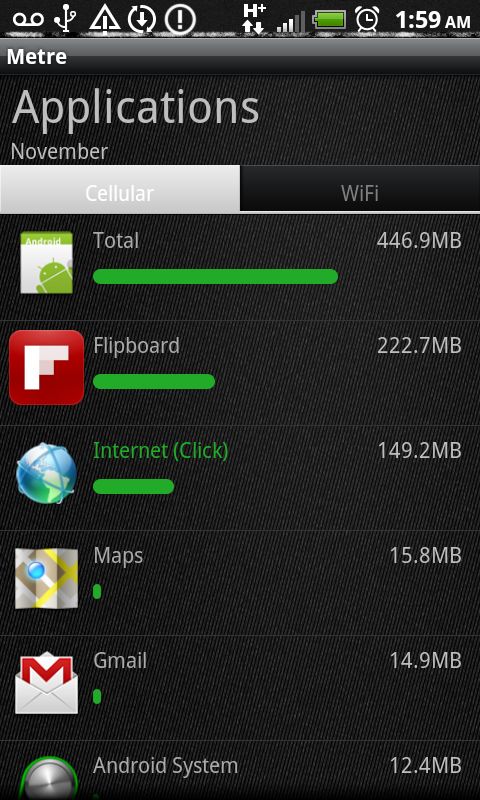
Figure 2: Screenshots of Metre UI on Android.
Since the phone uses one interface at a time, this ap-
proach is accurate in assigning the data usage to differ-
droidHttpClient” API. For video and audio playback, ent interfaces, catching even short transitions between
we used APIs that allow us to use URLs as the source. them. When an app uses the Android media stream-
ing API, Android assigns that network consumption to
II.B. Field experiments the Android media service rather than to the app. In
Metre, we monitor which app is in the foreground and
Our lab experiments are useful for comparing differ- appropriately re-assign those bytes to the responsible
ent apps and platforms directly since we control what app.
actions are performed in each app. However, there Metre’s accuracy depends on the accuracy of the
are three main limitations of our lab experiments. All underlying Android APIs. Unfortunately, those APIs
the experiments are done on Wi-Fi, and it is possi- do not include TCP/UDP/IP packet header overheads,
ble that some apps may behave differently on cellu- retransmissions, nor DNS lookups. To quantify this
lar. They do not reflect network consumption by real inaccuracy, we present Table 4 where we compare the
users. They only measure foreground activity of apps, size of the specific network transfers in Table 3, as
not their periodic background activity. To overcome reported by packet traces and as reported by Metre.
these limitations and to understand user behavior in We feel that this difference, due to header overheads
the wild, we deployed an app on Android. and DNS overheads, does not alter the findings from
our comparative analysis.
II.B.1. Metre: data collection app
II.B.2. User population
We developed an app called Metre for Android smart-
phones. The data usage of each app on Wi-Fi and cel- We deployed Metre in Google Play in February
lular is measured and shown to the user, as in Fig- 2012 10 . Based on users’ feedback and early data anal-
ure 2. The user can select three time periods to see ysis, we made bug fixes and performance improve-
usage over – the current month, week, or day. For ments and released a major update. We finally retired
each app, Metre collects the following seven pieces of the app in May 2013.
data per day: bytes sent and bytes received on each The US population is undergoing a shift from wide
of Wi-Fi, cellular, and USB, and also the app fore- availability of unlimited cellular data plans (29%
ground time. The app foreground time measures the of US subscribers had unlimited data in December
time that the app is visible on the screen. At the end 2010 [1]) to strict caps or throttling. To avoid the im-
of every day, Metre attempts to upload that day’s data pact of usage limit rate throttling on our analysis, we
(typically a few KB in size) to a server in the cloud. avoid US subscribers. Instead, we focus on the coun-
This data is accompanied by configuration informa- try of India, where operators tend to charge by actual
tion – the phone model, the network operator name, data consumed 11 and unlimited plans are compara-
Android OS version, and the current time zone. If the tively much more expensive and rarely used.
upload fails, Metre will queue it and retry periodically. Android 2.2 and 2.3 together account for 60.9% of
To measure data consumption, Metre uses two An- the market 12 even as of December 2012, and we be-
droid APIs – TrafficStats.getUidRxBytes(appID)
10
and TrafficStats.getUidTxBytes(appID). Since covered under Rice University IRB approval #12-098X
11
http://newamerica.net/publications/policy/an_
these APIs do not distinguish between cellular, Wi-Fi, international_comparison_of_cell_phone_plans_and_
and USB consumption, Metre registers for notifica- prices
12
tions for network interface changes, calls the Traffic- http://developer.android.com/about/dashboards/700 other 927kb
lieve these older versions are used predominantly in 600 video
bytes (x1000)
India and other emerging markets. Hence we use the 500 image
400 text
2.2 and 2.3 versions of the relevant APIs to collect 300
data consumption, and tuned our app’s performance 200
100
and stability for these versions. To increase participa- 0
tion, we advertised Metre through the AdMob mobile
advertising network, specifically targeting India.
In the 2 months since the last update to our app, we
have collected data for over 600 users. After filtering 700 1.1mb 1mb other
out non-Indian users (using time-zone and operator 600 video
bytes (x1000)
500 image
name), and those with fewer than 5 days of records, 400 text
we have 387 users from 2012-10-01 to 2012-12-03. 300
200
100
0
III. Lab Results
We now present results from running apps in the lab.
We designed these experiments to not necessarily be
representative of typical user consumption, but instead 175 463kb 377kb other
150 video
bytes (x1000)
to directly compare apps and platforms. 125 image
100 text
75
50
III.A. Weather apps 25
0
There are a lot of apps in each of the three smart-
phone marketplaces. We obviously expect some apps
to consume more wireless data than others, such as
a video streaming app versus a calculator app. How-
ever, we expect apps with similar functionality to con-
Figure 3: Data consumption by a variety of popu-
sume roughly the same number of bytes. We test this
lar, free weather apps on platform 1 (top), platform
hypothesis by picking weather apps. Unlike other cat-
2 (middle), and platform 3 (bottom). Each app was
egories such as “utilities” or “entertainment”, we ex-
used to request weather for Houston, TX. Each app
pect weather apps to provide similar, generally unam-
was run twice in immediate succession and both val-
biguous features – weather forecasts for your location.
ues are plotted. The vertical axes are chopped, and
In Figure 3, we show the total data consumption of lines exceeding that are labeled with the total transfer
weather apps on each of the three platforms. Each bar size.
is color-coded to show the size of the content types
that were downloaded, as described in §II. There is
a tremendous difference in how many bytes weather ible. However, as the figures show, the text fraction of
apps consume. One app consumes as little as 7KB in the download varies.
a launch, while others consume over 1MB. This is a To avoid including any extra transfers as a result of
staggering difference of over 140X. Neither extreme first time setup, we ran each app twice, followed by a
is a single data point – there are other apps that have week of not using the app, and then ran the app again
similarly low data consumption, and others with sim- twice to capture traces for these results. Hence we do
ilarly high consumption, on all three platforms. not expect these results to have variability from some
These findings are surprising to us for several rea- apps downloading logos and icons on first launch, and
sons. We ran each app simply to the point where we other apps including such content in the app install
see the current weather and the weather forecast. We package itself. With 4 exceptions, in almost all cases
did not explore any possibly additional features of an the second run of the app consumes fewer bytes to
app, such as high-definition video streams of torna- varying degrees. This is presumably due to implicit
does. Hence we expected the majority of network caching of HTTP content by the underlying OS, or
downloads to be simply the text of weather conditions explicit caching by the app itself.
and forecasts, which are small and highly compress- There are interesting implications for the user. The
data-conscious user has to be vigilant even when
index.html choosing between weather apps – a type of app that1200 other 2.9mb 3.6mb cache between runs. The only app with almost simi-
1000 video 3.3mb
bytes (x1000) 800 image 3.5mb lar consumption is YouTube, which is between 3.3MB
600 text and 3.6MB on the three platforms. This unexpected
400 finding is not simply explained away by the platform
200
0
– no one platform is consistently lighter than another.
2-Walgreens
3-Walgreens
1-Walgreens
1-YouTube
2-YouTube
3-YouTube
1-Amazon
2-Amazon
3-Amazon
1-CNN
2-CNN
3-CNN
1-Fandango
2-Fandango
3-Fandango
1-GasBuddy
2-GasBuddy
3-GasBuddy
1-Yelp
2-Yelp
3-Yelp
1-Facebook
2-Facebook
3-Facebook
1-Fragger
2-Fragger
3-Fragger
1-WeatherChannel
2-WeatherChannel
3-WeatherChannel
As a user, this can have a major impact on my data
consumption depending on what apps I rely on. Sup-
pose a user primarily uses Amazon, Facebook, Fan-
dango, GasBuddy, and Walgreens, and uses each of
Figure 4: Data consumption by a variety of popular them with the same frequency and performing the
apps on the three platforms. Each app was written by same operations as we did. If the user picks platform
the same company for all three platforms. The vertical 1, his data consumption will be 2.8X worse than if he
axis is chopped for clarity, and lines exceeding that had picked platform 2, and 3.3X worse than if he had
are labeled with the total transfer size. The name of picked platform 3. A different combination of apps
the app is prefaced with the platform number. The and different frequency of use may point to a different
results are from two runs of each app. These are not platform as the worst offender. Users have little in-
the first runs of the app after install, but rather runs sight today on the impact of the choice of smartphone
after a week of no use. platform on the cost of their data plan.
A cellular operator that sells all three smartphone
platforms may choose to adjust their marketing based
one may otherwise not think would be a data hog. An on such information. Advertising campaigns often
OS platform or cellular operator may want to factor target specific market demographics (e.g. the social
in the data consumption of apps before promoting one user, or the gamer, or the movie fan), and an opera-
app over another in the marketplace. tor may want to use a different platform to push to
each demographic. An operator that wants users to
III.B. Popular apps conserve data may pick the lightest platform for each
demographic. Conversely an operator that wants to
There remain several questions. Why is there such make the most money from overage charges will want
a big difference in consumption between apps? Are to pick the worst platform for each demographic.
some apps providing more functionality? Are any of
the platforms inherently more data consuming? Are
III.B.2. Differences at the HTTP layer
some apps not using standard cache controls or com-
pressing network transfers? To understand these in In these apps, the majority of network data is trans-
more depth, we now examine top apps that we can ferred over HTTP. There is little use of UDP, perhaps
directly compare across the three different platforms. because we did not test a VoIP app such as Skype.
Since the majority of traffic is HTTP, we can exam-
III.B.1. Differences between platforms ine the network caching and compression behavior of
these apps. Table 5 shows the percentage of HTTP
Figure 4 shows the data consumption of these apps transfer bytes in each app where either the client or the
across the three platforms. As before, each app has server explicitly set a no-cache directive, or either the
been run before, followed by a week of no use, and client did not specify it can accept compressed content
then run twice while collecting packet traces. For or the server did not compress the response.
brevity, we show the first of those latter two runs. Since we are examining traces for a repeated run of
To a large extent, we expect the functionality of an app, we expect the transferred bytes to be domi-
the same app by the same author across all three plat- nated by dynamic content, such as the latest news or
forms to be the same. Yet, we see a significant varia- movies list. Interestingly, only in a relatively small
tion in network consumption. For example, the CNN number of cases is the app explicitly specifying a no-
app consumes 186KB on one platform but over 1MB cache primitive in HTTP requests. Doing so forces
on the other two. Fandango consumes almost 1MB the HTTP request to hit the network. It is possible that
on one platform, but 224KB and 377KB on the other most app developers are being network friendly. Al-
two. Fragger on platform 2 consumes a huge number ternatively, most app developers may simply be lazy
of bytes, and most of the bytes are spent on high res- and not write the additional line of code to specify a
olution sprite images that the app does not appear to cache header in the HTTP request. Due to this behav-app % of bytes where encoding is on by default 16 . If the app developer uses
no-cache by no-compress by
client server client server “AndroidHttpClient” instead, it is off by default and
Platform 1 the “modifyRequestToAcceptGzipResponse” method
Amazon 0 0 1 100
CNN 0 5 100 100 has to be called to enable it 17 .
Facebook 0 0 0 98 Hence it is not surprising that for the outgoing
Fandango 0 0 97 100
Fragger 0 1 2 100
HTTP requests from these apps, some specifically
GasBuddy 0 0 54 95 identify that they can accept compressed content,
Walgreens 0 0 100 100 while others do not. However, what is surprising is
Weather Channel 0 1 0 70
Yelp 0 0 0 68 that despite some use of the compress header in the
YouTube 0 29 1 62 client requests, almost all of the server responses are
Platform 2
Amazon 85 0 0 91 not compressed. Some of this behavior is explained
CNN 98 2 0 67 by the type of content – video and image content will
Facebook 4 10 1 80
Fandango 37 4 0 65
typically already be compressed, so the server may
Fragger 94 0 0 100 have rules not to apply additional compression on top
GasBuddy 0 0 0 98 of that. However, as Figure 4 shows, there is still a sig-
Walgreens 0 0 0 100
Weather Channel 0 0 0 91 nificant fraction of text content downloaded by many
Yelp 39 1 0 97 apps. We believe that most of this text content is dy-
YouTube 0 4 87 94
Platform 3 namically generated content from the server. To com-
Amazon 52 0 52 100 press such content, web server administrators have to
CNN 0 0 24 100
Facebook 0 0 55 100
enable it. In dynamic compression, any dynamically
Fandango 1 1 100 100 generated content will first be passed through gzip
Fragger 93 93 7 97 before going over the network. Administrators are
GasBuddy 12 0 84 84
Walgreens 1 0 100 100 sometimes cautioned 18 against enabling it for fear of
Weather Channel 0 0 0 96 increasing per-request server processing time, thereby
Yelp 0 0 49 100
YouTube 89 4 90 96 limiting scalability.
Our recommendation to app developers is to take
Table 5: HTTP caching and compression statistics for the effort to add the appropriate headers and/or li-
professional apps on three platforms braries to turn the compression on in the app, and en-
able it on web servers for dynamic content. For ex-
ior, we see a significant reduction in the number of ample, on platform 1, the CNN app transfers 48% of
bytes transferred for most of these apps if we imme- total bytes as uncompressed text. On platform 2, the
diately run them again. Walgreens app transfers 79% as uncompressed text.
Desktop browsers accept compressed content, On platform 3, the Yelp app transfers 67% as un-
which increases download speed by reducing the compressed text. Plain text, XML, JSON and HTML
number of transferred bytes from the server. How- are highly compressible, and achieving even a decent
ever, smartphone platform support for it is mixed. On compression savings of 60% can cut the total down-
WP 7.x, the underlying platform does not, but app de- loaded bytes in half for some apps.
velopers may add that header to outgoing HTTP re-
quests and use third-party libraries to decompress the III.C. Custom apps
response 13 . On iPhone, the HTTP API 14 supports de-
As we have just shown, the choice of app and plat-
compressing content that has been compressed by the
form can have a big impact on data consumption. In at
server, but there is confusion out there on whether the
least one case, the choice of API can also impact data
iPhone API specifies the compression option by de-
consumption because of the presence or lack of HTTP
fault to outgoing requests 15 . On Android, if the app
compression. Do any of the other network-consuming
developer uses the “HttpURLConnection” API, gzip
APIs behave differently between the three platforms?
13
http://www.sharpgis.net/post/2011/08/28/GZIP- We now examine these APIs via our custom apps that
Compressed-Web-Requests-in-WP7-Take-2.aspx
14 16
http://developer.apple.com/library/mac/ http://developer.android.com/reference/java/
#documentation/Cocoa/Reference/Foundation/ net/HttpURLConnection.html
17
Classes/NSURLConnection_Class/Reference/ http://developer.android.com/reference/
Reference.html android/net/http/AndroidHttpClient.html
15 18
http://www.bigevilempire.com/codelog/entry/ http://technet.microsoft.com/en-us/library/
nsurlconnection-with-gzip/ cc753681(v=ws.10).aspxplatform 1 platform 2 platform 3 can also increase consumption.
app bytes bytes bytes
Audio 6,582,117 6,052,078 5,984,775 These differences add up in apps that use multiple
Audio 6,609,732 6,032,148 6,052,678 network API calls to build their user experience. Even
Map 96,330 3,696,819 373,633
Map 27,045 221,603 7,733 apps that provide a “simple” function of weather fore-
Socket 1,778 1,853 1,564 casts can have 140X difference in consumption. De-
Socket 1,636 1,448 1,468
Text 152,693 53,086 145,721
pending on which apps a user runs and how often,
Text 147,941 0 730 picking the wrong platform can cost the user.
Video 8,274,370 8,373,289 8,234,287 While these experiments are useful for examining
Video 8,266,237 8,419,384 8,211,878
Web page 46,125 45,140 45,197 apps, platforms, and APIs in isolation, they miss the
Web page 4,756 4,457 4,419 user behavior aspect of the problem. We now look at
real users and their consumption patterns.
Table 6: Bytes consumed when exercising six com-
mon APIs across the three smartphone platforms.
Each network operation is done twice, and listed in IV. Results from Field Data
order. We now examine the data we collected from Android
users. The basic question we seek to answer is: how is
we described in § II.A.3 data consumed in the field? We break this down into
more specific questions:
Table 6 lists the bytes consumed. In general, the
numbers roughly match the sizes of objects that we • Is there a temporal pattern of data usage?
transfer in Table 3. Platform 2 downloads an egre- • How do various apps contribute to data usage?
giously large number of bytes (over 3MB) for maps, • How are heavy and light data users different?
while the other two platforms consume about a tenth • What factors can indicate that a user is a heavy
of that. We suspect that the platform is prefetching or light data user?
surrounding map tiles in case the user scrolls around. Answers to these questions will not only help cellular
Platform 3 is particularly good about caching pre- operators price data plans but also provide insights for
viously downloaded map tiles. The socket transfer developers to promote their apps.
numbers are unsurprisingly similar to the transfer size
– there is little room for overhead beyond standard
IV.A. Data set and analysis methods
packet headers and DNS lookups. When transferring
the text file, we use standard HTTP APIs with default We focus on data from Metre from September 30 to
options on all three platforms – the one we use on December 3, 2012. We only use the data from 387
platform 2 sets a compression header by default and smartphones from India for which we have at least five
hence its download size is lower. Platforms 2 and 3 do days of data. The median duration of data per user
a good job of caching the previously downloaded re- is 25 days, the median number of apps that ran on a
sult. There is some overhead in the video transfer, but phone is 50, and the median amount of data used per
that is largely due to headers. The web page transfers user is 16 MB/day. Mathematically, the data set can be
show similar numbers. The HTML part of the web described as {u(i, j, d) : i ∈ P, j ∈ A, d ∈ Di } where
page is likely being transferred as compressed content P is the set of users, Di the set of days in which data
because the browser itself is embedded in the app. from user i ∈ P is collected, and A the set of apps
observed. And u(i, j, d) can denote any one of the
III.D. Summary following types of use: time duration, cellular data,
Wi-Fi data, and total data. Table 7 summarizes the
Our lab experiments have quantified a number of dif- mathematical notations we use in the rest of the paper.
ferences in data consumption that have implications Since a user could install and uninstall Metre on
for users, app developers, OS developers, and cellular any day, we have different numbers of days of data
operators. There are subtle differences between APIs for each user. Figure 5 shows the number of users we
that the three major platforms expose that can add up have on each day. Figure 6 shows a CDF of how many
to a significant number of bytes. Support for HTTP days of data we have across these users, or |Di |.
content compression is mixed and can have a big im- App Usage: Our users used a diverse set of apps.
pact on text transfers. Apps that make heavy use of We show the data consumption of the 10 most popular
maps APIs should understand how many bytes the OS apps as a CDF across all users in Figure 7. This figure
is transferring underneath. Lack of caching of maps conflates two factors – how much data an app con-
and HTTP content between repeated runs of an app sumes and how much time a user spends in the app.1
culmulative fraaction of users
symbol description
0.8
D set of days of data collection Quick search
0.6 Voice search
P set of users of data collection
Di set of days for which we have data from user i ∈ P Gmail
0.4 Music
A set of apps observed
Gallery
u(i, j, d) use∗ by user i ∈ P through 0.2 Google Maps
app j ∈ A on day d ∈ Di YouTube
v(i, j) daily average use by user i ∈ P through app 0 Browser
j ∈ A during Di . v(i, j) = |D1 | d∈Di u(i, j, d)
P
0 1 2 3 4 Facebook
5
i average daily data consumed (MB) Play store
w(i, d) i ∈ P on day d ∈ Di .
use by userP
w(i, d) = j∈A u(i, j, d)
x(i) P use by user i ∈ PP
daily average during Di . Figure 7: CDF of average bytes consumed per day for
x(i) = j∈A v(i, j) = |D1 | d∈Di w(i, d)
i 10 most popular apps across all users. Legend lists
y(j) P use by app j across all users.
daily average
y(j) = i∈P v(i, j)
lines in order from top to bottom.
phone model screen # of
Table 7: Important notations. ∗ use can be either time size (00 ) resolution users
Samsung GT-S5360 3 240x320 180
duration, cellular data, Wi-Fi data, or total data. Samsung GT-S6102 3.14 240x320 141
Samsung GT-S5830i 3.5 320x420 72
Samsung GT-S6802 3.5 320x420 51
250 Samsung GT-S5300 2.8 240x320 37
Samsung GT-S7500 3.6 320x480 27
200 Samsung GT-S5830 3.5 320x480 26
Samsung GT-S5570 3.14 240x320 24
# users
150 Samsung GT-S5670 3.3 240x320 20
Sony Ericsson ST25i 3.5 480x854 19
100 HTC Explorer A310e 3.2 320x480 18
Samsung GT-S5302 2.8 240x320 17
50 Samsung GT-I9100 4.3 480x800 17
Sony Ericsson WT19i 3.2 320x480 13
0 Samsung GT-I9003 4.0 480x800 12
1 7 13 19 25 31 37 43 49 55 61 Micromax A75 3.75 320x480 11
# days Samsung GT-I9070 4.0 480x800 10
Figure 5: Number of users per day during the two Table 8: Characteristics of the most popular phones.
months of data collection.
400 at least once during the data collection. All but 2 users
350 have used cellular data at least once. 5% of them used
300 Wi-Fi every day for which they used any data.
# of users
250
Data Normalization: To compare users and com-
200
150 pare apps, we use the average daily data consump-
100 tion by either users, apps, or both. This removes the
50 bias from unequal number of days recorded from each
0 user, and we only consider users with at least 5 days
5 10 15 20 25 30 35 40 45 50 55 60
# of days of data. We use three types of daily averages, as de-
scribed in in Table 7: v(i, j) and x(i) and y(j) . When
Figure 6: CDF of number of days of data collected we consider top apps, either by data consumption or
across all users. We ignore users under 5 days. time spent, we only consider those apps that had at
least 10 users and at least 10 days of usage across all
users, to further eliminate outlier bias.
As a result, while we would expect YouTube to be the
right-most curve in this graph, it is actually in the mid-
dle, in part because users spend more aggregate time IV.B. Temporal pattern of data use
in apps such as the browser and Facebook. In the next Our data set may be too small to draw definitive con-
subsection, we tease these factors apart. clusions on temporal patterns in wireless data use.
Smartphone Models: The data includes at least Our analysis results suggest the absence of obvious
121 models of smartphones. Table 8 lists the charac- ones. Figure 8 shows how daily data use by all users
teristics of the top 10 devices by number of users. changes during the two months of data collection.
Network Access: 32% of users used Wi-Fi for data Daily data use goes up and down significantly twice20 10000
daily GB across all users
Wi-Fi usage 1000
16
average MB/day
Cellular usage 100
12 10
8 1
0.1
4
0.01
0 0.001
0 1 2 3 4 5 6 7 8 0 50 100 150 200 250 300 350 400
measurement collection week user
Figure 8: Daily data use, aggregated across all users. Figure 10: Average daily data use of all users ranked
from the least to the most, each data point being x(i)
0.5 (i is user). The vertical axis is on a log scale.
Lowest power frequency (1/day)
0.45
0.4
0.35 IV.C. Heavy apps
0.3
0.25
We now consider y(j), which is the average daily data
0.2
0.15
use by app j. We use this value to identify the top 10
0.1 heavy apps by data usage. We also calculate this by
0.05 time usage instead, and identify the top apps by time
0 consumption.
0 0.1 0.2 0.3 0.4 0.5
Highest power frequency (1/day) Table 9 shows the top 10 apps in terms of time use
and the top 10 apps in terms of data use. There is
a large overlap between the top data and top time use
Figure 9: Frequency spectrum of daily data per user.
apps. The two groups share six apps. The apps unique
to the top time group are local media playback apps
and a screen lock app that do not require Internet ac-
in the first month, corresponding to our two advertis- cess for every launch, and a text messaging app that
ing campaigns to promote Metre in Google Play. Me- produces only a little data traffic. In contrast, the apps
tre continues to gain and lose users along the way but unique to the top data use group are players of online
the daily data use changes seem to be random without media, i.e., tubemate and realplayer, and file down-
any apparent periodicity that may suggest a weekly or load. It is interesting to note that ibibo.mtt, a third-
biweekly pattern. party browser, uses more than five times data per hour
We further examine if there is any temporal pattern than android.browser, the built-in browser.
in individual user’s daily data use. We examine the
127 users for whom we have at least 28 consecutive
days of data. We treat each user’s daily data use as
a time series and apply FFT to it to obtain its fre- IV.D. Heavy users versus light users
quency spectrum. We then examine the spectrum to
see if there is any frequency that has unusually high Users are very different in their daily data usage. Fig-
power to suggest there is a temporal pattern at that ure 10 is a histogram of average data consumption per
frequency. For conciseness, we characterize a user day across all users. The median is around 16 MB.
based on the highest and lowest power frequencies as We now examine the difference between the top and
a single data point in Figure 9. If there is no tempo- bottom thirds of the users in terms of daily data usage,
ral pattern common to users, the data points should be i.e., x(i) for data use. We call the top third users heavy
uniformly, randomly distributed in the figure, which users and the bottom third light users. We denote them
is what the graph shows. Although we see few more with sets H and L, respectively. P The average daily
dots toward the left side of the graph, it is likely FFT data use by the heavy data users, Pi∈H x(i), is 84.5
artifacts from users with slightly more than 28 days of MB while that by the light users, i∈L x(i), is 5.4
data. Notably, we do not observe any concentration MB, or 16X smaller. We focus on comparing heavy
of data points for frequency of 1/7, which would have and light data users in order to reveal what factors are
suggested a weekly periodicity. correlated to the difference in daily data use.y(j) popularity
app MB hours |MB| |hours| # of users % of users
devian.tubemate.homeF 1068.59 6.86 0.61 0.06 45 11.63
com.sec.android.providers.downloadsF 329.84 0 0.19 0 147 37.98
com.tencent.ibibo.mttF 187.27 5.76 0.11 0.05 40 10.34
com.real.RealPlayerF 165.50 1.03 0.09 0.01 26 6.72
com.android.vending†F 1097.37 32.44 0.62 0.29 386 99.74
com.facebook.katana†F 742.32 36.41 0.42 0.32 237 61.24
com.google.android.youtube†F 724.26 13.41 0.41 0.12 309 79.84
com.UCMobile.intl†F 621.76 17.79 0.35 0.16 98 25.32
com.opera.mini.android†F 343.10 35.50 0.19 0.32 151 39.02
com.android.browser†F 332.61 72.15 0.19 0.64 363 93.80
com.whatsapp† 137.02 33.64 0.08 0.30 158 40.83
com.jiubang.goscreenlock† 77.47 30.98 0.04 0.28 37 9.56
com.cooliris.media† 146.18 29.20 0.08 0.26 309 79.84
com.android.music† 35.53 14.71 0.02 0.13 274 70.80
Table 9: Heavy apps measured by total data and time use. F top data apps; † top time apps
IV.D.1. Comparing Usage different. Hence we calculate the normalized vectors
for data and time consumption. We can compare two
We employ two techniques to compare usage by normalized vectors by calculating the smallest angle
heavy and light users. In both techniques, we iden- between them – the minimum angle of 0◦ means that
tify the top 10 apps by the heavy user, Am H , and those the two vectors are the same, and the maximum angle
m
by the light user, AL , in terms of use m, which can of 90◦ means that they are opposites. If we compare
be time or data use. That is, the top 10 apps are the the data normalized vectors for heavy users and light
10 apps with the highest y(j) aggregated over each users, the angle between them is 54.8◦ . This indicates
group. We focus on these two sets of apps while ig- that the data they spend across these different top apps
noring the rest. The rationale is that the top 10 apps is significantly different. The angle between the nor-
account for over 80% of the usage of m [3, 14]. malized time vectors is 34.5◦ , which is much smaller
First, we show how AL overlaps with AH . Next, than that between the data normalized vectors. That
we define a vector V = {v1 , v2 , ..., v|AL ∪AH | } to in- is, how heavy and light data users spend their data
dicate the use of each app in AL ∪ AH . Let VL de- is relatively more different than how they spend their
note the use vector by the light users and VH that by time among these top data apps. This difference is not
the heavy users. We compare the usage by the two explained by simply different top apps being used or
groups quantitatively with the absolute distance be- simply different amounts of time spent on top apps.
tween their vectors, i.e., ||VL − VH ||, and the cosine
similarity between their vectors, which measures the
angle between the two vectors in this space [12]. IV.D.3. Top apps by time use
Similar to the previous analysis, we now examine the
top apps where heavy and light data users spend most
IV.D.2. Top apps by data use of their foreground time (as opposed to those apps
where they spend most of their data). In Table 11, we
We first examine the top 10 apps by data use for again see some apps are common to both sets of users
heavy and light data users, shown in Table 10. There – web browsers, Facebook, and so on. Interestingly,
are apps where both sets of users spend a lot of data heavy users spend a lot of time in YouTube, while
bytes – three browsers, Facebook, YouTube and the light users spend a lot of time in Deskclock and Bub-
app marketplace. However, heavy users tend to spend bleShooter – two apps that consume very little data.
more bytes on apps that download files and videos – For the top time apps, the angle between the nor-
RealPlayer, MyFiles, TubeMate. In contrast, a larger malized vectors for data is 44◦ , and that for the time
fraction of data bytes for light users are spent in com- vectors is 34.7◦ . While the angle between the nor-
munication apps – email, Skype, WhatsApp. malized vectors for time is similar to those reported
The table also shows how many bytes and how above for top data apps (34.7◦ vs. 34.5◦ ), the angle
much time the two sets of users spent in these apps. between the normalized vectors for data is smaller
These two vectors are hard to directly compare be- than that reported above for top data apps (44◦ vs.
tween heavy users and light users because in part the 54.8◦ ). This means that the difference between how
magnitude (how much data a user spends overall) is heavy and light users consume data from the top timeP P
heavy users ( i∈H v(i, j))) light users ( i∈L v(i, j))
app MB hours |MB| |hours| # users MB hours |MB| |hours| # users
com.cooliris.mediaF 124.14 11.87 0.08 0.25 92 4.69 7.51 0.03 0.29 109
com.real.RealPlayerF 164.95 0.22 0.10 0.00 13 0.07 0.33 0.00 0.01 2
com.UCMobile.intlF 549.28 11.76 0.35 0.25 47 5.48 1.03 0.04 0.04 15
devian.tubemate.homeF 1034.20 5.18 0.66 0.11 25 7.19 0.46 0.05 0.02 8
com.android.browser†F 166.56 35.87 0.11 0.75 123 52.35 14.41 0.35 0.55 116
com.android.vending†F 522.10 12.84 0.33 0.27 127 111.81 4.82 0.75 0.18 126
com.facebook.katana†F 529.55 14.16 0.34 0.30 82 69.11 9.08 0.46 0.35 64
com.google.android.youtube†F 621.90 10.47 0.39 0.22 110 16.03 0.60 0.11 0.02 90
com.opera.mini.android†F 214.52 11.47 0.14 0.24 54 25.71 7.92 0.17 0.30 41
com.sec.android.providers.downloads†F 240.48 0.00 0.15 0.00 47 17.67 0.00 0.12 0.00 39
com.android.email† 5.31 0.75 0.00 0.02 55 10.19 1.35 0.07 0.05 62
com.google.android.apps.maps† 20.04 2.37 0.01 0.05 115 11.78 1.47 0.08 0.06 120
com.viber.voip† 2.03 0.36 0.00 0.01 18 8.37 1.12 0.06 0.04 23
com.whatsapp† 49.95 7.25 0.03 0.15 41 28.48 15.76 0.19 0.60 57
Table 10: Heavy users and light users, H and L, in their top apps by data consumption. F top data consumer for
heavy users; † top data consumer for light users
P P
heavy users ( i∈H v(i, j)) light users ( i∈L v(i, j))
app hours MB |hours| |MB| # users hours MB |hours| |MB| # users
com.google.android.youtubeF 10.47 621.90 0.34 0.61 22 0.59 13.18 0.03 0.17 90
com.jiubang.goscreenlockF 13.04 31.40 0.42 0.03 113 5.24 4.38 0.23 0.06 4
com.UCMobile.intlF 11.76 549.28 0.38 0.54 60 1.04 5.53 0.05 0.07 16
com.android.browser†F 35.87 166.56 1.15 0.16 123 14.36 51.40 0.63 0.66 116
com.android.music†F 5.37 21.23 0.17 0.02 81 4.17 4.17 0.18 0.05 92
com.android.vending†F 12.84 522.10 0.41 0.51 127 4.85 109.74 0.21 1.40 126
com.cooliris.media†F 11.87 124.14 0.38 0.12 88 7.51 4.69 0.33 0.06 109
com.facebook.katana†F 14.16 529.55 0.45 0.52 86 8.99 65.89 0.40 0.84 64
com.opera.mini.android†F 11.47 214.52 0.37 0.21 17 8.10 26.80 0.36 0.34 42
com.whatsapp†F 7.25 49.95 0.23 0.05 45 15.65 28.21 0.69 0.36 56
com.sec.android.app.myfiles† 5.13 13.06 0.16 0.01 59 2.94 2.55 0.13 0.03 78
com.wssyncmldm† 0.80 0.32 0.03 0.00 44 2.60 1.17 0.11 0.01 22
util.sms† 2.22 19.05 0.07 0.02 28 4.46 7.00 0.20 0.09 15
Table 11: Heavy users and light data users, H and L, in their top apps by foreground time. F top time consumer
for heavy users; † top time consumer for light users
apps is smaller than that between how they consume categories) as defined by cellular data usage (§IV.D).
data from the top data apps. This suggests that the This dependent variable is ordinal. That is, there is
heavy and light users are more different in how they a simple ordering between the categories, i.e., heavy
consume data via their top data apps. users are those users who use more data than other
users. The ordered probit analysis calculates the prob-
IV.E. Indicators of heavy data use ability of a user being a heavy or light user or in-
between, based on the independent variable(s). These
Based on our findings so far, we identify a candidate
probabilities can then be used for prediction by pick-
set of variables that may be correlated with being a
ing the most probable outcome. The prediction ac-
heavy or light user. We now employ regression and
curacy will be 33% when there is no dependency be-
correlation analysis to quantify this. Note that we
tween independent and dependent variables and the
identify correlation between variables, not causal re-
prediction is purely random. As our input to each
lationships. Knowing such correlations can be useful
analysis, we measure and use the value of the indepen-
for cellular operators, who may want to tailor their ad-
dent variables for each user. Therefore, each analysis
vertising or data plans to specific customers.
has 387 input values.
The technique we use here is the ordered probit
analysis, which is a form of the regression analysis Table 12 summarizes the ordered probit analysis re-
that allows for an ordinal categorical dependent vari- sults with different independent variables. Below we
able. Regression analysis is a technique to estimate summarize the main findings.
the relationship between dependent variables, or re- First, Wi-Fi usage is a mild indicator of cellular
sponses, and independent variables, or predictors. The usage. As our independent variable in this analysis,
dependent variable in our analysis is whether a user is we use a binary variable that indicates whether a user
a heavy user, a light user, or an in-between user (3 used Wi-Fi at all in our collected dataset. In fact, theindependent variable(s) prediction accuracy V. Related work
Wi-Fi 43%
screen size and resolution 40%
average time use 49%
Wireless traffic characterization: Xu et al. [15]
heavy apps 46% characterized app usage by examining packet traces
light apps 36% from a large cellular operator. Their packet traces
altogether 58%
cover a large number of users in the US and there are
Table 12: Accuracy of predicting whether a user is many interesting findings on the geographic locality
a heavy user, or light user, or in-between user using of apps. Our goals are different and require us to do
different independent variables in the ordered probit lab experiments and collect traces from phones, and
analysis. Random guesses can do no better than 33%. would be difficult to achieve with packet traces. Since
they rely on the HTTP User-Agent field to identify
apps, they are unable to attribute non-HTTP traffic
users who used Wi-Fi (125 users out of 387), used nor apps that embed browsers. Email, YouTube and
a median of 6.4 MB of cellular data per day, while browser usage can only be indirectly inferred and are
the users who did not use Wi-Fi at all used a me- hard to study in depth. Their packet traces do not in-
dian 16.3 MB of cellular data per day, which further clude Wi-Fi usage, and do not indicate how long a
demonstrates a (negative) correlation between Wi-Fi user ran an app for. They do not compare different
and cellular usage. smartphone platforms in depth nor directly compare
individual apps with similar functionality.
Second, a smartphone’s screen size and resolution
Falaki et al. [3] studied the behavior of 255 An-
shows a mild correlation with data usage. The inde-
droid and Windows Mobile users. They found tremen-
pendent variables for the screen size and resolution are
dous diversity in total data consumption and interac-
the size in inches and the number of pixels, respec-
tion time among different users. Similar findings were
tively. This finding goes against common intuition
made by LiveLab [12, 14] which measures the smart-
that better and larger screens result in higher data us-
phone usage of 34 iPhone users. Unlike Metre, these
age. The reasons for this intuition are that apps might
tools cannot breakdown network traffic by app. As a
download content with higher resolution for better
result, they did not investigate per-app data usage.
screens, and that a larger screen size makes it easier
There have also been several studies [2,7,10,11] on
for the user to browse webpages and apps. However,
network performance and how app traffic leads to ex-
our data includes a limited set of screen sizes and res-
cessive energy consumption on smartphones. In par-
olutions, so this finding may be premature.
ticular, periodic measurements and transfers, although
Third, total usage time of a smartphone is a decent small in terms of traffic volumes, may consume a dis-
indicator of data usage. The longer one uses the smart- proportionately large amount of energy.
phone, the higher the data usage is likely to be. The in- Caching and prefetching: Qian et al. [9] showed
dependent variable in this analysis is the average daily that most HTTP caching library implementations on
time use of a user (the sum across all apps). Usage of smartphones do not conform to the HTTP specifica-
heavy apps (Table 10) is also a decent indicator of data tions, nor do all apps effectively leverage caching op-
usage. However, the converse is not true – light apps portunities, resulting in redundant transfers. Prefetch-
are poor indicators. As our independent variables, we ing may reduce user-perceived latency, but the
use the number of top 3 heavy apps and the number of prefetched content that is not used results in wasted
top 3 light apps that a user has ever used. Heavy apps network consumption. Higgins et. al. [6] developed
are a decent indicator because they consume signifi- a prefetching library for mobile devices to optimize
cant amounts of data, and therefore, have a noticeable prefetches and reduce waste.
impact on a user’s data usage. Data usage charging: Ha et al. [5] proposed time-
Finally, the combination of these 5 independent dependent pricing, as opposed to conventional usage-
variables can achieve a decent prediction accuracy of based pricing, to incent users to shift traffic to off-peak
58%. Recall that we have three categories of users, so hours. Peng et al. [8] demonstrated that the current
random can do no better than 33%. Cellular operators charging systems employed by cellular operators can
can obtain estimates of these variables for new users be inaccurate, leading to overcharges or undercharges
by asking simple and quick questions, without the in specific scenarios. Our work investigates how the
need for instrumentation of their phones. By know- wireless data usage is correlated with different users,
ing in advance what bucket a user will fall into, the apps, and platforms, which could help cellular opera-
cellular operator can promote different data plans. tors improve their charging schemes. Zhang et al [16]study the additional network traffic cost of free apps ior exists in current apps, and we expect new research
compared to their paid versions. They find that due to and tools to be developed to help app developers au-
advertising and telemetry traffic, the paid versions are tomatically adjust their network usage. Finally, we
cheaper in the long term. specifically targeted users in India for our study, and
Offloading to other networks: Small cells, such it would be interesting to understand how their behav-
as Wi-Fi hotspots and femtocells, can be leveraged ior is different from other parts of the world.
to combat limited spectrum availability. Shifting traf-
fic to these networks whenever available could reduce Acknowledgments
contention at cellular towers. However, it is unclear
if that simply allows users to consume more, or if it The authors thank Zhen Wang for his contributions to
actually reduces consumption at cellular towers. Rah- Metre.
mati et al. [13] designed a system for smartphones to
transparently switch between cellular and Wi-Fi net- References
works without any network support. [1] The comScore 2010 Mobile Year in Review. comScore Market Re-
search.
VI. Conclusion [2] H. Falaki, D. Lymberopoulos, R. Mahajan, S. Kandula, and D. Es-
trin. A first look at traffic on smartphones. In IMC, 2010.
Cellular consumption is a pain point for both users
[3] H. Falaki, R. Mahajan, S. Kandula, D. Lymberopoulos, R. Govin-
and network operators. Especially in countries where dan, and D. Estrin. Diversity in smartphone usage. In ACM MobiSys,
post-paid plans are the norm, users pay for the data 2010.
that their apps consume. There is little clarity on how [4] R. Gilmore. Your life on a smartphone. In HotMobile keynote, 2012.
the choice of app and smartphone impacts data cost.
[5] S. Ha, S. Sen, C. Joe-Wong, Y. Im, and M. Chiang. Tube: Time-
We have studied the data cost of different apps, plat- dependent pricing for mobile data. In ACM SIGCOMM, 2012.
forms, and APIs. From field measurements, we have
[6] B. Higgins, J. Flinn, T. Giuli, B. Noble, C. Peplin, and D. Watson.
examined user behavior. We have found that even for Informed mobile prefetching. In ACM MobiSys, 2012.
a relatively straightforward task of getting a weather
[7] J. Huang, F. Qian, Z. Mao, S. Sen, and O. Spatscheck. Screen-Off
forecast, there is as much as 140X difference in data Traffic Characterization and Optimization in 3G/4G Networks. In
consumption between apps. When comparing apps IMC, 2012.
with the same functionality and written by the same [8] C. Peng, G. Tu, C. Li, and S. Lu. Can We Pay for What We Get in
professional authors across different platforms, there 3G Data Access? In ACM MobiCom, 2012.
is huge diversity in consumption. While no one plat-
[9] F. Qian, K. Quah, J. Huang, J. Erman, A. Gerber, Z. Mao, S. Sen,
form is lighter than another across the board, a user and O. Spatscheck. Web caching on smartphones: Ideal vs. reality.
with particular app habits can consume 3.3X higher In ACM MobiSys, 2012.
data or more if they pick the wrong platform. [10] F. Qian, Z. Wang, Y. Gao, J. Huang, A. Gerber, Z. Mao, S. Sen, and
Operators may want to tailor data plans to users, in- O. Spatscheck. Periodic transfers in mobile applications: Network-
wide origin, impact, and optimization. In ACM WWW, 2012.
cent specific behavior via coupons or rebates, or cus-
tomize their marketing. Operators do not need in- [11] F. Qian, Z. Wang, A. Gerber, Z. Mao, S. Sen, and O. Spatscheck.
Profiling resource usage for mobile applications. In ACM MobiSys,
trusive monitoring to classify users – knowing what 2011.
screen size a user prefers, whether they will use Wi-
[12] A. Rahmati, C. Shepard, C. Tossell, M. Dong, Z. Wang, L. Zhong,
Fi, how long they may use the phone for and for and P. Kortum. Tales of 34 iPhone users: How they change and why
which apps, has the potential for accurately classify- they are different. arXiv preprint arXiv:1106.5100, 2011.
ing the user. Simply identifying a user’s popular apps
[13] A. Rahmati, C. Shepard, C. Tossell, A. Nicoara, L. Zhong, P. T.
and pattern of usage can point to which of the three Kortum, and J. P. Singh. Seamless flow migration on smartphones
smartphone platforms is lowest in data consumption without network support. Technical Report 2010-1214, Rice Uni-
versity, 2010.
for them.
Several areas for future work remain open. Market [14] C. Shepard, A. Rahmati, C. Tossell, L. Zhong, and P. Kortum. Live-
lab: measuring wireless networks and smartphone users in the field.
research studies have been warning us of impending ACM SIGMETRICS, 2010.
overload as a result of video streaming. While we did
[15] Q. Xu, J. Erman, A. Gerber, Z. Mao, J. Pang, and S. Venkataraman.
not see this behavior in our data, we wonder what the Identifying diverse usage behaviors of smartphone apps. In IMC,
impact will be in the future. We did our lab exper- 2011.
iments over Wi-Fi, and it is possible that some apps [16] L. Zhang, D. Gupta, and P. Mohapatra. How expensive are free
adjusted their behavior automatically based on what smartphone apps? In ACM MC2R, 2012.
network they were on. We do not know if such behav-You can also read