The temporal and spatial development of dB/dt for substorms
←
→
Page content transcription
If your browser does not render page correctly, please read the page content below
AIMS Geosciences, 7(1): 74–94.
                                                                    DOI: 10.3934/geosci.2021004
                                                                    Received: 04 January 2021
                                                                    Accepted: 28 January 2021
                                                                    Published: 22 February 2021
http://www.aimspress.com/journal/geosciences

Research article

The temporal and spatial development of dB/dt for substorms

J.M. Weygand*

Department of Earth, Planetary, and Space Sciences, University of California Los Angeles, Los
Angeles, CA, USA

* Correspondence: Email: jweygand@igpp.ucla.edu; Tel: 3108253547.

Abstract: Ground induced currents (GICs) due to space weather are a threat to high voltage power
transmission systems. However, knowledge of ground conductivity is the largest source of errors in
the determination of GICs. A good proxy for GICs is dB/dt obtained from the Bx and By components
of the magnetic field fluctuations. It is known that dB/dt values associated with magnetic storms can
reach dangerous levels for power transmission systems. On the other hand, it is not uncommon for
dB/dt values associated with substorms to exceed prior Pulkkinen and Molinski critical thresholds of
1.5 nT/s and 5 nT/s, respectively, and the temporal and spatial changes of the dB/dt associated with
substorms, unlike storms, are not well understood. Using two dimensional maps of dB/dt over North
America and Greenland derived from the spherical elementary currents, we investigate the temporal
and spatial change of dB/dt for both a single substorm event and a two dimensional superposed epoch
analysis of many substorms. Both the single event and the statistical analysis shows a sudden increase
of dB/dt at substorm onset followed by an expansion poleward, westward, and eastward after the onset
during the expansion phase. The area of dB/dt values exceeding the two critical thresholds from the
initial onset dB/dt values showed little to no expansion equatorward. The temporal and spatial
development of the dB/dt resembles the temporal and spatial change of the auroral emissions.
Substorm values of dB/dt peak shortly after the auroral onset time and in at least one event exceeded
35 nT/s for a non-storm time substorm. In many of our 81 cases the area that exceeds the threshold of
1.5 nT/s is over several million square kilometers and after about 30 minutes the dB/dt values fall
below the threshold level. These results address one of goals of the Space Weather Action Plan, which
are to establish benchmarks for space weather events and improve modeling and prediction of their
impacts on infrastructure. Plain language: The change in the ground magnetic field with respect to
time (dB/dt) associated with magnetic storms (a large disturbance of the magnetic field of the earth)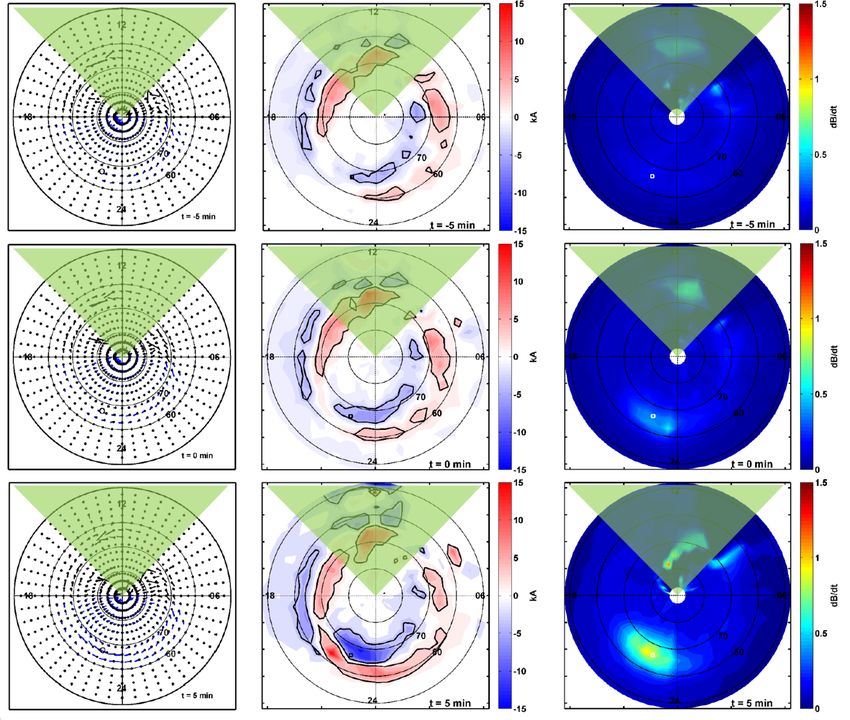
75

can reach dangerous levels for power transmission systems. On the other hand, substorms, which are
a smaller more localized disturbance of the Earth’s magnetic field, are more common. It is not
uncommon for substorm dB/dt values to also exceed dangerous levels and the temporal and spatial
changes of the dB/dt associated with substorms, unlike storms, are not well understood. Our analysis
shows a sudden increase of dB/dt at substorm onset, which peaks shortly after the start of the substorm,
followed shortly after by an expansion northward, westward, and eastward after the onset.

Keywords: ionospheric currents; ground magnetometers; dB/dt; substorms

1.   Introduction

      Geoelectric fields due to geomagnetically induced currents (GICs) [1] associated with space
weather phenomena are a threat to high voltage power transmission systems and oil pipe lines [2].
However, the largest source of uncertainty in determining GICs is our limited knowledge of the ground
conductivity [3,4]. Therefore we must look at other measurements to quantify threats to power
transmission systems. The dB/dts associated with GICs are an excellent proxy for GICs and can be
quickly and easily calculated from ground magnetometers [5]. It has been recently shown there is a
good correlation between the GIC magnitude in New Zealand and the dB/dt determined from the
horizontal component (i.e., the combined X and Y components) measured by ground magnetometers [6].
It is known that dB/dt values associated with magnetic storms can reach dangerous levels for power
transmission systems for short periods [7,8]. However, it is not uncommon for dB/dt values associated
with non-storm time substorms to exceed critical thresholds of 1.5 nT/s [9,10], and 5 nT/s [11,12],
which are dB/dt values associated with problems in the electrical grid. What is not yet well understood
is the temporal and the two dimensional spatial development of dB/dt associated with substorms during
non-storm time conditions.
      The dB/dt and GICs associated with geomagnetic storms have been studied in details for
decades [6,9–14]. Geomagnetic storms occur when the interplanetary magnetic field turns southward
and remains southward for a prolonged period of time. These magnetic storms typically last several
days. While the number of storms per year varies with the solar cycle, there are on average around 5
storms per year where the strength of the storm (Dst) is greater than 100 nT [15]. It is well known that
during magnetic storms ground magnetic field perturbations, which can be observed in ground
magnetometer data and in both the Dst and the AL indices, can induce potentially large electric currents
in high voltage power transmission lines and other electrically conducting infrastructure, such as
pipelines and communications systems etc, stretched over long distances. Some of the most widely
studied storms over the last few decades are the March 1989 storm, the Halloween storm of 2003, and
more recently the March 2015 St Patrick’s day storms and most of these storms are known to have
induced large currents in power grids. The March 1989 storm is well known for the costly Hydro Quebec
power grid failure and the Sydkraft Group in Sweden, which is a large power utility, experienced
transformer problems during the Halloween 2003 storm that led to a system failure and a subsequent power
outage [16]. However, despite the large AL index drops no power outages are known to have occurred for

AIMS Geosciences                                                                 Volume 7, Issue 1, 74–94.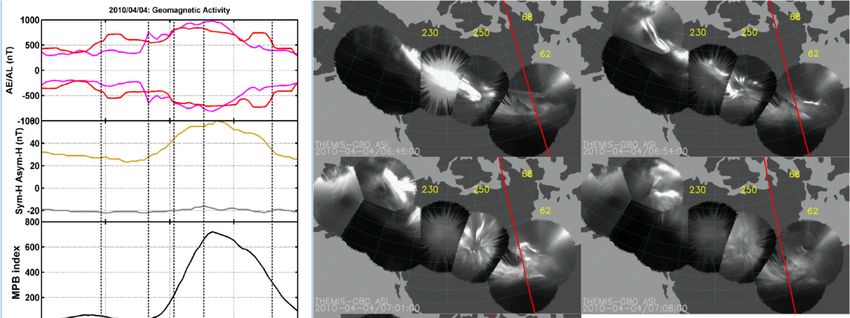
76

the March 2015 storm. Table 1 provides the geomagnetic conditions, dB/dt values, Voltages per km of
power lines, and GIC current amplitudes available in the literature for the three well studied magnetic
storms. Note that the dB/dt value for the March 2015 storm (~13.5 nT/s) has been published by [17],
but using the method discussed in this study we obtain a value of about 16.5 nT/s, which has been
previously presented and discussed at the International Community Coordinated Modeling Center—
Living With a Star working meeting in Cape Canaveral Florida in April 2017. Recently a value of
~16.7 nT/s has been published for the Scandinavia region [5] for the September 2017 storm.
     Prior work has been done to determine the general dB/dt thresholds at which power grid operators
need to be concerned. [12] developed a geomagnetic hazard map of North America for dB/dt = 5 nT/s,
which he felt represented dB/dt’s during large storm time intervals, working directly with Geomagnetic
Laboratory of the Geological Survey of Canada in Ottawa and the Electric Power Research Institute.
Their map shows that the highest probability (0.2% in any given year) of exceeding this threshold
occurs in the nominal location of the auroral oval (i.e., between about 52° to 56° MLat). Furthermore,
the threshold of 5 nT/s is within a factor of three of the storms known to cause power grid failures
reported in Table 1. On the other hand, a much lower level of 1.5 nT/s was found in another study [18]
by examining conditional probability distributions developed using a local electrojet index that used
10 s resolution IMAGE ground magnetometer data in the local time sector of 18 to 24 LT during a
large ground induced current event associated with a ΔB of ~600 nT. However, later studies [1,2]
consider thresholds of 0.3, 0.7, 1.1, 1.5 nT/s in studies that compare ground magnetometer results for
a number of large storm events with Community Coordinate Modeling Center model results. These
threshold are considerably lower than the previously reported threshold of 5 nT/s [11,12], but other
studies reported that some power grids have had problems at dB/dt’s of 1.7 nT/s [8]. For our study we
will consider the upper threshold of 1.5 nT/s [9,10,18], which is associated with dangerous ground
induced currents reported in Scandinavia, and the threshold of 5 nT/s [12] that is associated with
dangerous ground induced currents levels reported in Canada.

      Table 1. Geomagnetic activity and ground induced current values for some magnetic
      storms. Not all values are for North America.

 Storm Date        Min Dst (nT)   Min AL (nT)     Max dB/dt (nT/s)        V/km           GIC Max (A)
 Mar 13, 1989      −589           −2577           11.7 [7]                >1.0 [19]      23–25 [20]
 Oct 29, 2003      −383           −3868           8.0                     ~3.9 [21]      40 A [21]
 Mar 17, 2015      −222           −2300           ~13.5 [17]              10 [22]        2.9–5.8 [20]
                                                  16.5 [This method]

      Compared to geomagnetic storms, substorms occur much more frequently. In fact, it has been
shown using particle injection data measured by geosynchronus spacecraft that substorms occur
approximately every 2.75 hr [23]. A similar frequency of 2.75 hr has been reported elsewhere [24] and
it is well known that substorms continue to occur during magnetic storms. A typical substorm consists
of three phases: onset, expansion, and recovery [25]. During the onset there is a sudden localized
brightening of the aurora at the equatorward edge of the auroral oval somewhere between 18 and 3 MLT
and 55° and 74° MLat [26]. At about the same time and geographic location the H component of the
magnetic field suddenly decreases, which is associated with an enhancement of the westward electrojet
AIMS Geosciences                                                                 Volume 7, Issue 1, 74–94.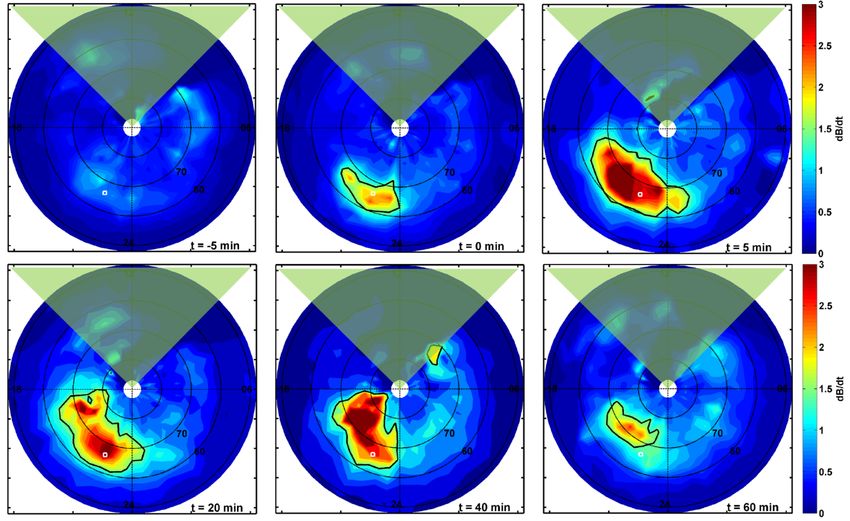
77

and a sharp drop in the AL index. This sharp drop can be as much as 1000 nT or more. Following the
auroral onset the aurora begins to expand poleward, westward, and eastward and the field aligned
currents increase in intensity over a period of about 15–20 min. The eastward electrojet also intensifies
during the expansion phase although not as much as the westward electrojet. During the recovery phase
the auroral luminosity, magnetic field, and current systems return to their nominal configuration prior
to the substorm onset. This brief description of the substorms implies that large values of dB/dt can
occur during substorms. It has been shown that these changes can be as large as 10.7 nT/s typically
occurring within the first 10–20 min of the substorm onset, but can occur at any point during the
substorm [27]. More recently, dB/dt changes as large as ~16.7 nT/s during a storm time substorm have
been measured [5].
     A lot of work has been done to examine the dB/dt and the ground induced currents associated
with storm time periods. However, little work has been done to examine the dB/dt and the ground
induced currents during substorms and no studies have examined the simultaneous temporal and spatial
development of values of dB/dt associated with substorms (both storm time and non-storm time
substorms). In this study we will examine that temporal and spatial development for a single non-storm
time substorms on 4 April 2010. In addition, we perform a 2 dimensional superposed epoch analysis
on a set of 81 substorms, most of which are non-storm time substorms, to understand when and where
the peak dB/dt occur with respect to the auroral onset time and location.

2.   Data

     The data for this study come from two distinct sources: the THEMIS all sky image (ASI) array
and a large number of ground magnetometers across North America and Greenland.
     Magnetometer data comes from eleven different ground magnetometer arrays. The magnetometer
data from these arrays are used to produce a two dimensional map of ionospheric currents over North
America and Greenland using the spherical elementary current system (SECS) technique. More details
on the description of the SECS technique over Greenland and North America and the calculation of
the spherical elementary currents (SECs) [28–31]. The number of available magnetometer stations for
each two dimensional map of ionospheric currents typically changes from day to day due to data gaps,
changes in baseline, and measurement errors. Information related to the ionospheric currents can be
found at [29,32].
     THEMIS ASIs are used to identify substorm auroral onset times and locations. White light ASIs
with the temporal resolution of 3 s are obtained from an array of Ground-Based Observatories (GBOs)
spread over Alaska, Canada and Greenland. More details on the imagers and their geographic positions
can be found in [33] and [34].
     The list of substorms used in this study has been published elsewhere [35] and uses the midlatitude
positive bay index (MPB). The compiled list of substorms consists of several thousand midlatitude
positive bay substorm onsets and was developed from an inversion technique to calculate parameters
determining the onset time, intensity, and geometry of the substorm current wedge system using
magnetic field data from 20 midlatitude ground magnetometers [35]. See [24,36] for more details. We
have taken a subset of the midlatitude bay substorms from the substorm list between 2008 and 2012
and determined an auroral onset time and location within the ASIs when clear auroral images are

AIMS Geosciences                                                                  Volume 7, Issue 1, 74–94.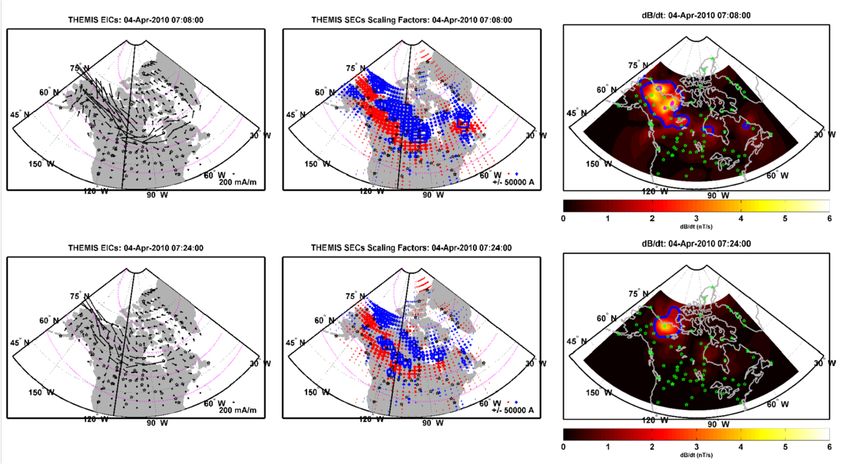
78

available. From the original substorm list [35] consisting of about 1600 midlatitude bay substorms
between 2008 and 2012 we have identified the auroral onset time and location for 81 substorms
between 22 and 23 MLT. See Supplementary materials. Six of these substorms are storm time
substorms with a Dst between −50 nT and −100 nT in the time range of 10 minutes before the auroral
onset time to 60 min after the auroral onset time. The remaining 75 substorms are non-storm time
substorms.

3.   Procedure

     The dB/dt values to be calculated in this study will be determined by using the Biot-Savart law
applied to both the equivalent ionospheric currents and the spherical elementary current amplitudes.
Specifically,

                                                                                                      (1)

where dBx and dBy represent the two components of the fluctuations in the magnetic field horizontal
to the Earth’s surface determined from the spherical elementary current (SEC) contributions and dt is
the time resolution of the SEC data, which is 10 s in our study. This determination of dB/dt is employed
to be consistent with prior methods [9,10].
       We are applying the Biot-Savart law to the ionospheric currents of obtained ΔB = (dBx2 + dBy2)1/2
values because the interpolation of dB/dt across North America and Greenland directly from the
ground magnetometer data using the ground magnetometers results in either data gaps, unrealistic data
(i.e., data spikes), or inaccurate data. To check the accuracy of our SEC ΔB values we calculated the
SECs using all the available magnetometer stations. From these SECs we calculate the ΔB values using
the Biot-Savart law. We then remove one station in the central part of the magnetometer array and
recalculate the SECs and new ΔB values. The difference in the ΔB values before and after the station
is removed are compared at the location of the station. Our results suggest that the differences are on
the order of 6% or less for stations located within the center of North America between Hudson bay
and the west coast and surrounded by additional magnetometers. Comparisons of the interpolated ΔB
sometimes show large differences on the order of more than 10% for stations located in or near Hudson
Bay compared to the ΔB measure at the individual magnetometer sites. At the edges of the
magnetometer array these difference can grow to tens of percentage point because removing a
magnetometer at the edge of the array can significantly change the SEC pattern in that region. However,
similar poor results are obtained we linear interpolation is used at the edges of the array. Fortunately,
none of our auroral substom onset occur near the edge of the magnetometer array.

4.   Observations

     We now examine the dB/dt associated with a specific substorm on 4 April 2010 at 0654 UT and
demonstrate that the dB/dt exceeds the critical threshold of 1.5 nT/s [9,10] and 5 nT/s [11,12]. Just
prior to this stubstorm the solar wind speed is about 500 km/s and the interplanetary magnetic field is
about (Bx = 4, By = 0, Bz = −2) nT GSM. The solar wind number density is just over 2 #/cm3 and the

AIMS Geosciences                                                                 Volume 7, Issue 1, 74–94.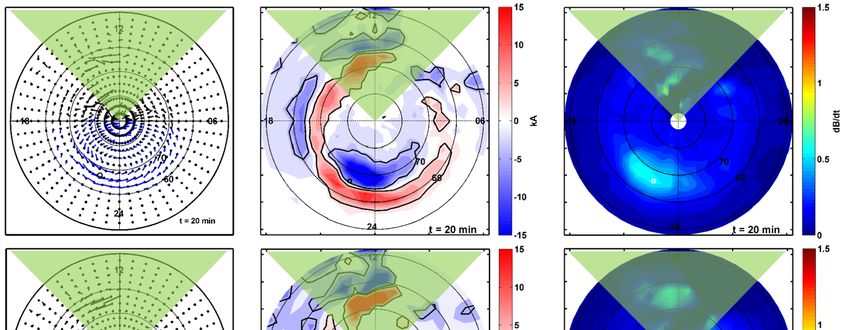
79

dynamic pressure is about 1 nPa. At about 0654 UT the World Data Center AL index drops to about
−800 nT from about −250 nT, but the THEMIS AL index shows an earlier drop from about −210 to
−550 at about 0640 UT. The Sym-H index averages to about −20 nT for the hours before the substorm.
The AL and Sym-H geomagnetic indices indicate this event is a substorm and not a storm. Figure 1
shows the WDC AL and AE indices (mauve curves) as well as the THEMIS AL and AE indices (red
curves) (top left panel), the Sym-H (gray curve) and Asym-H (orange curve) indices (middle left panel),
the mid-latitude positive bay (MPB) index (black curve in the lower left panel), and 5 THEMIS all sky
image mosaics for this event (right two columns). The time of each all sky image mosaic has been
marked with a vertical black line in the three left most panels. In each mosaic only the imagers with
little two no clouds have been included and the image time is given in the lower left corner. A
geographic coordinate system is shown and the red line marks local midnight. We have used an onset
time of 0654 UT based on the MPB index and the WDC AL index, however, there is significantly
geomagnetic activity apparent in the THEMIS AL index and the all sky images prior to the onset time
of 0654 UT. The substorm onset identified in the auroral all sky images occurs at about 58° GLat and
110° West Glong at Fort Smith, NT.

      Figure 1. The left panels include the WDC and THEMIS AL and AE indices in the top
      left panel, the Sym-H and Asym-H indices in the left middle panel, and MPB index in the
      lower left panel. In the right two columns are the THEMIS all sky image mosaics for 5
      different times. All five times are given in the lower left corner and each of these times are
      marked with vertical lines in the left panels. The red line in the mosaics marks local
      midnight.

AIMS Geosciences                                                                   Volume 7, Issue 1, 74–94.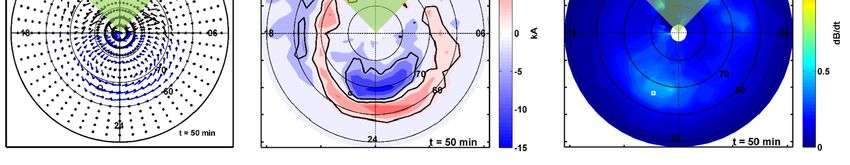
80

       Figure 2 displays the equivalent ionospheric currents (far left column), spherical elementary
current amplitudes (middle column), and the dB/dt values (far right column) associated with this
substorm over North America and Greenland. Five different times are shown (same times as Figure 1)
and one time step is given in each row. Each panel is in geographic coordinates and the black
north-south line on the right side of the map indicates local midnight. The keys for the equivalent
ionospheric currents and the spherical elementary current amplitudes are located in the lower right
corner. The color bar for the dB/dt values is below each panel. The stars in each plot indicate the
ground magnetometers with data used to derive the SECs. In the first column are the equivalent
ionospheric currents. The dot indicates the location at which the currents were derived and the bar
indicates the magnitude and direction of the equivalent current. The middle column shows the current
amplitudes, which are a proxy for the field aligned currents. In each panel the blue squares extending
from northeastern Alaska across Canada to northern Quebec display where the region-1 current flows
into the ionosphere and the red crosses equatorward of the blue indicate where the region-2 current
flows out of the ionosphere. The Harang current system is located on the eastern side of Alaska at the
Canadian border.
       In the top row at 0646 UT just prior to the substorm a westward electrojet is visible in the
equivalent currents from northern Quebec and Newfoundland over Hudson bay and across to Alaska.
Region 1, Region 2, and the Harang current system are present in the current amplitudes, and two small
regions of dB/dt > 1.5 nT/s are outline with blue contours in the upper right panel. In the second row
at 0654 UT the westward electrojet has begun to strengthen just to the left of local midnight, the Region
1 and Harang current systems have also begun to strengthen, and the region of dB/dt > 1.5 nT/s has
grown to 2.4 Mkm2. For comparison, Alberta, Canada covers 0.66 Mkm2. Two small regions of
dB/dt > 5 nT/s outlined with mauve have also appeared.
       At 0701 UT about 7 minutes after the substorm onset in the third row the both the westward
electrojet and eastward electrojet, which is below the westward electrojet in Alaska, have significantly
enhanced. The current amplitudes associated with the substorm have also strengthened. The dB/dt
values > 1.5 nT/s cover large parts of Canada including areas in eastern Canada far from the substorm
onset location. The dB/dt > 5 nT/s has peaked at 14.5 nT/s over an area of in northwestern Canada at
the Alaskan border. By 0708 UT the equivalent ionospheric currents and current amplitudes are still
quite strong, but the dB/dt has significantly decreased. Only a few small areas of dB/dt > 5 nT/s are
still present, but a large area of dB/dt > 1.5 nT/s on the order of 2.4 Mkm2 is still present in northwestern
Canada. By 0724 UT the AL index has returned to pre-substorm levels (~200 nT) and both the
equivalent currents and the current amplitudes have decreased in magnitude. Furthermore, no more
dB/dt > 5nT/s is present, but an area where dB/dt > 1.5 nT/s is still apparent in northwestern Canada
at the Alaskan border.

AIMS Geosciences                                                                     Volume 7, Issue 1, 74–94.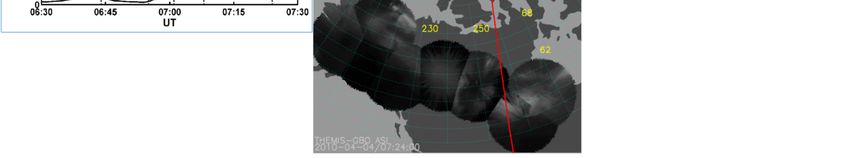
81
a
Figure 2. a: Spherical elementary currents and dB/dt maps for 4 April 2020 substorm at
0654 UT. Shown are three times steps (0646 UT, 0654 UT, and 0701 UT) in each row. In
the left column are the equivalent ionospheric currents and in the middle column are the
spherical elementary current amplitudes. The mauve contours in the left two columns are
the magnetic latitudes but all three columns are shown in geographic coordinates. The far
right column displays the dB/dt maps derived from the spherical elementary currents. The
blue contours are associated with the threshold of 1.5 nT/s and the mauve contours are
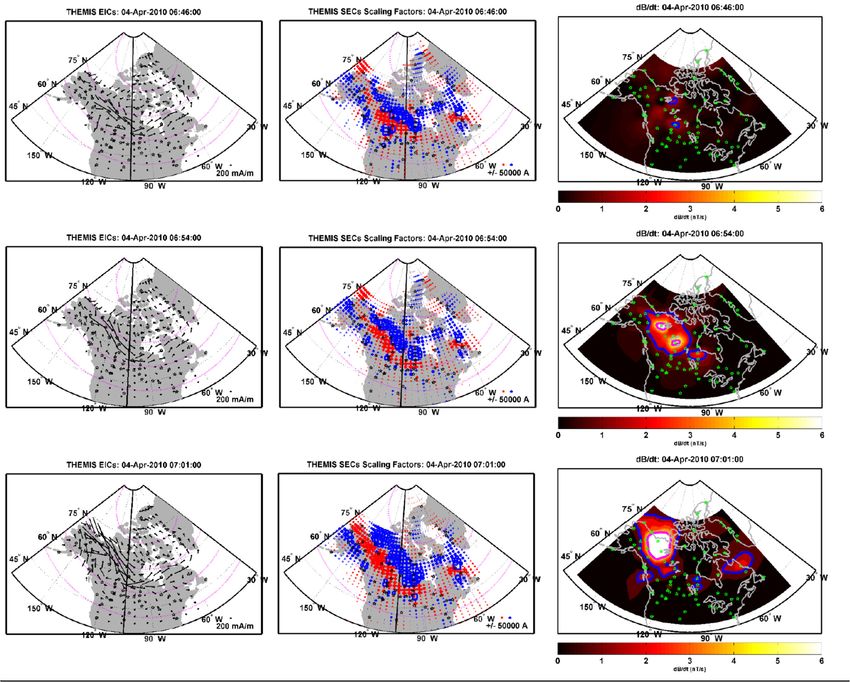
associated with the threshold of 5 nT/s. b: Two additional times steps of spherical
elementary currents and dB/dt maps for 4 April 2020 substorm at 0654 UT. This figure has
the same format as Figure 1a.
AIMS Geosciences Volume 7, Issue 1, 74–94.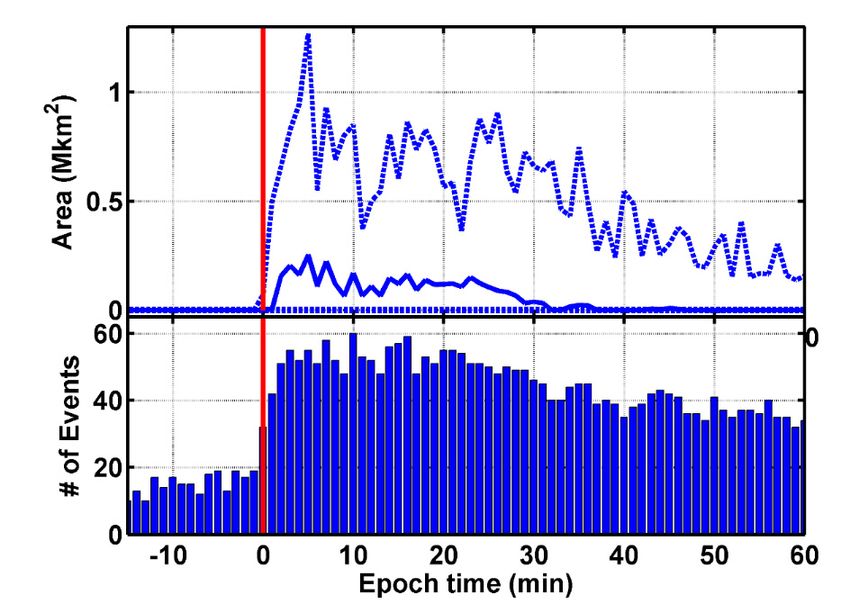
82

b

                                         Figure 2. Continued.

      Figure 3 shows the area in units of Mkm2 before and during the substorm that exceeds the
1.5 nT/s [9,10] threshold (blue curve) and the 5.0 nT/s [11] threshold (mauve curve). The red vertical
line indicates the approximate onset time of the auroral substorm. The figure demonstrates that for the
4 April 2010 substorm that at the time of the onset the area associated with the Pulkkinen
threshold [9,10] suddenly increases to between 2 and 3 Mkm2 and both thresholds appear to peak about
7 min after onset and the critical threshold covers ~2 Mkm2 for about 16 min. Furthermore, the
Molinski threshold [11] reaches just under 1 Mkm2 in area at 6 min after the onset and then nearly 2
Mkm2 about 26 minutes after the onset albeit for just 1 min. This large area appears to be related to a
spike in the Inuvik ground magnetometer data. Similar spikes have been observed before [37,38]. We
note here that the location of the region that exceeds 5 nT/s is generally in the northwestern portion of
Canada, but not consistently in the exact same location. A similar statement can be made for the region
that exceeds 1.5 nT/s, but the area exceeding the Pulkkinen threshold [9,10] tends to be at the same
location more frequently.

AIMS Geosciences                                                                  Volume 7, Issue 1, 74–94.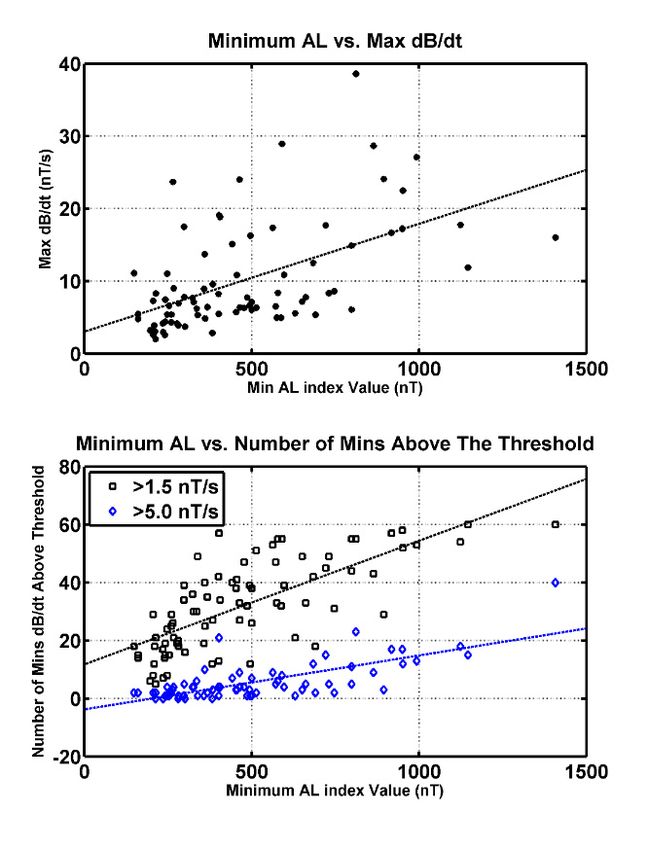
83

      Figure 3. Change in area associated with the two different critical thresholds over time for
      the 4 April 2010 substorm. The blue curve is associated with the threshold of 1.5 nT/s and
      the mauve curve is associated with the threshold of 5 nT/s. The red vertical line marks the
      substorm onset time.

5.   Discussion

      In the Observations section we demonstrated for the large 4 April 2010 substorm at 0654 UT that
critical dB/dt thresholds were exceeded and covered large areas. What is unclear is how frequently do
substorms exceed the critical thresholds of 1.5 nT/s and 5 nT/s, and if large dB/dts are common in
substorms, then what is the temporal and spatial development of values of dB/dt associated with
substorms?
      We examined 60 minutes after substorm onset for 81 substorms between 22 and 23 MLT with
AL minimums from −149 to −1408 nT and found in all 81 substorm at some time within the 60 min
dB/dt exceeded the Pulkkinen threshold [9,10] of 1.5 nT/s. The median number of minutes above the
threshold is 32 min, although this time is not necessarily consecutive. We note that the dB/dt values
are at 1 min temporal resolution and we have not used the full 10 s resolution data. Furthermore, in 63
of 81 substorms the dB/dt exceeded the Molinski threshold [11] of 5 nT/s. The median number of
minutes above the 5 nT/s threshold is 4 min. We note one substorm event on 9 October 2012 during
the latter half of a storm dB/dt exceeded 5 nT/s for approximately 40 min.
      The top of Figure 4 displays the minimum AL index value between the substorm onset and 60
min after the substorm onset versus the maximum dB/dt in the nightside in the same period for the 81
different substorm events. Note that we have not differentiated between storm time substorms and
non-storm time substorms because of the limited number of storm time substorms. The black line is a
linear fit to the events where the slope is 0.014 s−1 and the intercept is 3.0 nT/s. However, there is a

AIMS Geosciences                                                                 Volume 7, Issue 1, 74–94.
84
great deal of scatter in the data points and the correlation coefficient is 0.54. These results are not as
well correlated with a similar study using the IMAGE ground magnetometer array study [27], but that
study is systematically different from our study. That study compared maximum dH/dt to the
maximum value of the H component, which points toward magnetic north, for a specific station for
both non-storm time substorms and storm time substorms and obtain correlation coefficients of 0.75
and 0.66, respectively [27]. In comparison, our dB/dt values are the combination of both the X and Y
components, which point toward geographic north and east, and we have compared to the minimum
in AL. Furthermore, we examined the maximum in dB/dt wherever it occur in the nightside over North
America and not at a specific station location. That being said, it is interesting to note that the maximum
dH/dt value reached in the study using the IMAGE array was just under 11 nT/s [27] whereas our study
found a maximum dB/dt of just under 40 nT/s.
The bottom of Figure 4 shows the minimum AL index value between the substorm onset and 60
min after the substorm onset versus number of minutes above the critical threshold. The black point
are associated with the Pulkkinen threshold [9,10] and the blue points are associated with the Molinski
threshold [11]. The black line is a linear fit to the events associated with the Pulkkinen threshold [9,10]
where the slope is 0.42 s−1 and the intercept is 11.7 nT/s and the blue line is a linear fit to the events
associated with the Molinski threshold [11] where the slope is 0.019 s−1 and the intercept is −3.7 nT/s.
The correlation coefficients for the datasets are 0.73 and 0.73, respectively. These plots indicate that
the time associated with each threshold seems to be well correlated with the minimum in the AL index
associated with each substorm.
In statistical studies it is common to combine many events with a one dimensional superposed
epoch analysis to show a systematic temporal changes in the parameter of interest. In this study we
combine two dimensional maps of the SEC values and the dB/dt values which allows us to perform a
two dimensional superposed epoch analysis where the auroral onset time of substorms is the epoch
zero time and the auroral onset location can be used as an epoch zero location. For our 81 substorms,
we rotate/shift the spherical elementary current amplitudes and equivalent ionospheric currents around
the magnetic pole either to the west or east in local time for each event such that the MLT epoch zero
location of all the auroral onsets align at 22.5 MLT. We only use substorms with onset locations
between 22 and 23 MLT in order to prevent distortion of the median pattern in the currents as a result
of differences in latitudinal locations of the auroral oval for a large range of local times. Additionally,
we expand or contract the latitudinal location of the two sets of currents for each individual event such
that the MLat epoch zero locations of all the auroral onsets sits at 66° MLat. This epoch zero location
of 66° MLat and 22.5 MLT is comparable to the median substorm onset location shown in [26]. Figure
9 in [39] helps illustrate the rotation and expansion/contraction of the currents to the epoch zero
location. That is to say, we treat the location 66° MLat and 22.5 MLT as an epoch origin location in
the same way the auroral onset time as an epoch zero time. For current maps before and after the
substorm onset time the same expansion (or contraction) of the currents and rotation of the currents is
done. The purpose is to align the current systems in such a way to produce a statistical two dimensional
median of the dB/dts and currents and indicate how these systematically develop throughout the
substorm growth, expansion, and recovery phases. Once the current maps have been aligned, the data
are binned to 3 in Mlat by 0.5 hr in MLT to determine the median values of the dB/dts and the SECs.
AIMS Geosciences Volume 7, Issue 1, 74–94.85
Figure 4. The top panel shows the minimum AL index for each substorm versus the
Maximum dB/dt during the substorm. The black line is a linear fit to the data. The bottom
panel shows the number of minutes per substorm that exceed the Pulkinnen et al. (black)
points) and the Molinski et al. (blue point) thresholds. Both lines are linear fits to the data.
Figure 5 shows five epoch time steps from our two dimensional superposed epoch analysis of the
equivalent ionospheric currents, spherical elementary current amplitudes, and dB/dts. Each panel is a
polar plot where 12 MLT at the top, dawn on the right side, dusk on the left side, and local midnight
at the base of the plot. The left column shows the equivalent ionospheric currents. The black circle at
66 MLat and 22.5 MLT marks the epoch origin location and the grid shows the various magnetic
latitudes and MLTs. The dots marks the location of the currents and the direction and magnitude of
the current is shown as a blue segment for the significant currents in the midnight region. The epoch
time steps are given in the lower right corner of each panel and the times shown are −5, 0, 5, 20, and
50 min with respect to the onset time. The dayside SECs observations (between about 09 to 15 MLT)
are not reliable because of poor statistics and have been partially masked out with the green triangle.
The median values in that local noon time range are not reliable because we are using the SECs
determined over North America and Greenland, which covers about 120 in GLong during substorms.
At epoch time −5 min a westward electrojet is shown from 23 MLT to about 06 MLT and a small
AIMS Geosciences Volume 7, Issue 1, 74–94.86
eastward electrojet is shown from about 18 to 19 MLT. This westward electrojet strengthens and surges
westward by epoch time 5 min until epoch time 50 min. Just as we would expect for an average
substorm.
a
Figure 5. a: Two dimensional superposed epoch analysis of 81 substorm events. In the far
left column are the median equivalent ionospheric currents. In the middle column shows
the spherical elementary current amplitudes, and the far right column displays the dB/dt
median values. Each panel is in a magnetic coordinate system with 12 magnetic local time
(MLT) at the top, 00 MLT at the bottom, 06 MLT on the right, and 18 MLT on the left.
The epoch time with respect to the substorm onset time is given in the lower right corner
of each panel and the panels associated with the epoch time zero are in the second row.
The symbol at 66° MLat and 22.5 MLT indicates the epoch zero location where the auroral
substorm onsets are aligned. The green triangle masks the area where there is low statistics
in the data. b: Two additional times steps of the two dimensional superposed epoch analysis
of the spherical elementary currents and dB/dt values. This figure has the same format as
Figure 4a.
AIMS Geosciences Volume 7, Issue 1, 74–94.87
b
Figure 5. Continued.
The middle column of Figure 5 displays the spherical elementary current amplitudes (i.e., a proxy
for the field aligned currents) in the same polar plot format. Blue indicates downward current into the
ionosphere and red indicates upward current and a color bar is to the right of the panel in each row.
The epoch time in minutes before or after the auroral onset time is given in the lower right corner of
each panel. The black square at 66 MLat and 22.5 MLT marks the epoch origin location and the grid
shows the various magnetic latitudes and MLTs. The contours drawn delineate currents of ±3 kAmps.
Again, we note that the dayside SECs (between about 09 to 15 MLT) are not reliable because of poor
statistics and have been partially masked out with the green triangle. In all panels a region 1 and region
2 current pattern is visible in the midnight region. These currents begin to strengthen in magnitude
starting at epoch time 0 min and remain strong throughout the substorm. The downward region 1
currents also expand poleward from epoch time 5 min to 50 min.
The far right column of Figure 5 shows the median dB/dt values for the 81 substorm events in
this study derived from the spherical elementary currents in the same polar plot format. A color bar is
to the right of the panel in each row. The white square at 66 MLat and 22.5 MLT marks the epoch
origin location and the grid shows the various magnetic latitudes and MLTs. Again, the noon sectors
have been partially masked out with the green triangle. At epoch time −5 min there is little to no
significant dB/dt values, but at epoch time zero a patch of dB/dt begins to increase in value at about
23.5 MLT. At epoch time +5 min the dB/dt patch has significantly grown and peaks at 1 nT/s. After
epoch 5 min the dB/dt values gradually decrease and the peak moves about 3 degrees poleward. By
epoch time 60 min the dB/dt has returned to its original value.
The two dimensional superposed epoch demonstrate the spatial and temporal development of the
spherical elementary currents and the dB/dt values. The two dimensional maps shown are the median
AIMS Geosciences Volume 7, Issue 1, 74–94.88
values. However, it is difficult to determine the peak dB/dt value within the two dimensional
superposed epoch maps and when that peak value occurs. For Figure 6 we have extracted the peak
dB/dt value from the two dimensional superposed epoch dB/dt maps within the vicinity of the substorm
per epoch time. The curves shown in Figure 6 are the peak (solid curve) dB/dt values of the superposed
epoch maps and the upper and lower quartiles (dashed curves). To obtain the upper and lower quartiles
we had to construct additional two dimensional superposed epoch maps of the upper and lower
quartiles and extract the dB/dt peaks for each epoch time. The median curve demonstrates that the
dB/dt begins to increase just prior to the substorm onset time at epoch time 0 min and peaks at about
epoch time 5 min. This time of the peak is within the range of occurrence time of the max (|dH/dt|)
after the substorm onset at each available magnetometer site within the IMAGE array study [27] for
both storm time substorms and non-storm time substorms. The range shown in Figure 3 of the IMAGE
array study [27] is 4 to 6 minutes after susbtorm onset. Our Figure 6 also shows that the upper quartile
extends above the critical threshold of 1.5 nT/s, which indicates that a number of large substorms are
present in our 81 events. Shortly, we will examine these larger substorms in more detail.
Figure 6. One dimensional superposed epoch plot of dB/dt. The epoch time is along the x
axis. The solid curve is the median and the dashed curves are the upper and lower quartiles.
The top panel of Figure 7 shows the temporal evolution of the median dB/dt area exceeding the
critical threshold of 1.5 nT/s. The solid blue curve is the median and the dashed curves are the upper
and lower quartile. Note that the lower quartile is along the x axis. The vertical red line delineates
epoch time 0 min. As a means of comparison, Alberta Canada is approximately 0.66 Mkm2. We also
note that the maximum areas reached by the median and upper quartile peak at epoch time 5 min
AIMS Geosciences Volume 7, Issue 1, 74–94.89
similar to the one dimensional superposed epoch plot of dB/dt. The bottom panel of Figure 7 indicates
the number of substorms at each epoch time above the threshold of 1.5 nT/s. The purpose of the lower
panel is to indicate why the lower quartile is along the x axis in the upper panel. Unfortunately, there
are not enough occurrences of substorms with dB/dt ≥ 5 nT/s per epoch min to produce a one
dimensional superposed epoch plot.
Figure 7. The upper panel shows a superposed epoch of the dB/dt area associated with
dB/dt above 1.5 nT/s. The solid curve is the median and the dashed curves are the upper
and lower quartiles. The lower quartile is zero at all epoch times. The red vertical line
marks epoch time zero. The bottom panel shows the number of substorms with dB/dt above
the critical threshold of 1.5 nT/s.
In Figures 5 and 6 we showed the temporal and spatial development of all 81 substorms between
22 and 23 MLT. These figure shows the sudden increase of dB/dt and the expansion of the dB/dt area
within the first 10 minutes of the susbtorm in the two dimensional maps. However, Figures 2, 4, and 7
indicate that a number of larger substorms are present in this study. In Figure 8 we show the temporal
and spatial development of dB/dt at the 95% (the top 5 largest susbtorm events). The format of the
dB/dt polar plots is the same as those in Figure 5 and we show the epoch times −5, 0, 5, 20, 40, 60 min.
This series of dB/dt maps shows the sudden increase of dB/dt at onset above the critical threshold of
1.5 nT/s in the pre-midnight sector. See the black contour in the pre-midnight sector. The area above
the 1.5 nT/s threshold continues to expand westward, eastward, and poleward during the expansion
phase in much the same manner as the auroral emissions evolve. The area above the 1.5 nT/s threshold
expands because the field aligned currents and ionospheric Hall currents associated with the substorm
current wedge strengthen and widen during the onset and expansion phase of the substorm as shown
AIMS Geosciences Volume 7, Issue 1, 74–94.90
in Figure 5a,b. Throughout the recovery phase (epoch time > 20 min) the dB/dt remains above 1.5 nT/s
and the peak dB/dt shifts poleward. The purpose of this sequence of dB/dt maps is to show during large
substorms dB/dt exceeds the critical threshold of 1.5 nT/s for periods on the order of tens of minutes
over large areas, which increases the potential for dangerous geoelectric fields and GICs.
Figure 8. Two dimensional superposed epoch analysis of the 95% percentile of the 81
substorms. These polar plots have the same format as those polar plots in Figure 4. From
epoch time 0 min to epoch time 60 min the area dB/dt that exceeds 1.5 nT/s (black contour
in pre-midnight sector) covers a large portion of the pre-midnight sector.
6. Summary and conclusions
We have examined both a single dB/dt enhancement during a substorm on 4 April 2010 and have
also provided a statistical analysis of 81 substorm events. We summarize the important findings here.
1. At some point during each substorm event dB/dt exceeded the Pulkkinen threshold [9,10] of
1.5 nT/s with a median life time of 32 min.
2. 63 of 81 substorms exceeded the Molinski threshold [11] of 5 nT/s with a median life time
of 4 min.
3. The correlation coefficients between time spent above each threshold and the minimum in
the AL index are 0.73 and 0.73 for both Pulkkinen [9,10] and the Molinski [11] thresholds.
4. The two dimensional superposed epoch analysis for the largest 5 events shows a large area
that exceeds the threshold of 1.5 nT/s and lasts for at least 60 min.
AIMS Geosciences Volume 7, Issue 1, 74–94.91
5. The area that exceed the threshold of 1.5 nT/s shows a systematic pattern similar to the
auroral onset of the substorm. That is to say, the dB/dt suddenly increases at the auroral onset
time and expands westward, eastward, and poleward throughout the substorm expansion
phase. No, significant equatorward dB/dt expansion was observed, contrary to was is seen
for substorm associated with intense storms. During the recovery phase the dB/dt gradually
returns to pre-substorm levels and the peak shifts westward and poleward.
We believe that the latter two results of the evolution of the dB/dt area have not yet been published.
The results of our study may be of interest to the Space Weather Action Plan (SWAP). Two of
the goals of the SWAP are improving the timeliness and accuracy of space weather forecasts and
enhancing the protection of national security assets and critical infrastructure. We have demonstrated
for a limited number of substorms that the dB/dt exceeds critical thresholds associated with problems
in the electrical grid over significant areas. Furthermore the temporal and spatial development of the
dB/dt follows a systematic pattern that could be used to improve the accuracy and timeliness of space
weather forecasting. A larger scale statistical study is required to confirm these statements.
Acknowledgements
We thank the many different groups operating magnetometer arrays for providing data for this
study including: the THEMIS UCLA magnetometer network (Ground-based Imager and
Magnetometer Network for Auroral Studies) is funded through NSF grant AGS-1004736. AUTUMNX
magnetometer network is funded through the Canadian Space Agency/Geospace Observatory (GO)
Canada program Athabasca University, Centre for Science/Faculty of Science and Technology. The
Canadian Space Science Data Portal is funded in part by the Canadian Space Agency contract numbers
9F007-071429 and 9F007-070993. The Canadian Magnetic Observatory Network (CANMON) is
maintained and operated by the Geological Survey of Canada—http://gsc.nrcan.gc.ca/geomag. The
Falcon magnetometers is maintained by United States Air Force Academy (USAFA) and Peter Chi.
The Magnetometer Array for Cusp and Cleft Studies (MACCS) array is supported by US National
Science Foundation grant ATM-0827903 to Augsburg College. The McMAC Project is sponsored by
the Magnetospheric Physics Program of National Science Foundation through grant AGS-0245139
and maintained by Dr. Peter Chi. We would like to would like to thank the DTU magnetometer team;
M. J. Engebretson, D. Murr, and E.S. Steinmetz at Augsburg College. The Solar and Terrestrial Physics
(STEP) magnetometer file storage is at Department of Earth and Planetary Physics, University of
Tokyo and maintained by Dr. Kanji Hayashi (hayashi@grl.s.u-tokyo.ac.jp). This study was made
possible by NASA THEMIS grant NAS5-02099 at UCLA. We also acknowledge NASA HiDEE award
numbers NNX14AJ77G and NNX16AD63G. NASA awards numbers: 80NSSC18K1227,
80NSSC18K1220, and 80NSSC20K1364. We thank the CSA for logistical support in fielding and data
retrieval from the GBO stations. The Alaska and Greenland portions of the GBO network are supported
by NSF through grant 1004736. We would also like to thank Dr. C. Balch, Dr. M.G. Kivelson, Dr.
K.K. Khurana, Dr. R.L. McPherron, Dr. A. Pulkinnen, Dr. R.J. Strangeway, and Dr. R.J. Walker for
their invaluable input.
AIMS Geosciences Volume 7, Issue 1, 74–94.92
Conflict of interest
The author declares no conflicts of interest in this paper.
References
1. Pulkkinen A (2017) Introduction to NASA Living With a Star (LWS) Institute GIC Working
Group Special Collection. Space Weather 15: 738–740.
2. Piersanti M, Carter B (2020) Geomagnetically induced currents. The Dynamical Ionosphere.
Elsevier, 121–134.
3. Wei LH, Homeier N, Gannon JL (2013) Surface electric fields for North America during historical
geomagnetic storms. Space Weather 11: 451–462.
4. Kappenman JG (2010) Geomagnetic storms and their impacts on the U.S. power grid. Metatech-
R-319, Oak Ridge, Tenn.
5. Dimmock AP, Rosenqvist L, Welling DT, et al. (2020) On the regional variability of dB/dt and
its significance to GIC. Space Weather 18: e2020SW002497.
6. Rodger CJ, Mac Manus DH, Dalzell M, et al. (2017) Long‐term geomagnetically induced current
observations from New Zealand: Peak current estimates for extreme geomagnetic storms. Space
Weather 15: 1447–1460.
7. Stauning P (2013) Power grid disturbances and polar cap index during geomagnetic storms. J
Space Weather Space Clim 3: A22.
8. Kappenman JG (2006) Great geomagnetic storms and extreme impulsive geomagnetic field
disturbance events–An analysis of observational evidence including the great storm of May 1921.
Adv Space Res 38: 188–199.
9. Pulkkinen A, Kuznetsova M, Ridley A, et al. (2011) Geospace Environment Modeling 2008–2009
Challenge: Ground magnetic field perturbations. Space Weather 9: S02004.
10. Pulkkinen A, Rastätter L, Kuznetsova M, et al. (2013) Community-wide validation of geospace
model ground magnetic field perturbation predictions to support model transition to operations.
Space Weather 11: 369–385.
11. Molinski TS, Feero WE, Damsky BL (2000) Shielding grids from solar storms [power system
protection]. IEEE Spectrum 37: 55–60.
12. Molinski TS (2002) Why utilities respect geomagnetically induced currents. J Atmos Sol Terr
Phys 64: 1765–1778.
13. Piersanti M, Di Matteo S, Carter BA, et al. (2019) Geoelectric field evaluation during the
September 2017 Geomagnetic Storm: MA. I. GIC. model. Space Weather 17: 1241–1256.
14. Piersanti M, Michelis PD, Moro DD, et al. (2020) From the Sun to Earth: effects of the 25 August
2018 geomagnetic storm. Ann Geophys 38: 703–724.
15. Minamoto Y, Fujita S, Hara M (2015) Frequency distributions of magnetic storms and SI+ SSC-
derived records at Kakioka, Memambetsu, and Kanoya. Earth Planets Space 67: 1–6.
16. NOAA (2004) Halloween Space Weather Storms of 2003, NOAA Technical Memorandum OAR
SEC-88.
AIMS Geosciences Volume 7, Issue 1, 74–94.93
17. Ngwira CM, Sibeck D, Silveira MV, et al. (2018) A study of intense local dB/dt variations during
two geomagnetic storms. Space Weather 16: 676–693.
18. Pulkkinen A, Viljanen A, Pirjola R (2006) Estimation of geomagnetically induced current levels
from different input data. Space Weather 4: S08005.
19. Bolduc L, Langlois P, Boteler D, et al. (1998) A study of geoelectromagnetic disturbances in
Quebec. I. General results. IEEE Trans Power Delivery 13: 1251–1256.
20. Blake SP, Gallagher PT, McCauley J, et al. (2016) Geomagnetically induced currents in the Irish
power network during geomagnetic storms. Space Weather 14: 1136–1154.
21. Shelemy S (2012) Geomagnetically Induced Currents (GIC) And Manitoba Hydro. IEEE PES
presentation.
22. Demetrescu C, Dobrica V, Greculeasa R, et al. (2018) The induced surface electric response in
Europe to 2015 St. Patrick’s Day geomagnetic storm. J Atmos Sol Terr Phys 180: 106–115.
23. Borovsky JE, Nemzek RJ, Belian RD (1993) The occurrence rate of magnetospheric‐substorm
onsets: Random and periodic substorms. J Geophys Res Space Phys 98: 3807–3813.
24. McPherron RL, Chu X (2018) The midlatitude positive bay index and the statistics of substorm
occurrence. J Geophys Res Space Phys 123: 2831–2850.
25. Akasofu SI (1964) The development of the auroral substorm. Planet Space Sci 2: 273–282.
26. Frey HU, Mende SB, Angelopoulos V, et al. (2004) Substorm onset observations by IMAGE‐
FUV. J Geophys Res Space Phys 109.
27. Viljanen A, Tanskanen EI, Pulkkinen A (2006) Relation between substorm characteristics and
rapid temporal variations of the ground magnetic field. Ann Geophys 24: 725–733.
28. Amm O, Viljanen A (1999) Ionospheric disturbance magnetic field continuation from the ground
to the ionosphere using spherical elementary current systems. Earth Planets Space 51: 431.
29. Weygand JM (2009) Spherical Elementary Current (SEC) Amplitudes derived using the Spherical
Elementary Currrent Systems (SECS) technique at 10 s Resolution in Geographic Coordinates,
UCLA. Available from: https://doi.org/10.21978/P8PP8X.
30. Weygand JM, Amm O, Viljanen A, et al. (2011) Application and Validation of the Spherical
Elementary Currents Systems Technique for Deriving Ionospheric Equivalent Currents with the
North American and Greenland Ground Magnetometer Arrays. J Geophys Res Space Phys 116.
31. Weygand JM, Kivelson MG, Frey HU, et al. (2015) An interpretation of spacecraft and ground
based observations of multiple omega bands events. J Atmos Sol Terr Phys 13: 185–204.
32. Weygand JM (2009) Equivalent Ionospheric Currents (EICs) derived using the Spherical
elementary Current Systems (SECS) technique at 10 s Resolution in Geographic Coordinates,
UCLA. Available from: https://doi.org/10.21978/P8D62B.
33. Donovan E, Mende S, Jackel B, et al. (2006) The THEMIS all-sky imaging array—System design
and initial results from the prototype imager. J Atmos Sol Terr Phys 68: 1472–1487.
34. Mende SB, Harris SE, Frey HU, et al. (2008) The THEMIS array of ground-based observatories
for the study of auroral substorms. In BurchV JL, Angelopoulos V, (eds), The THEMIS Mission,
357–387.
35. Chu X, Hsu TS, McPherron RL, et al. (2014) Development and validation of inversion technique
for substorm current wedge using ground magnetic field data. J Geophys Res Space Phys 119:
1909–1924.
AIMS Geosciences Volume 7, Issue 1, 74–94.94
36. McPherron RL, Chu X (2017) The mid-latitude positive bay and the MPB index of substorm
activity. Space Sci Rev 206: 91–122.
37. Engebretson MJ, Pilipenko VA, Ahmed LY, et al. (2019) Nighttime magnetic perturbation events
observed in Arctic Canada: 1. Survey and statistical analysis. J Geophys Res Space Phys 124:
7442–7458.
38. Engebretson MJ, Steinmetz ES, Posch JL, et al. (2019) Nighttime magnetic perturbation events
observed in Arctic Canada: 2. Multiple-instrument observations. J Geophys Res Space Phys 124:
7459–7476.
39. Weygand JM, Wing S (2020) Temporal and spatial development of TEC enhancements during
substorms. J Geophys Res Space Phys 125: e2019JA026985.
© 2021 the Author(s), licensee AIMS Press. This is an open access
article distributed under the terms of the Creative Commons
Attribution License (http://creativecommons.org/licenses/by/4.0)
AIMS Geosciences Volume 7, Issue 1, 74–94.You can also read