The Solar Probe Plus Radio Frequency Spectrometer: Measurement requirements, analog design, and digital signal processing
←
→
Page content transcription
If your browser does not render page correctly, please read the page content below
The Solar Probe Plus Radio Frequency Spectrometer:
 Measurement requirements, analog design, and digital
 signal processing
 M. Pulupa, S. D Bale, J. Bonnell, T. Bowen, N. Carruth, K. Goetz, D.
 Gordon, P. Harvey, M. Maksimovic, J. Martínez-oliveros, et al.

 To cite this version:
 M. Pulupa, S. D Bale, J. Bonnell, T. Bowen, N. Carruth, et al.. The Solar Probe Plus Radio Frequency
 Spectrometer: Measurement requirements, analog design, and digital signal processing. Journal of
 Geophysical Research Space Physics, American Geophysical Union/Wiley, 2017, 122 (3), pp.2836-
 2854. �10.1002/2016JA023345�. �hal-02265982�

 HAL Id: hal-02265982
 https://hal.archives-ouvertes.fr/hal-02265982
 Submitted on 1 Jan 2022

 HAL is a multi-disciplinary open access L’archive ouverte pluridisciplinaire HAL, est
archive for the deposit and dissemination of sci- destinée au dépôt et à la diffusion de documents
entific research documents, whether they are pub- scientifiques de niveau recherche, publiés ou non,
lished or not. The documents may come from émanant des établissements d’enseignement et de
teaching and research institutions in France or recherche français ou étrangers, des laboratoires
abroad, or from public or private research centers. publics ou privés.
 Copyright
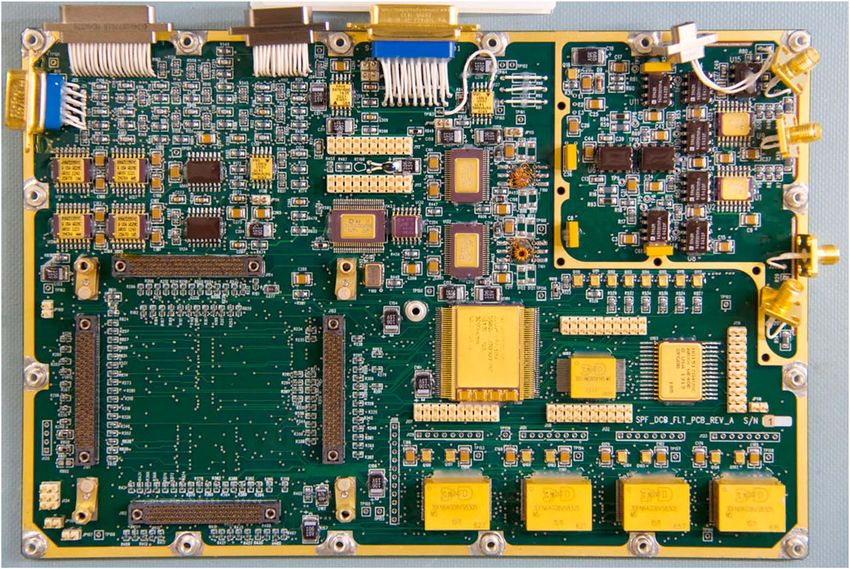
Journal of Geophysical Research: Space Physics
TECHNICAL The Solar Probe Plus Radio Frequency Spectrometer:
REPORTS: Measurement requirements, analog design,
METHODS
10.1002/2016JA023345
 and digital signal processing
Special Section: M. Pulupa1 , S. D. Bale1,2 , J. W. Bonnell1 , T. A. Bowen1,2 , N. Carruth1,2 , K. Goetz3 , D. Gordon1 ,
Measurement Techniques in P. R. Harvey1 , M. Maksimovic4 , J. C. Martínez-Oliveros1 , M. Moncuquet4 , P. Saint-Hilaire1 ,
Solar and Space Physics: Fields D. Seitz1 , and D. Sundkvist1
 1 Space Sciences Laboratory, University of California, Berkeley, California, USA, 2 Physics Department, University of
Key Points:
• The RFS is a newly designed receiver California, Berkeley, California, USA, 3 School of Physics and Astronomy, University of Minnesota, Minneapolis, Minnesota,
 and spectrometer for Solar Probe Plus USA, 4 LESIA, Observatoire de Paris, Meudon, France
• The RFS provides the FIELDS suite
 with high-frequency measurements
 of radio bursts and quasi-thermal
 noise
 Abstract The Radio Frequency Spectrometer (RFS) is a two-channel digital receiver and spectrometer,
• The RFS is optimized for flexible which will make remote sensing observations of radio waves and in situ measurements of electrostatic
 operations and minimal use of and electromagnetic fluctuations in the solar wind. A part of the FIELDS suite for Solar Probe Plus (SPP),
 resources the RFS is optimized for measurements in the inner heliosphere, where solar radio bursts are more intense
 and the plasma frequency is higher compared to previous measurements at distances of 1 AU or greater.
Supporting Information: The inputs to the RFS receiver are the four electric antennas mounted near the front of the SPP spacecraft
• Supporting Information S1 and a single axis of the SPP search coil magnetometer (SCM). Each RFS channel selects a monopole or dipole
• Table S1
• Table S2
 antenna input, or the SCM input, via multiplexers. The primary data products from the RFS are autospectra
• Table S3 and cross spectra from the selected inputs. The spectra are calculated using a polyphase filter bank,
• Table S4 which enables the measurement of low amplitude signals of interest in the presence of high-amplitude
 narrowband noise generated by spacecraft systems. We discuss the science signals of interest driving the
Correspondence to: RFS measurement objectives, describe the RFS analog design and digital signal processing, and show
M. Pulupa, examples of current performance.
pulupa@ssl.berkeley.edu
 Plain Language Summary Solar Probe Plus (SPP) is a NASA mission which will travel much
Citation: closer to the Sun than any previous spacecraft. The FIELDS experiment on SPP is composed of sensors
Pulupa, M., et al. (2017), The Solar (antennas and magnetometers) and receivers which will measure the electric and magnetic fields in this
Probe Plus Radio Frequency unexplored region. This paper describes the Radio Frequency Spectrometer (RFS), a receiver which will
Spectrometer: Measurement
requirements, analog design, measure radio waves up to 19.2 MHz. We describe the types of radio signal sources present in interplanetary
and digital signal processing, space close to the Sun, show how the design of the RFS makes it possible to measure these sources, and
J. Geophys. Res. Space Physics, demonstrate the current performance of the receiver.
122, 2836–2854,
doi:10.1002/2016JA023345.

Received 15 AUG 2016
 1. Introduction
Accepted 22 FEB 2017 The NASA Solar Probe Plus (SPP) spacecraft [Fox et al., 2015] will launch in 2018 on a mission to study the
Accepted article online 3 MAR 2017
 structure of the lower corona, the physics of heating and acceleration of the solar wind, and the acceleration
Published online 30 MAR 2017
 of energetic particles close to the Sun. The SPP spacecraft will orbit the Sun in a highly elliptical trajectory,
 using Venus gravity assists to gradually lower its perihelion from an initial value of 35.7 Rs to a closest approach
 distance of 9.86 Rs from the center of the Sun. The part of each orbit below 0.25 AU (53.7 Rs ) is known as
 the “encounter phase.” During the encounter phase, which lasts approximately 12 days, the SPP instruments
 will make measurements of electric and magnetic fields, plasma ions and electrons, energetic particles, and
 white light images. The unique orbit of SPP will enable measurements of newly accelerated coronal plasma,
 undisturbed by transport effects which alter the properties of the solar wind as it travels from its birthplace
 in the corona to the greater distances explored by previous spacecraft.
 The measurements of electric and magnetic fields for SPP will be made by the FIELDS instrument suite
 [Bale et al., 2016], which is equipped to measure electric fields from DC to 19.2 MHz and magnetic fields from
 DC up to 1 MHz. Figure 1 shows the configuration of the FIELDS sensors on the SPP spacecraft. The spacecraft
©2017. American Geophysical Union. coordinate system and the coordinate system of the search coil magnetometer (SCM) are indicated in blue
All Rights Reserved. and red, respectively.

PULUPA ET AL. SPP/FIELDS RFS 2836

Journal of Geophysical Research: Space Physics 10.1002/2016JA023345

 Figure 1. FIELDS sensor locations on the SPP spacecraft. The RFS input comes from the V1-V4 antennas and the MF
 winding of the SCM. The V5 and fluxgate magnetometer sensors on the magnetometer boom are not used as inputs
 to the RFS. Figure from Malaspina et al. [2016].

 FIELDS measures electric fields with four 2 m antennas (V1–V4) mounted near the SPP heat shield in the
 spacecraft X -Y plane, and one sensor (V5) mounted on the boom at the back of the spacecraft. Preamplifiers
 mounted near the base of the V1–V4 antennas amplify the signals measured at the antenna terminals, and
 provide low-frequency (LF), medium-frequency (MF), and high-frequency (HF) outputs. The V5 sensor is a
 simple voltage probe consisting of two short elements (tip to tip length ∼21 cm), which will be used to mea-
 sure LF and MF electric fields and plasma waves, determine the electrostatic center of the spacecraft, and
 characterize the effects of the spacecraft plasma wake. The V5 preamplifier does not feature an HF output.
 Magnetic fields are measured with two fluxgate magnetometers (MAGs), as well as a search coil magnetome-
 ter (SCM), all mounted on the same boom at the antisunward side of the spacecraft. The two MAGs and the
 SCM each measure three axes simultaneously, with the MAGs most sensitive at lower frequencies and the
 SCM more sensitive at higher frequencies. Each axis of the SCM has a low-frequency (LF) winding sensitive to
 fluctuations in the range from 10 Hz to 50 kHz. The SCM X axis also has an additional medium-frequency (MF)
 winding, sensitive to fluctuations from 1 kHz to 1 MHz. The SCM X axis is parallel to the spacecraft X -Z plane
 and is oriented 45∘ from the spacecraft X -Y plane.
 The RFS (Radio Frequency Spectrometer) is the highest-frequency component of the SPP FIELDS suite, with a
 bandwidth of 10 kHz to 19.2 MHz. The RFS is a two-channel digital spectrometer, which uses as its inputs the
 HF output from the V1–V4 antenna preamplifiers and the MF winding of the SCM. The input to each simulta-
 neously measured channel of the RFS is controlled by multiplexers, so each channel can take as input either
 a single electric antenna (monopole mode), the analog difference between two antennas (dipole mode), or
 the input from the SCM. A block diagram showing the inputs to the RFS is shown in Figure 2.
 Previous missions carried solar and planetary radio experiments with similar scientific goals and requirements
 as the RFS. These experiments, such as the Ulysses/URAP RAR/PFR receivers, the Wind/WAVES TNR/RAD1-2
 receivers, the Cassini/RPWS investigation, and the STEREO/WAVES LFR/HFR receivers [Stone et al., 1992;
 Bougeret et al., 1995; Gurnett et al., 2004; Bougeret et al., 2008], like the RFS, were designed to observe remote
 radio emissions and fluctuations close to the electron plasma frequency. These radio receivers used a super-
 heterodyne technique, mixing the measured signal with a local oscillator to produce a low-cadence envelope
 signal. SPP/FIELDS had originally planned for such a receiver; however, for programmatic reasons this proved
 to be impossible. The RFS was instead designed and built to make these critical measurements. RFS is a
 passband receiver and a new design.
 The RFS bandwidth covers the plasma frequency fp , which will range from ∼100 to ∼750 kHz during the
 encounter phase [Bale et al., 2016]. Below the plasma frequency (f ≪ fp ), remotely generated transverse
 electromagnetic (TEM) radio waves do not propagate through the plasma and the measurements made by
 the sensors are due to in situ plasma waves and turbulent fluctuations. For frequencies significantly above
 the plasma frequency (f ≫ fp ), plasma effects are unimportant and the medium behaves like a vacuum in
 which electromagnetic waves can freely propagate. Radiofrequency sources such as solar radio bursts and

PULUPA ET AL. SPP/FIELDS RFS 2837
Journal of Geophysical Research: Space Physics 10.1002/2016JA023345

Figure 2. RFS block diagram. Inputs to the RFS are shown at the left. The RFS analog and digital sections are physically located on the DCB.

 the galactic synchrotron spectrum predominate at these frequencies. Near the plasma frequency (f ∼ fp ),
 resonance of electrostatic waves (corresponding to a zero of the plasma dielectric function) creates a peak in
 the measured spectrum, with the location and shape of the peak determined by the local electron parameters
 [Meyer-Vernet and Perche, 1989]. Analysis of the resulting spectrum, via a technique known as quasi-thermal
 noise (QTN) spectroscopy, can provide accurate absolute plasma electron density and temperature measure-
 ments [Issautier et al., 2001; Salem et al., 2001]. Effective QTN analysis depends on sufficient spectral resolution,
 antennas which are long compared to the Debye length of the plasma, and a highly sensitive receiver. For the
 RFS receiver, optimal conditions for measuring both electron density and temperature occur near perihelion,
 while conditions at the start of the encounter phase near 0.25 AU will be less favorable. The capability of RFS
 to measure QTN is discussed further in section 2.3.

 2. Signal and Noise Sources
 The digital and analog design process for the RFS required accurate estimates of the amplitudes of the various
 signal and noise sources. In the literature and the technical design requirements, signal levels are typically
 presented as spectra in calibrated physical units such as sfu, W/m2 /Hz, or V2 /Hz. For purposes of receiver
 design, it is necessary to translate these values into RMS or peak to peak voltages at the antenna terminals
 which will be amplified by the preamplifier, passed through the RFS analog section, and digitized by the RFS
 analog to digital converters (ADCs).
 For a source which consists of TEM radio waves (such as the galactic background or remote observations of
 radio bursts), the conversion of units of flux (S, in units of W/m2 /Hz) to measured power (P, in units of V2 /Hz)
 is given by [e.g., Eastwood et al., 2009]

 P [V2 ∕Hz] = S [W∕m2 ∕Hz] × Z0 L2eff Γ2 (1)

PULUPA ET AL. SPP/FIELDS RFS 2838
Journal of Geophysical Research: Space Physics 10.1002/2016JA023345

 where Z0 is the impedance of free space (Z0 ≈ 377 Ω), Leff is the antenna effective length, and Γ is the capac-
 itive gain factor. Scale model rheometry offers a means of characterizing antenna effective length [Rucker
 et al., 1996; Bale et al., 2008; Oswald et al., 2009] by measuring the potential differences induced on a scale
 model of a spacecraft immersed in an electrolytic tank in which a known, well-calibrated electric field is
 maintained. Rheometry measurements using a scale model of the SPP spacecraft were performed at UC
 Berkeley in 2015. The rheometry experiment estimated the effective electrical length of opposing FIELDS
 dipoles at Leff,dipole = 2.67 m ± 10%. In the same experiment, the monopole effective length was estimated at
 Leff,monopole = 1.51 m ± 10%. The uncertainty in the effective monopole and dipole lengths represents both
 inherent uncertainty in the estimates as well as variation between individual monopoles and dipoles due to
 asymmetries in the spacecraft chassis.
 At the high frequencies relevant to RFS measurements (f ≫ fce , fp ), the gain factor Γ arises from voltage division
 between the coupling of the whip of the antenna to external potential fluctuations (the vacuum antenna
 capacitance, Ca ) and the stray capacitance Cs :

 Γ = Ca ∕(Ca + Cs ) (2)

 The antenna capacitance can be estimated from the antenna length L and radius a as
 2 0 L
 CA = (3)
 ln( L ∕ a ) − 1
 yielding 18 pF for a 2 m antenna with a 1.5 mm radius.
 The stray capacitance is the sum of the capacitance provided by the coupling of the antenna to nearby
 conductive structures on and in the antenna itself and on the spacecraft (the “base” capacitance), the capaci-
 tance of the cables connecting the antenna to the preamplifier, and the input capacitance of the preamplifier
 electronics.
 The cable and preamplifier input capacitances were both measured in bench testing. The base capacitance
 is difficult to estimate analytically or numerically but can be measured using a physical model of the antenna
 and a capacitance meter. Such a characterization was performed at UC Berkeley in 2013 using a full-scale
 model of the antenna, following a procedure similar to that used for the STEREO/SWAVES antennas [Bale et al.,
 2008]. The total measured stray capacitance was 26 pF, yielding a Γ of 0.40.
 Using these values for Γ and Leff , values for P can be calculated from estimates of S. From the calculated value
 of P and the measured gain of the preamplifier and RFS analog electronics, the amplitude of the digitally
 sampled waveforms can be calculated in onboard engineering units (counts in the RFS ADCs).
 For Type III radio burst and QTN sources, we estimated the intensity at several radial distances in the SPP orbit,
 as shown in Figure 3. These distances of 54, 35, and 10 Rs correspond to the start of the encounter phase
 at 0.25 AU, the first perihelion after launch in 2018, and the closest approach, respectively. An overview of
 expected signal sources, as well as a measurement of system noise, is shown in Figure 3. (The measured noise
 will be described in more detail in section 6. The noise data is the same data plotted in Figure 9, multiplied
 √
 by a factor of 2. This multiplication is used because Figure 3 shows amplitudes for a dipole configuration,
 while Figure 9 shows monopole data, and the noise from two monopole channels adds in quadrature when
 making a dipole measurement.) The sources shown in the figure are discussed in the sections below.
 2.1. Radio Bursts
 Type III solar radio bursts [Dulk, 1985, 2000; Gopalswamy, 2004; Reid and Ratcliffe, 2014] are generated by
 beams of electrons accelerated into interplanetary space by solar flares. Velocity dispersion of the beam along
 interplanetary magnetic field (IMF) lines creates unstable bump on tail electron velocity distribution functions
 (eVDFs). The instability in the eVDF is relaxed by growth of Langmuir waves, which are electrostatic fluctu-
 ations occurring at the local plasma frequency fp . The Langmuir waves in turn can mode convert to radio
 emission at fp or its harmonics. As the accelerated electrons continue to travel outward from the Sun along the
 IMF lines, the plasma frequency decreases, and the frequency of Type III emission decreases correspondingly.
 Analysis of the frequency-drifting signal offers considerable information on the properties of the accelerated
 electron beam and the structure of the IMF [Reiner and MacDowall, 2015, and references therein].
 Krupar et al. [2014] analyzed 152 Type III radio bursts observed with the STEREO/WAVES receivers between
 the frequencies of 125 kHz and 16 MHz over a period of several years. From this data set, they determined the

PULUPA ET AL. SPP/FIELDS RFS 2839
Journal of Geophysical Research: Space Physics 10.1002/2016JA023345

Figure 3. RFS signal and noise sources. The vertical axis is in units of spectral density, referred to the input of the FIELDS HF preamplifiers.

 statistical distribution of Type III flux density S as a function of frequency at ∼1 AU. The flux density distri-
 bution reached a maximum near 1 MHz (corresponding to a heliocentric distance of ≈8 solar radii for funda-
 mental emission, and ≈14 for harmonic emission), with the 25th to 75th percentile values of S ranging from
 ∼8 × 10⁻¹⁹ to 1.5 × 10⁻¹⁷ W∕m2 ∕Hz.
 These curves of estimated Type III intensity, scaled to several solar radial distances, are shown in Figure 3 as
 blue- (54 Rs ), green- (35 Rs ), and red- (10 Rs ) shaded ribbons. The flux density S scales approximately with the
 square of the radial distance from the Sun, with corrections due to source location (the radiation originates at
 some distance from the Sun) and nonzero source size. To estimate the heliocentric distance of the emission
 region, we have used the radial density profile of Leblanc et al. [1998], and for estimates of source size we have
 used Type III observations found in Steinberg et al. [1985].
 The most intense Type III radio bursts occur with peak S up to 10−14 W/m2 /Hz at 1 MHz at observed distances
 of ∼1 AU [Weber, 1978]. These large Type IIIs are indicated in Figure 3 by lightly shaded extensions of the blue,
 green, and red ribbons.
 To estimate the occurrence rate of intense Type IIIs, we modeled the 1 AU, 1 MHz distribution of Type III bursts
 given in Krupar et al. [2014] as a lognormal probability distribution function (PDF) of occurrence rate. Com-
 bined with the total time interval of the Type III study, this yields an occurrence rate for Type IIIs at a given flux
 density (i.e., the PDF has units of number of bursts/s/log S ).
 The PDF of Type III occurrence rate can then be scaled from 1 AU to the different radial distances encoun-
 tered by SPP. Combining the scaled profiles with a time profile of radial distance for the entire mission, a
 total number of expected bursts at a given flux density for the mission can be obtained (units number of
 bursts/mission/log S ). This approach generates an estimated ∼20 Type III bursts during the SPP mission with
 S > 10−14 W/m2 /Hz (as observed at the spacecraft). The estimated probability of a radio burst large enough
 to saturate the instrument in low-gain mode (see section 3.4) can also be calculated from the occurrence rate
 PDF and is estimated at ∼0.1% during the duration of the mission.
 We note that the estimates described above have large uncertainties, since they are based on 1 AU obser-
 vations. Scattering and ducting effects as well as inhomogeneity in the solar wind plasma can affect radio

PULUPA ET AL. SPP/FIELDS RFS 2840
Journal of Geophysical Research: Space Physics 10.1002/2016JA023345

 emission as it travels from the source region, which can introduce errors into the calculation of S in the inner
 heliosphere based on observed S at 1 AU.
 Section 3.4 describes the different gain stages of the RFS, which enable measurement of both the large
 Type IIIs and the smaller amplitude signals described below.
 Type II interplanetary radio bursts, which are generated by shock-accelerated electrons upstream of coronal
 mass ejections (CMEs), occur in the same frequency range as Type III bursts and are of comparable scientific
 interest for SPP. However, the amplitude of the Type II emission is lower than that of Type IIIs, so the Type IIIs
 are the driver for determining the high end of the RFS dynamic range.
 2.2. Galactic Synchrotron Spectrum
 In order to accurately calibrate the RFS, it is helpful to use the galactic background radio spectrum [Novaco
 and Brown, 1978; Cane, 1979; Hillan et al., 2010] as a source of known intensity that has been measured accu-
 rately by several previous missions. The galactic spectrum is constant in time and nearly isotropic in angular
 distribution [Manning and Dulk, 2001], with a broad peak near 1 MHz, which lies within the RFS bandwidth.
 The galactic signal can therefore be used together with measured antenna parameters such as the effective
 length and base capacitance to derive an accurate absolute calibration [Zaslavsky et al., 2011].
 Observing the galactic noise is a significant challenge for RFS, due to the short length of the SPP/FIELDS elec-
 tric antennas. For FIELDS, the length of the antenna is 2 m for a monopole, compared to a length of 6 m for the
 S/WAVES antennas and tens of meters for spin-stabilized spacecraft such as Wind and Ulysses. Unlike other
 science signals of interest, the galactic noise amplitude does not increase with decreasing solar distance. For
 an effective length of 2.67 m, the galactic synchrotron signal is of the same order of magnitude as the input
 noise to the FIELDS preamplifier. Therefore, to clearly observe the signal, the preamplifier and receiver must
 be carefully designed and calibrated, so the noise can be accurately subtracted from the signal.
 2.3. Quasi-Thermal Noise
 The quasi-thermal noise (QTN) spectrum is generated by the motion of plasma electrons and ions in the vicin-
 ity of the spacecraft. The spectrum, measured in V2 /Hz, depends on the antenna impedance and gain, which
 in turn depend on both the antenna geometry and the parameters of the local plasma [Couturier et al., 1981;
 Meyer-Vernet and Perche, 1989]. The peak in the QTN spectrum at the plasma frequency fp is determined by the
 √
 total electron density ne , from the expression fp = 8980 ne , with fp in Hz and ne in cm−3 . The location of the
 plasma peak is unaffected by the spacecraft potential, making it a useful absolute calibration for the SWEAP
 electron plasma instruments on board SPP [Kasper et al., 2015].
 The plasma peak is easily measurable when the physical lengths of the antennas are much longer than the
 local Debye length (L ≫ LD ). When this condition does not hold, the amplitude and width of the plasma peak
 can be too small for the peak to be resolved. In this case, other sources such as shot noise can dominate the
 observations [Zouganelis et al., 2010 , 2010], although it is still possible to extract some information from the
 spectrum [Martinović et al., 2016].
 When the plasma peak is discernible in the spectrum, the electron density can be immediately determined
 from the plasma frequency. Just below the plasma peak, the spectrum exhibits a flat region, known as the ther-
 mal plateau, with an amplitude determined by the thermal electron temperature [Meyer-Vernet and Perche,
 1989]. When the plasma peak is prominent enough that the plateau is distinguishable from the background,
 the electron temperature can be calculated from the plateau amplitude without a full fit to the QTN spectrum
 [Moncuquet et al., 2005].
 The plasma peak will be most prominent and the electron plasma parameters most amenable to analysis,
 near closest approach. With a very prominent and well-resolved peak, it is possible to fit not only the electron
 density and core temperature but also the suprathermal electron density, temperature, and power law index
 ( ), as well as the ion bulk flow speed. Closest approach is also the part of the orbit where the effects of space-
 craft charging will be strongest [Ergun et al., 2010; Guillemant et al., 2012], so the ability of the QTN spectrum
 to provide electron parameters will be most helpful for the plasma instrumentation.
 The Debye length during the SPP encounter phase is expected to vary from ∼1.68 m at 54 Rs to ∼84 cm
 at ∼10 Rs [Bale et al., 2016]. Several example QTN curves, for distances of 54, 35, and 10 Rs , are plotted in
 Figure 3. At the start of the encounter phase, the plasma peak is expected to be only a small bump on
 the spectrum, which may be barely discernible from the noise generated by fluctuations in the plasma.

PULUPA ET AL. SPP/FIELDS RFS 2841
Journal of Geophysical Research: Space Physics 10.1002/2016JA023345

 The peak will grow in amplitude and prominence above the surrounding background as SPP gets closer to the
 Sun, due to the increase of density and plasma frequency and the corresponding decrease in Debye length.
 At closest approach, we expect that it will be possible to perform full QTN fits on the spectrum, resulting in a
 full set of solar wind plasma parameters. At greater distances, full fits may become impractical, but a simpler
 method can still be used to estimate thermal density and temperature [Moncuquet et al., 2005]. At still greater
 distances, it may be possible to determine only the total electron density from the plasma peak, and near
 the outer limits of the encounter phase the peak may disappear entirely if the ratio of L to LD becomes small
 enough. The radial thresholds at which various methods are possible will depend on the plasma environment
 and the on-orbit performance of the instrument.
 The RFS signal processing includes an algorithm to analyze and return higher spectral resolution in the vicinity
 of the plasma peak. This algorithm is discussed in section 5.1.
 2.4. Langmuir Waves and Dust
 Langmuir waves, discussed above in the context of the creation of remote radio burst emission, are also
 observed in situ [Kellogg, 2003; Hess et al., 2011]. The amplitude of Langmuir waves for SPP in the inner helio-
 sphere is expected to reach up to ∼1 V/m near the plasma frequency, orders of magnitude higher than the top
 end of the RFS dynamic range. When encountering Langmuir waves, the RFS instrument will record saturated
 waveforms, which will yield compromised, unphysical spectra. Other large-amplitude fluctuations, such as ion
 acoustic waves, also appear in the solar wind [Briand, 2009] and can have similar effects. In addition to large
 amplitude waves, dust impacts [Meyer-Vernet et al., 2009; Zaslavsky et al., 2012; Malaspina et al., 2015] are also
 capable of briefly saturating the RFS receiver, which can distort the spectra, especially in the low-frequency
 (f < fp ) range.
 On SPP/FIELDS, these phenomena will be accurately captured by the Time Domain Sampler (TDS) [Bale et al.,
 2016] and Digital Fields Board (DFB) [Malaspina et al., 2016], which have sufficient dynamic range to make the
 necessary large-amplitude measurements. In contrast, the high sensitivity RFS receiver is designed to avoid
 the time periods where these events occur, by keeping track of which waveforms are spoiled by saturation
 and selecting unaffected intervals for spectral processing. This is possible because the large-amplitude signals
 typically are of short duration and highly intermittent.

 3. Analog Design
 The analog design of the RFS is driven by the requirements for high sensitivity, large dynamic range, and use
 of minimal onboard resources. A high-sensitivity receiver is necessary in order to measure weak signals such
 as the galactic synchrotron spectrum, while a large dynamic range is required to measure large-amplitude
 radio bursts without saturating the receiver.
 3.1. Accommodation and Board Design
 The RFS receiver is physically located on an isolated section of the FIELDS Data Control Board (DCB) [Bale
 et al., 2016], which is the primary flight computer and spacecraft interface for the FIELDS suite. In order to
 protect the integrity of RFS signals from possible noise generated on the DCB board, a metal enclosure cov-
 ers the multiplexers and operational amplifiers of the RFS analog section. The physical boundary visible in
 the upper right quadrant of Figure 4 contains all of the components to the left of the balun shown on the
 RFS block diagram in Figure 2. The RFS section of the DCB/RFS is virtually a separate board, with none of
 the power or ground planes crossing the gap provided at the physical boundary. The placement of compo-
 nents and traces on the board has been optimized to minimize crosstalk and phase delay between the two
 RFS channels.
 The mass of the DCB/RFS board is 439 g, of which approximately 100 g is dedicated to the RFS analog section.
 The operational power for the DCB/RFS is 2.59 W, of which approximately 0.65 W is used for the RFS analog
 section. Compared to estimates for the originally proposed stand-alone heterodyne receiver (650 g and 2 W),
 the RFS uses considerably less mass and power.
 3.2. Analog Filtering
 Before being digitized, RFS electric and magnetic field inputs are subject to analog passband filtering. For the
 electric field (V1–V4) measurements, the filter roll on is provided by a single-pole RC high pass filter at the HF
 input of the preamplifiers, with a −3 dB point at 30 kHz. A three-pole Butterworth low pass filter with a −3 dB
 point at 16 MHz provides antialiasing immediately prior to the balun.

PULUPA ET AL. SPP/FIELDS RFS 2842
Journal of Geophysical Research: Space Physics 10.1002/2016JA023345

 Figure 4. DCB/RFS FM board. The RFS analog electronics are isolated from the main board in the area in the upper right
 corner of the DCB/RFS. The DCB FPGA is not shown in this image; when installed, the FPGA resides in the space on the
 lower left side of the board.

 For the magnetic field measurements, the analog response is primarily determined by the inherent induc-
 tive properties (winding geometry, ferrite core permeability) of the sensor and the electrical properties of its
 preamplifier. The SCM MF winding is sensitive to signals from 1 kHz to 1 MHz. The RFS analog section also
 includes a two-pole Butterworth low pass filter for the SCM input, with a −3 dB point at 1 MHz.
 3.3. RFS Sensitivity
 The sensitivity of the RFS is driven by the desire to observe the galactic synchrotron spectrum, which allows
 for absolute calibration of the antenna-receiver system. High sensitivity is also critical to measure weak radio
 bursts, which may be a signature of coronal heating. It has been shown that if weak solar flares contribute
 significantly to heating the corona, the occurrence distribution of flares (and associated Type III radio bursts)
 must be sufficiently steep at low energies, with the critical shape of the occurrence distribution specified by
 Hudson [1991]. Statistics of solar radio bursts have been previously studied using ground-based observatories
 [Mercier and Trottet, 1997; Saint-Hilaire et al., 2013]. With sensitivity sufficient to observe weak Type IIIs in a
 different frequency range (
Journal of Geophysical Research: Space Physics 10.1002/2016JA023345

 √
 The dash-dotted curves in Figure 3 show the maximum spectral density, in V/ Hz, which can be measured
 by the RFS before the ADCs are saturated. The frequency variation of the curves is driven by the frequency-
 dependent gain of the preamplifier and RFS analog section. The maximum spectral density also varies as a
 function of solar distance, as illustrated by the three curves (at 10, 35, and 54 Rs ) for both the high and low
 gain. The variation with distance is due to the changing impedance between the plasma and the antenna
 (higher density lowers the resistive component of the impedance, increasing the gain at lower frequencies
 and thereby saturating the ADC at lower input amplitudes).
 Signals observed by the SCM in the RFS frequency range are likely to exhibit a smaller dynamic range than
 the V1–V4 signals (with the exception of strong in situ plasma waves, which will be observed by the TDS
 and DFB instruments [Bale et al., 2016]). The SCM input to the RFS therefore has a single gain stage, as shown
 in Figure 2.

 4. Digital Signal Processing
 The analog outputs from the two RFS channels pass through the primary windings of two baluns, which
 convert the unbalanced input signals to differential drive output signals with a center tap on the secondary
 windings. Two ADCs sample the signal at the FIELDS master clock frequency of 38.4 MHz and store the result-
 ing digital waveform in memory on board the DCB. The waveform is then processed into autospectra and
 cross spectra which are averaged and telemetered to the ground.
 The digital filtering and Fourier transform of the sampled data are performed within the DCB FPGA, which
 is a radiation-hardened Microsemi RTAX4000SL. The two RFS channels are sampled with 12 bit resolution
 (including one sign bit), and the 12 bit waveform is used as the input to a polyphase filter bank (PFB) algorithm,
 implemented on the FPGA. The PFB is used to filter spacecraft-generated noise from the science signal of
 interest. The mathematical details of the PFB algorithm are described in section 4.2. After the PFB, the two
 channels of filtered waveform data are stored as 16 bit signed integers. These waveforms are then used as
 inputs to an (NFFT = 4096 points) FFT algorithm, also implemented on the DCB FPGA. The algorithm used
 is based on standard techniques for performing FFTs of real-valued data [e.g., Press et al., 1992], adapted to
 optimize performance within the FPGA gate and memory constraints. The output of the FFT is the complex
 transform of the input waveforms, stored as 24 bit integers. During the FPGA-based stage of the processing,
 twos complement-signed integer data format is maintained. The performance characteristics of the RFS
 FPGA-based algorithms were verified by processing waveforms in IDL, C, and ModelSim implementations of
 the PFB and FFT.
 Following the FPGA-based PFB and FFT, flight software processing of RFS spectra includes multiplications
 (for the calculation of autospectra and cross spectra) and additions (for averaging). As with the FPGA
 operations, these flight software operations are performed using integer arithmetic, so additional bits are
 required to store the integer quantities without limiting the available dynamic range. The final uncompressed
 onboard spectra are stored as 64 bit unsigned (real-valued autospectra) or signed (complex-valued cross
 spectra) integers. To reduce downlink bandwidth, these integers are compressed in flight software to a 16 bit
 floating point quantity. The floating point format for autospectra features 6 bits of exponent and 10 bits of
 mantissa (11 effective bits with an implicit initial mantissa bit), while the format for cross spectra features a
 sign bit, 6 bits of exponent, and 9 bits of mantissa (10 effective). The floating point compression is not lossless;
 however, the loss in accuracy due to the compression is small (
Journal of Geophysical Research: Space Physics 10.1002/2016JA023345

 downlink bandwidth available for the SPP mission. In its normal mode, the telemetered spectra will consist of
 64 selected frequencies covering the range 10 kHz–1.7 MHz (LFR) and 1.3 MHz–19.2 MHz (HFR). At the low
 end of the LFR range and the high end of the HFR range, the signal will be attenuated by the high and low pass
 filters from the RFS analog section. The chosen frequencies will be pseudo-logarithmically spaced, allowing
 for a consistent relative frequency spacing Δf ∕f of ∼4.5% throughout their respective frequency ranges.

 4.2. The Polyphase Filter Bank
 The numerous spacecraft subsystems and instruments on SPP (or any spacecraft) can generate noise emis-
 sions, which can be radiated as electromagnetic waves or conducted via the electrical connections between
 different subsystems. The noise from these spacecraft-generated emissions can exceed the levels of some
 low-amplitude science signals.
 To enable the measurement of these small signals, the spacecraft and instrument teams are required to limit
 the radiated electric noise of their subsystems as specified in an electromagnetic compatibility (EMC) plan.
 The SPP EMC plan limits such radiation to specific frequencies given by 150 kHz +n × 50 kHz (n = 0, 1, 2, …),
 with a maximum bandwidth or variability of each peak of Δf ∕f < 0.02% over the frequency range measured by
 RFS, and a maximum far-field amplitude which is measured as specified in the MIL-STD-461 RE02 test [United
 States Department of Defense, MIL, 1999].
 The impact of any given peak in the allowed noise spectrum was estimated by converting the maximum
 far-field E field amplitude to the local potential variation at the antenna location using the known properties
 of the standard monopole test antenna used in the RE02 test, a dipole radiator model for a given noise source
 on the spacecraft and worst-case (minimum) source to antenna center distances.
 From these parameters, one then could determine what analog and digital signal processing techniques were
 required to allow the RFS to make radio frequency (RF) science measurements between the noise peaks. This
 method of making RF measurements in between spacecraft-generated noise peaks is known as the “picket
 fence” and has been successfully used on previous missions such as STEREO [Bougeret et al., 2008].
 In previous missions, the picket fence was implemented along with a superheterodyne receiver, which gen-
 erated a signal at a given individual frequency and mixed it with the input signal to produce a measurement
 at that given frequency. The superheterodyne stepped through frequency space, selecting frequencies which
 were in between the noise-generating frequencies of the picket fence. In contrast, the FFT-based approach
 of the RFS measures all frequencies in the bandwidth simultaneously, based on the Fourier transforms of the
 measured waveforms. In order to implement the picket fence algorithm with an FFT approach, the frequency
 resolution must be sufficiently high and the spectral leakage of the FFT must be minimized.
 The FFT frequency resolution (Δf ) is determined from the number of samples NFFT and the sampling rate fs
 (Δf = fs ∕NFFT ). The sampling rate of the RFS (in the HFR mode) is given by 150 kHz × 28 = 38.4 MHz, and
 the RFS FFT uses 4096 samples. Setting a sampling frequency at a multiple of 150 kHz places the frequency
 harmonics at regularly spaced intervals in the resulting FFT. With a 4096 point FFT, this value of fs yields
 Δf = 9.375 kHz, ensuring that several RFS frequency bins lie in between the narrowband noise lines, which
 are spaced 50 kHz apart.
 The power spectral density (PSD) in the noise lines can be tens of decibels above the PSD for the weakest
 science signals of interest in the RFS bandwidth. For an FFT using a typical window function, spectral leak-
 age from adjacent noise lines would overwhelm the weaker signal for the frequency bins in between the
 noise lines [Harris, 1978], rendering the picket fence ineffective. In order to preserve the capability to observe
 in between the narrowband noise lines, we employ a polyphase filter bank (PFB) [Lyons, 2004; Proakis and
 Manolakis, 2007; Gary et al., 2010] to reduce the effects of spectral leakage.
 The PFB generates an input time series of length N from a longer waveform of length N × P = M
 [Chennamangalam, 2011]. The original M point waveform is multiplied by an M point window function. The
 waveform is split into P sequential segments (known as “taps”) of N samples each (i.e., if the time series is given
 by x0 , … , xM−1 , then the first tap is x0 , … , xN−1 , the second tap is xN , … , x2N−1 , and so on). The individual taps
 are then added together to make a single N sample time series. That time series is then passed to the FFT to
 generate a spectrum. In effect, each sample in the N sample time series is generated by filtering P samples
 from the larger time series, using the elements of the window function as filter coefficients.

PULUPA ET AL. SPP/FIELDS RFS 2845
Journal of Geophysical Research: Space Physics 10.1002/2016JA023345

 Figure 5. PFB window function. The RFS PFB uses a window function consisting of a Blackman-Harris window multiplied
 by a sinc function. The vertical lines delineate the boundaries of the eight taps of the RFS PFB algorithm.

 The shape of the window function determines the frequency response of the individual frequency bins of
 the FFT. For example, if a rectangular frequency response is desired, a sinc window would be used, since the
 Fourier transform of the sinc function is a rectangular function [Chennamangalam, 2011].
 The RFS PFB uses a sinc function multiplied by a Blackman-Harris for its window. The Blackman-Harris window
 is defined as
 ( ) ( ) ( )
 2 n 4 n 6 n
 w0 [n] = a0 − a1 cos + a2 cos − a3 cos (4)
 N−1 N−1 N−1

 where

 a0 = 0.35875; a1 = 0.48829; a2 = 0.14128; a3 = 0.01168. (5)

 The PFB window then consists of the Blackman-Harris window multiplied by a sinc function:

 w[n] = w0 [n] × sinc( (n − N∕2)) (6)

 where is a parameter which can be adjusted to narrow or widen the frequency response of the individual
 PFB bins. The current value of = 0.00027 was chosen to have a flat response near the center of a frequency
 bin (with a −3 dB point at approximately Δf = ±0.5 bin widths), and with out-of-band rejection of >100 dB
 for signals with Δf greater than one bin width from the central frequency.
 The RFS PFB uses eight taps, so the total length of the input waveform for a single RFS spectrum is
 4096 × 8 = 32, 768. The corresponding window function is shown in Figure 5. Adjusting the values of a0 , a1 ,
 a2 , a3 , and allows for fine tuning of the response function.
 The response of the RFS PFB (amplitude and phase) is shown in Figure 6. Figure 6a shows the amplitude
 response, with > −100 dB rejection for out-of-band signals. This response is sufficient to prevent noise from
 entering the quiet frequency bins in the picket fence where RFS observes science signals. The phase response
 is shown in Figure 6b, for frequencies where the amplitude response is > −100 dB. The PFB has a minimal
 effect (
Journal of Geophysical Research: Space Physics 10.1002/2016JA023345

 HFR sample rate followed by N comb
 filters operating at the decimated LFR
 rate. The integrator stages operate as
 y[n] = y[n − 1] + x[n] where the out-
 put of each integrator is cascaded into
 the input of the succeeding stage. Each
 integrator stage has a transfer function
 given by
 1
 HI = . (7)
 1 − z−1
 The comb stages are described by
 y[n] = x[n] − x[n − RM] where R is the
 decimation factor and M is a parame-
 ter known as the differential delay. The
 comb transfer function is given by

 HC = 1 − z−RM . (8)

 Downsampling before the comb cas-
 cade increases the CIC filter’s efficiency
 [Donadio, 2000]. After the rate change,
 the comb operates at a decimated rate
 Figure 6. PFB (a) power and (b) phase response for a single-frequency
 bin of the RFS. Spectral leakage is reduced by >100 dB for signals greater described by y[n] = x[n] − x[n − M],
 than one bin width from the center of a given frequency bin. effectively decreasing the number of
 delay elements required in calculating
 the comb output.
 The transfer function of the filter cascade is

 (1 − z−RM )N
 HCIC (z) = HIN (z)HCN (z) = (9)
 (1 − z−1 )N

 Evaluating on the complex unit circle z = ei(2 f ∕R) gives the frequency response of the CIC filter as
 [ ]2N
 sin Mf
 P(f ) = . (10)
 sin fR

 Figure 7a shows the gain characteristics of the N = 4 stage CIC filter in comparison with a moving aver-
 age boxcar filter. The CIC filter performs significantly better than a moving average filter as an antialiasing
 filter. Additionally, the CIC filter provides several economic benefits over FIR filters for implementation in the
 FIELDS FPGA: no multiplicative steps are required, and storage is reduced by downsampling before passing
 the integrator stage output to the comb filters.
 The RFS uses a four-stage integrator comb filter which can operate with a differential delay set to either one
 or two. The first null in the M = 1 filter occurs at the LFR sample rate. For M = 2 the first null occurs at the LFR
 Nyquist; providing better antialiasing effects, but introducing significant attenuation in the LFR passband. The
 RFS CIC will typically operate with M = 1.
 For the LFR receiver with M = 1, frequencies just below the Nyquist of 2.4 MHz will have relatively poor antialias-
 ing performance. However, these frequencies are not included in the telemetered LFR spectra, which only
 includes frequencies up to 1.7 MHz. In the frequency range from 1.3 to 1.7 MHz, the telemetered LFR and
 HFR data will overlap, and the selected LFR and HFR frequencies have been chosen to match in order to allow
 accurate intercalibration. In this overlap range, it will be possible to identify any aliased signals (aliased down
 from 3.1 to 3.5 MHz) in the LFR by comparing to the HFR spectrum. Below 1.3 MHz, where there will be no
 overlap between LFR and HFR, the CIC algorithm should be sufficient to remove aliased signals (aliased down
 from 3.5 MHz and above), as shown in Figure 7a. Should it be determined on orbit that further antialiasing is
 required, the M = 2 mode can be commanded via flight software.

PULUPA ET AL. SPP/FIELDS RFS 2847
Journal of Geophysical Research: Space Physics 10.1002/2016JA023345

 Figure 7. CIC filter response for the LFR mode of RFS. The CIC filter provides rejection of aliased signals in the LFR
 frequency range. (a) The gain response of the CIC filter. (b and c) The phase response for the M = 1 and M = 2 modes of
 the CIC filter.

 The CIC phase response is linear in frequency, as shown in Figures 7b and 7c for the M = 1 and M = 2 modes.
 For onboard cross correlations, the same value of M will always be set for the two LFR input channels, so there
 will be no relative phase difference generated by the CIC.

 5. RFS Operations
 5.1. Operating Modes
 In normal operation, the RFS produces LFR and HFR autospectra and cross spectra on a regular cadence. The
 cadence is commandable but limited by the available telemetry for the SPP/FIELDS suite, and will typically be
 on the order of 8 s on orbit for the duration of the encounter phase (approximately 12 days). The default oper-
 ating configuration will be two channel measurements, with one channel measuring the opposing dipole pair
 V1–V2, and the other channel measuring V3–V4. In this default configuration, the RFS will alternate between
 LFR and HFR modes.
 For both LFR and HFR data, the final telemetered data product is an averaged spectrum, where the number
 of individual spectra in the average is ∼80. Averaging together individual spectra reduces the statistical noise
 in the telemetered spectra, at the expense of additional processing time and required memory. The number
 80 is determined by the amount of averaging necessary to yield statistical noise in the spectra of ∼0.3 dB,
 comparable to the performance of previous instruments [e.g., Bougeret et al., 1995]. This number can be
 changed on orbit via flight software command.

PULUPA ET AL. SPP/FIELDS RFS 2848
Journal of Geophysical Research: Space Physics 10.1002/2016JA023345

Figure 8. Flowchart of an RFS measurement interval.

 During a single RFS measurement interval (for LFR or HFR), the instrument attempts to accumulate the desired
 number of individual spectra. The RFS always attempts to start by collecting a waveform in high-gain mode.
 If the signal can be measured in high gain (i.e., there are no overranges in the waveform captured by the ADC),
 then the FPGA creates a spectrum with the PFB/FFT and increments the count of high-gain spectra. If the
 signal amplitude is too high, the RFS collects a low-gain waveform and checks for overranges. If there are none,
 the RFS creates a spectrum and increments the count of low-gain spectra. The process restarts, accumulating
 spectra until either ∼80 high-gain or low-gain spectra have been accumulated, or a time limit is reached.
 If more high-gain spectra have been accumulated during the interval, the high-gain spectra are averaged,
 compressed, and telemetered. If more low-gain spectra have been accumulated, they are used instead.
 The total accumulation time is approximately 2 s in the best case scenario (no overranges in the high-gain
 spectra). Frequent overranges can extend the time interval required to accumulate sufficient spectra, up to
 the commandable preset time limit, which will typically be on the order of 4 s. If all spectra in an interval are
 overranged, which may occur during, e.g., an especially intense period of dust impacts, a single spectrum
 (which is likely to be strongly distorted by the effects of overranges) will be computed and returned.
 The actual time during which measurements are made, not counting the time for the FPGA and flight software
 to process the spectra, is 0.85 ms for each HFR waveform (6.8 ms for LFR), multiplied by the number of spectra
 in the HFR or LFR measurement cycle. In a nominal case of 80 accumulated spectra over an ∼8 s cadence, this
 results in an overall duty cycle of approximately 0.85% for HFR and 6.8% for LFR.
 A flow chart of the RFS operation for a single LFR or HFR measurement, illustrating the accumulation of high-
 and low-gain spectra and the processing steps involved, is shown in Figure 8.
 The RFS will detect and track the fp plasma line in the LFR spectra. The tracker will attempt to locate fp using
 a peak detection algorithm, with a backup estimator of fp based on a model of solar wind density [Leblanc
 et al., 1998] for time periods when the plasma peak is small and difficult to detect. As an alternative means
 of estimating fp , the RFS may be able to use (raw and uncalibrated) SWEAP [Kasper et al., 2015] data which
 will be available on board. Once the peak is detected (or estimated), a high-frequency resolution segment of
 the full LFR spectrum will be selected for downlink. This plasma tracking section will increase the frequency
 resolution Δf ∕f to ∼1%, compared to the typical ∼4.5% of the normal reduced LFR spectrum. The additional
 frequency resolution will enable improved ground-based analysis of QTN electron parameters. The algorithm
 for finding the peak is based on a similar algorithm developed for the SORBET receiver on the BepiColombo
 spacecraft [Moncuquet et al., 2006].
 Additional operating modes exist which enable the RFS to focus on specific topics of scientific interest. The
 HFR and LFR telemetered autospectra, which are the product of many individual HFR- and LFR-measured spec-
 tra, can optionally include a spectra of maximum amplitude in addition to the default averaged spectra. The
 maximum spectrum can provide a rough estimator of the variance of spectral fluctuations. The time cadence
 of the telemetered spectra can be increased for certain short time periods (tens of minutes per orbit) in order
 to study rapidly varying Type III radio burst storms, which could be possible signatures of coronal heating by
 small flares [Hudson, 1991; Mercier and Trottet, 1997; Saint-Hilaire et al., 2013]. For extremely limited time inter-
 vals (typically less than 1 s per ∼12 days), raw 38.4 MHz waveforms can also be telemetered for diagnostic
 purposes. Radio direction-finding mode, described in the following section, enables tracking of radio sources
 throughout the heliosphere.
 During commissioning, the RFS will be turned on and will record data during the deployment of the SPP mag-
 netometer boom and the deployment of the V1–V4 antennas. Commissioning, which will take place shortly

PULUPA ET AL. SPP/FIELDS RFS 2849
Journal of Geophysical Research: Space Physics 10.1002/2016JA023345

 after launch while the spacecraft is at a distance of slightly less than 1 AU, is a critical time interval for the
 RFS. By comparing the spectrum measured by the antenna predeployment and during the quietest postde-
 ployment time interval, it is possible to calibrate the antennas against the galactic synchrotron spectrum,
 even when the background noise of the system is of comparable magnitude to the galactic signal [Zaslavsky
 et al., 2011]. Commissioning is the best time to observe the galaxy, since during the encounter phase the
 synchrotron spectrum will likely be overwhelmed by the QTN spectrum (see Figure 3).

 5.2. Direction Finding
 Radio direction finding is a technique that determines the direction of a radio source, using measured antenna
 response. Several methods have been developed which depend on how the radio emission is received and
 recorded. Spinning spacecraft can sometimes use demodulation techniques to determine the source direc-
 tion [Fainberg et al., 1972]. For three-axis-stabilized spacecraft, methods are based on autocorrelation and
 cross-correlation analyses between two or more antenna voltages to infer the wave electric field. These meth-
 ods have been employed on STEREO [Kaiser et al., 2008; Bougeret et al., 2008] and Cassini [Gurnett et al., 2004;
 Cecconi et al., 2008], and will be applied for SPP. Finding the direction to a radio source is equivalent to finding
 the wave vector direction of the measured wave field, which is intrinsically linked to the polarization state.
 This information is contained in the wave field spectral matrix Sij ∝ Ei Ej , which is related to the measured
 antenna voltage correlations < Vi Vj∗ > = hi Sij h∗j , where hi are the components of the effective electrical
 antenna vector. Finding the direction to the source therefore is an inversion problem: find Sij given the mea-
 sured < Vi Vj∗ >. This can be accomplished by iterative numerical methods [Ladreiter et al., 1995; Vogl et al.,
 2004; Reiner et al., 2009] or noniterative methods [Santolík et al., 2003; Cecconi and Zarka, 2005; Hess, 2010].
 Analytical inversion, possible for most polarizations, gives an efficient and fast solution to the problem as
 shown in Cecconi and Zarka [2005] for the case of two or three electric dipole antennas. In the particular case
 of SPP/RFS, which has four antennas, four sets of autocorrelations and six cross correlations will be obtained.
 Because the RFS has only two channels, the measurement of the set of autocorrelations and cross correlations
 is not simultaneous, and therefore, we use the assumption that physical events measured do not change on
 the time scale required to perform all required measurements.
 In addition to single spacecraft direction finding, multispacecraft methods [Reiner et al., 2009] such as trian-
 gulation will be employed, using observations from the STEREO, Wind, and Solar Orbiter spacecraft, which are
 likely to be operational at the same time as SPP. Use of multispacecraft observations increases the accuracy
 of the radio direction determination.

 6. Current Status and Performance
 The RFS was designed and built at the UC Berkeley Space Sciences Laboratory. The initial stage of testing and
 development was performed on a breadboard RFS analog section, which was built separate from the first
 engineering model of the DCB. Following testing of the analog breadboard, a complete flight-like engineering
 model (EM) of the DCB/RFS was completed in 2015. The EM was used in 2015 and early 2016 to develop
 and test the digital signal processing algorithms on the DCB FPGA and in the flight software. In 2016, the
 flight model (FM) of the DCB/RFS was constructed and is presently (as of fall 2016) in the process of FIELDS
 integration and test in preparation for FIELDS delivery in early 2017. The FM is the board shown in Figure 4.
 Breadboard, EM, and FM preamplifiers were developed and tested at Berkeley in close collaboration with the
 DCB/RFS development effort.
 Examples of RFS performance from the FM preamplifiers and DCB/RFS are shown in Figures 9 and 10. The
 units of the vertical axis for each plot are the power spectral density, in V2 ∕Hz, of the voltage observed at the
 input of the high-frequency preamplifier. Eighty individual raw spectra were averaged to produce the plots
 in both figures.
 Figure 9 was taken from a single RFS channel (Channel 1) set to monopole input from the V4 preamplifier.
 No input signal was provided to the RFS (the preamplifier input was terminated with a 50 Ω load). The spec-
 trum shows the noise floor of the preamplifier–DCB/RFS signal chain, along with the performance of the
 PFB. Figure 9 (top) shows the full 2048 frequency channel spectrum as calculated by the PFB and FFT. The
 receiver was operating in high-frequency mode, with a bandwidth of 19.2 MHz. The sharp peaks in the spec-
 trum are power converter frequencies whose primary origin is the Low Noise Power Supply (LNPS) [Bale et al.,
 2016], which generates power at the voltages required by each subsystem of the FIELDS suite. The peaks are

PULUPA ET AL. SPP/FIELDS RFS 2850
Journal of Geophysical Research: Space Physics 10.1002/2016JA023345

 Figure 9. Example HFR spectrum with no input signal, showing the noise floor of the RFS. (top) The full spectrum and
 (bottom) the same data with noise peaks removed. The blue lines are located at 150 kHz +50 × n kHz.

 confined to the “picket fence” frequencies indicated by the pale blue lines on the plot. The power convert-
 ers on the LNPS were designed to meet the same EMC specifications (described in section 4.2) that apply
 to all other SPP systems, so Figure 9 indicates that the RFS PFB is capable of rejecting all EMC-compliant
 noise sources.
 The LNPS peaks extend throughout the entire bandwidth of the receiver. The PFB, discussed in section 4.2,
 effectively reduces the spectral leakage of the peaks, so that when the frequencies nearest the picket fence
 are removed, the spectrum shows no evidence of the peaks, as shown in Figure 9 (bottom). (For the figure,
 the peaks were removed artificially, by simply omitting the frequencies which were within Δf = 9375 Hz of
 a noise peak. For onboard processing, the frequencies affected by noise peaks will simply not be included in
 the spectral calculations, except during brief diagnostic intervals.)
 Figure 10 shows the performance of the CIC filter, as discussed in section 4.3. The RFS was operating in
 low-frequency mode, effectively reducing the sample frequency by a factor of 8, resulting in a spectrum with
 a bandwidth of 2.4 MHz. Both plots in Figure 10 show the V3–V4 dipole input to RFS Channel 1. The input
 signal for both plots was broadband white noise into the V3 RFS preamplifier, while the V4 preamplifier has

PULUPA ET AL. SPP/FIELDS RFS 2851
You can also read