The medial occipital longitudinal tract supports early stage encoding of visuospatial information
←
→
Page content transcription
If your browser does not render page correctly, please read the page content below
ARTICLE
                  https://doi.org/10.1038/s42003-022-03265-4                OPEN

                  The medial occipital longitudinal tract supports
                  early stage encoding of visuospatial information
                  Ahmad Beyh 1,2 ✉, Flavio Dell’Acqua2, Daniele Cancemi1, Francisco De Santiago Requejo1,
                  Dominic ffytche 3 & Marco Catani1,2

                  Visuospatial learning depends on the parahippocampal place area (PPA), a functionally
                  heterogenous area which current visuospatial processing models place downstream from
                  parietal cortex and only from area V4 of early visual cortex (EVC). However, evidence for
                  anatomical connections between the PPA and other EVC areas is inconsistent, and these
1234567890():,;

                  connections are not discussed in current models. Through a data-driven analysis based on
                  diffusion MRI tractography, we present evidence that the PPA sits at the confluence of two
                  white matter systems. The first conveys information from the retrosplenial complex to the
                  anterior PPA and runs within the cingulum bundle. The second system connects all peripheral
                  EVC areas to the posterior PPA and corresponds to the medial occipital longitudinal tract
                  (MOLT), a white matter pathway that is distinct from the cingulum and that we describe here
                  in detail. Based on further functional connectivity analysis and meta-analytic data, we pro-
                  pose that the MOLT supports early stage encoding of visuospatial information by allowing
                  direct reciprocal exchange between the PPA and EVC. Our findings may improve symptom
                  interpretation in stroke and tumour patients with damage to the medial occipito-temporal
                  region and call for revisiting current visuospatial processing models.

                  1 NatBrainLab,Centre for Neuroimaging Sciences, Institute of Psychiatry, Psychology and Neuroscience, King’s College London, London SE5 8AF, UK.
                  2 NatBrainLab,Sackler Institute for Translational Neurodevelopment, Department of Forensic and Neurodevelopmental Sciences, Institute of Psychiatry,
                  Psychology and Neuroscience, King’s College London, London SE5 8AF, UK. 3 Department of Old Age Psychiatry, Institute of Psychiatry, Psychology and
                  Neuroscience, King’s College London, London SE5 8AF, UK. ✉email: ahmad.beyh@kcl.ac.uk

                  COMMUNICATIONS BIOLOGY | (2022)5:318 | https://doi.org/10.1038/s42003-022-03265-4 | www.nature.com/commsbio                                        1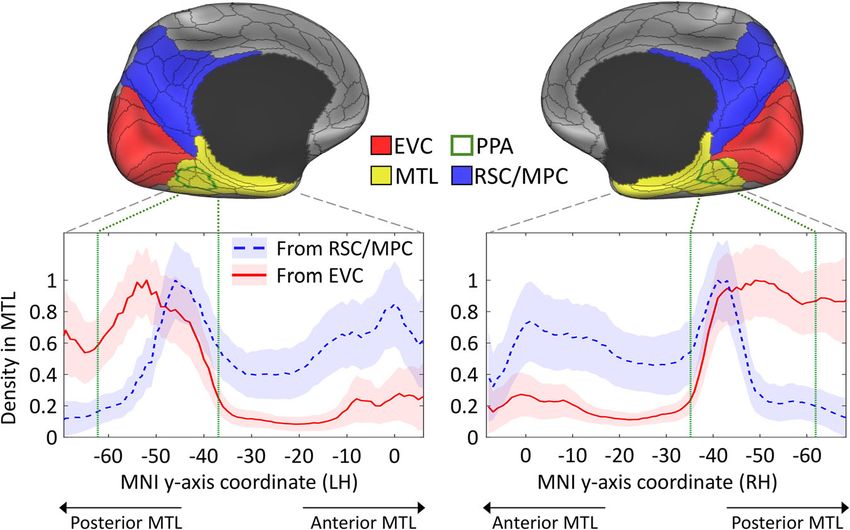
ARTICLE                                                             COMMUNICATIONS BIOLOGY | https://doi.org/10.1038/s42003-022-03265-4

M
            ultiple streams of research into rodents, non-human,           macaque. First, there is support for the existence of direct con-
            and human primates have identified several brain                nections between peripheral visual representations in area V4 and
            regions that contribute to the complex ability of              the posterior PHG28–30. Further, Gattas31 injected anterograde
visuospatial learning. Although the hippocampal formation is a             tracers in the macaque ventral V2 and observed cortical projec-
key player in this cognitive domain1–3, several reports suggest            tions in the most posterior portion of the PHG. Starting at the
that the more posterior parahippocampal gyrus (PHG) lodges                 other end, Schmahmann and Pandya32 reported V2 projections
cortical areas more vital for specific types of visuospatial learning,      following anterograde tracer injections in the macaque posterior
including configuration learning4–8. Configuration learning                  PHG. However, they did not label these fibres separately, possibly
requires building associations between objects and their location          because they may be difficult to discern from those of the inferior
in the visual space. As such, it has been partially dissociated from       longitudinal fasciculus in the macaque brain.
the memory for object identities and separate anatomical sub-                 Recently, Catani used diffusion MRI tractography to report a
strates have been identified for each in human7,9,10 and non-               ‘Sledge Runner’ fasciculus33, and two human post mortem dis-
human primates11. Focal lesion studies have linked configuration            section reports successfully dissected the reported fasciculus34,35.
learning to an area of the posterior collateral sulcus (CoS) known         However, all these reports on humans described a white matter
as the parahippocampal place area (PPA)7–9,12. Conversely,                 bundle that runs between the posterior PHG and the medial
memory for objects has been associated with the hippocampus                occipital wall, terminating in the most dorsal part of the cuneus.
and with areas distributed along the ventral visual pathway                This disagrees with the macaque literature which mainly reports
connecting occipital to ventrolateral temporal cortex13–15.                connections with ventral EVC.
   Functional imaging investigations have revealed that responses             Here, we address the inconsistent findings regarding these
within the PHG are organised along an anterior-to-posterior                connections in the human brain using tractography based on
gradient, with anterior PHG being more involved in identity                diffusion MRI data from 200 participants from the Human
encoding, and responses to configuration changes occupying                  Connectome Project (HCP, https://www.humanconnectome.org/).
more posterior locations10. Although early descriptions of the             First, we first demonstrate that the pattern of the MTL’s anato-
PPA focused on its preferential responses to visual stimuli                mical connections to EVC and RSC/MPC is central to under-
depicting scenes12,16 and treated it as a single functional unit,          standing its functional heterogeneity. Through a data-driven
subsequent resting state fMRI connectivity analyses have revealed          clustering analysis of structural connectivity tractography data, we
a similar gradient within the PPA itself based on its coupling to          demonstrate that the posterior MTL, specifically the PPA, sits at
early visual cortex (EVC), parietal, and frontal regions17,18. To          the confluence of two white matter systems: a dorso-medial sys-
date, it is unclear whether this functional gradient within the PPA        tem stemming from the RSC/MPC and a ventromedial system
is driven by local, intrinsic organisation or by external                  stemming from EVC. Anatomically, both systems merge with the
anatomical input.                                                          posterior cingulum bundle and this may have prevented their
   A counterpart to the PPA that also plays a central role in the          identification in early tractography studies. Here were propose the
spatial learning domain is the retrosplenial complex (RSC).                separation of the ventral EVC-PPA system from the cingulum,
Although the retrosplenial cortex is an anatomical label that              and its identification as a distinct pathway that we refer to as the
corresponds to Brodmann areas (BA) 29 and 30, the term RSC is              medial occipital longitudinal tract (MOLT).
used here to refer to the cortical region which overlaps the ana-
tomical retrosplenial cortex and posterior cingulate cortex (PCC,
BA 23, and 31)19. Located immediately caudal to the splenium of            Results
the corpus callosum, the RSC is strategically located to receive           The PPA sits at the confluence of two white matter systems. As
body-centred (egocentric) spatial information from posterior               a first step, we sought to study the general connectivity pattern
parietal cortex (PPC)20,21 and allocentric spatial information             between the MTL and two sets of regions. The first set, based on
from regions of the anterior medial temporal lobe (MTL)22.                 the revised dual-stream model21,23,36,37, included the RSC and
Unlike the PPA, the RSC responds much more to images of                    additional surrounding regions from the MPC (RSC/MPC region
familiar scenes compared to novel scenes and its responses are             in Fig. 1). The second set of regions was defined to fully cover
viewpoint-independent23, which supports the idea that the RSC is           EVC within the occipital lobe (EVC region in Fig. 1).
not performing simple spatial mapping but is rather involved in a             To select the tractography streamlines that connect these pairs
more complex, memory-driven task24.                                        of regions, we converted the whole-brain tractogram of each
   Based on this and other evidence of anatomical connectivity,            participant to a surface-based vertex-wise connectivity matrix.
Kravitz et al.21 revised the influential dual-stream model for              We then filtered these matrices to only keep connections between
visuo-spatial processing14 to include, within the dorsal stream for        the MTL on one end, and either the EVC or RSC/MPC regions on
spatial processing, a branch connecting the posterior parietal lobe        the other end. This produced a vertex-to-vertex connectivity map
to the MTL, including the hippocampus and PPA (see Rossetti                for each pair of regions in each participant.
et al.25 for a criticism of the model). This pathway linking parietal         Figure 1 shows the mean density of the observed connections
and medial temporal cortices is known as the third branch of the           in the MTL in each hemisphere. On one hand, there is a clear
dorsal stream, and projects both directly and indirectly to the            trend where the posterior MTL receives the majority of EVC
MTL. While anterior MTL regions such as the hippocampal                    connections, followed by a sharp decrease moving toward the
formation mainly receive direct parietal projections, input to the         anterior MTL. This trend is statistically significant according to a
posterior PHG stems mainly from indirect connections relayed               Spearman rank correlation: left hemisphere, rS = −0.72, p < 0.001;
via the RSC and other regions of medial parietal cortex (MPC)              right hemisphere rS = −0.67, p < 0.001. On the other hand, the
(see Kravitz et al.21 for a full review of these connections).             RSC/MPC connections show prominent peaks in both the
   Deep brain electrode recordings in surgical patients have               posterior and anterior MTL, resulting in a non-significant trend
revealed responses to visual stimulation in the PPA as early as            overall: left hemisphere, rS = 0.35, p = 1.00 (n.s.); right hemi-
80 ms26,27. This suggests that EVC may be sending visual infor-            sphere rS = 0.39, p = 1.00 (n.s.).
mation directly to the PPA, bypassing the intricate polysynaptic              In both cases, the zone with the highest density coincides with
circuitry of the dorsal visual stream. Complementary evidence              the location of the PPA but the density of these connections
from the axonal tracing literature supports this notion in the             within the PPA is not homogeneous. For the EVC connections,

2                        COMMUNICATIONS BIOLOGY | (2022)5:318 | https://doi.org/10.1038/s42003-022-03265-4 | www.nature.com/commsbio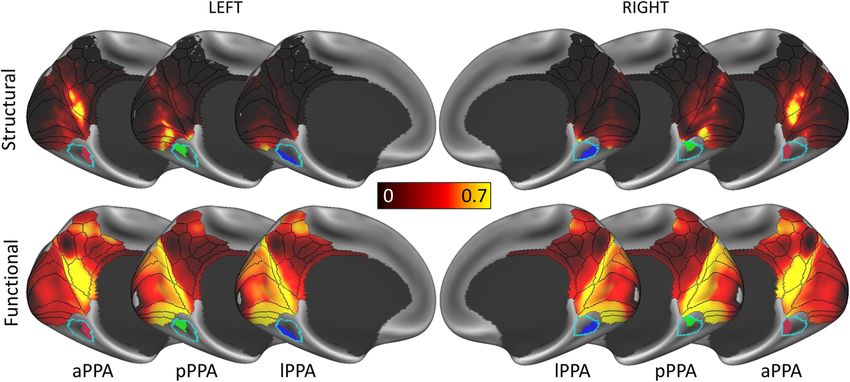
COMMUNICATIONS BIOLOGY | https://doi.org/10.1038/s42003-022-03265-4 ARTICLE
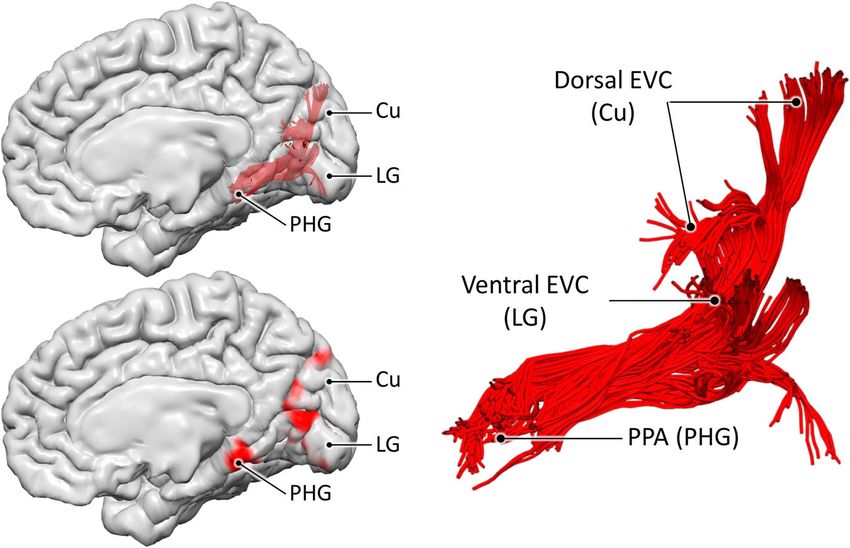
Fig. 1 Density of tractography projections from medial occipital and parietal regions to the medial temporal lobe. The upper panel shows the three large
ROIs used to select streamlines between the medial temporal lobe (MTL) on one end, and early visual cortex (EVC), medial parietal cortex (MPC), and
retrosplenial complex (RSC) on the other end. The parahippocampal place area (PPA), which is located in the posterior MTL, is also delineated with a green
contour. The plots in the lower panel represent the mean density of streamline terminations in the left and right MTL according to its longitudinal y-axis. Projections
from both EVC (red lines) or the RSC/MPC (blue dashed lines) are displayed as the mean and standard deviation (shaded areas) across 200 subjects. While the
EVC connections show a strong preference for the posterior MTL, especially the parahippocampal place area (PPA), the RSC/MPC connections show posterior and
anterior peaks. Within the PPA, the anterior portion receives high density projections from both ROIs, while the posterior portion receives projection preferentially
from EVC. The PPA’s most posterior and anterior coordinates are indicated with the vertical green lines within the plots. Coordinates correspond to the MNI
template. The main ROIs are based on the MMP atlas shown as black contours68, and the PPA is based on48.
the highest density is observed in the posterior half of the PPA, hand, the anterior cluster (aPPA) is mainly connected to the RSC/
with a decline to near-zero density towards its anterior border MPC according to both structural and functional connectivity. A
(Fig. 1). However, the density of RSC/MPC connections is Spearman rank correlation confirmed the agreement between the
negligible in the posterior half of the PPA and sharply rises to its two methods: rs = 0.57, p < 0.001 (LH); rs = 0.72, p < 0.001 (RH). On
highest peak in the anterior PPA. These findings point to a the other hand, the posterior cluster (pPPA) is mainly connected to
topographic correspondence, within the PPA, between functional peripheral visual representations in EVC areas V1, V2 and V3, with
gradients17,18 and hodological segregation based on the two a strong agreement between structural and functional connectivity:
anatomical systems stemming from EVC and RSC/MPC. rs = 0.61, p < 0.001 (LH); rs = 0.65, p < 0.001 (RH).
Although there is strong agreement between structural and
functional connectivity for the anterior and posterior clusters,
Clustering analysis of the PPA’s connections. To better with a clear distinction between the two clusters, the correspon-
understand how the two observed white matter systems interact dence between structural and functional connectivity of the
structurally and functionally within the PPA, we resorted to a lateral cluster (lPPA) is more ambiguous. While it shows
data-driven clustering analysis. To this end, we first combined the preferential structural connectivity to area V4 of EVC, its
EVC and RSC/MPC regions into a single large ROI, and filtered functional connectivity appears more similar to that of the pPPA.
the structural connectivity matrices to only keep connections This ambiguity is captured by the weakest agreement between
between the PPA on one end and this combined ROI on the other structural and functional connectivity for this cluster: rs = 0.45,
end. Next, we used principal component analysis (PCA) to only p < 0.001 (LH); rs = 0.51, p < 0.001 (RH). An in-depth discussion
retain the main features that represent these connections. In both of this finding and further statistical comparisons are available in
hemispheres, PCA yielded three principal components which Supplementary Note 1 (also see Supplementary Figs. 1, 2 and 3).
explained 89.1% (LH) and 89.8% (RH) of the variance in the
connectivity profile of the PPA to the target ROI (Fig. 2).
We then applied a hierarchical clustering analysis to extract From connectivity to functional specialisation. The results of
distinct connectivity-based clusters within the PPA based on the the structural and functional connectivity analyses indicate that
identified principal components (Fig. 2). We used the separation the RSC/MPC and EVC anatomical systems feed into the anterior
vs. spread (SS) index38 to determine the clustering’s optimal and posterior PPA, respectively. This suggests that the functional
granularity. In both hemispheres, a granularity of three clusters specialisation within the PPA should reflect the distinct roles of
yielded the highest SS index: SSmax = 2.71 (LH); SSmax = 3.01 RSC/MPC and EVC in the encoding and retrieval of visuospatial
(RH). This indicates that the PPA is best subdivided into three information39. To address this point, we resorted to a meta-
clusters based on its structural connectivity to the region analysis40 of PPA activations for the terms ‘encoding’ and
encompassing EVC, RSC, and the MPC. ‘retrieval’ obtained from NeuroSynth (https://neurosynth.org/).
In Fig. 3, the structural connectivity of the three PPA clusters to Figure 4 shows the distribution of the maximum z-score
EVC and RSC/MPC is shown and compared to their functional attributed to each of the terms ‘encoding’ and ‘retrieval’ along the
connectivity, which is based on an average resting-state fMRI posterior-anterior axis of the PPA. In the left hemisphere,
connectivity map obtained from an HCP dataset of 812 subjects encoding and retrieval show a similar trend: both have a low
(analysed and released by the HCP; see “Methods” section). On one load posteriorly (z-score < 2) and an increasingly higher load
COMMUNICATIONS BIOLOGY | (2022)5:318 | https://doi.org/10.1038/s42003-022-03265-4 | www.nature.com/commsbio 3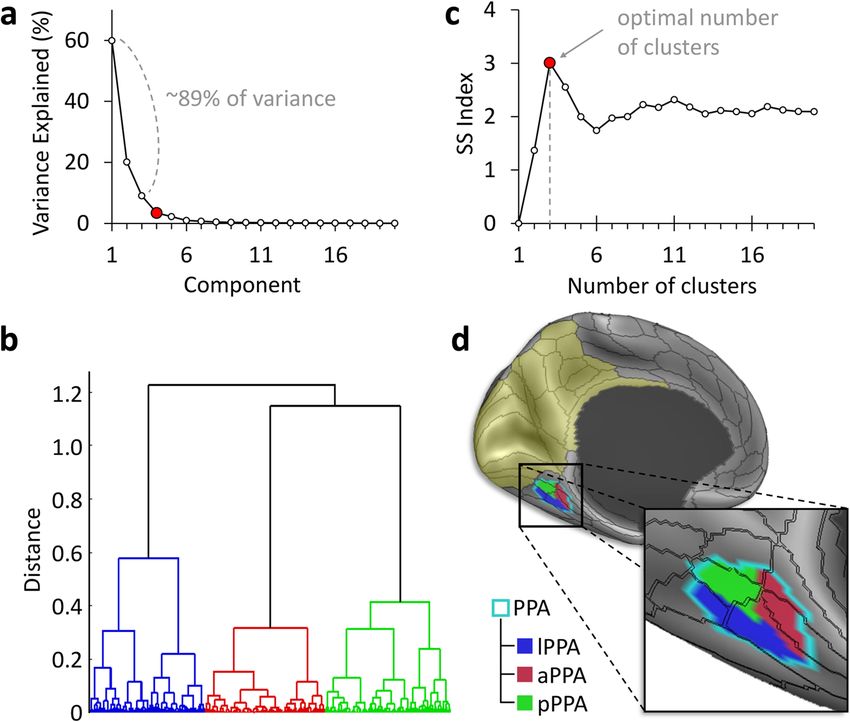
ARTICLE                                                                 COMMUNICATIONS BIOLOGY | https://doi.org/10.1038/s42003-022-03265-4

Fig. 2 Clustering analysis of the PPA reveals multiple anatomical subunits. Data-driven clustering of the parahippocampal place area (PPA) based on
average structural connectivity in 200 subjects. a Principal component analysis (PCA) based on the PPA’s connectivity to a region encompassing early
visual cortex (EVC), the retrosplenial complex (RSC), and medial parietal cortex (MPC) (yellow tint) resulted in three principal components. b Hierarchical
agglomerative clustering grouped PPA surface vertices with similar PCA coefficients. c The highest separation vs. spread (SS) index38 objectively
determined the optimal number of clusters. d The resulting anterior, posterior, and lateral PPA clusters are shown on the inflated brain surface.

Fig. 3 PPA clusters share similar structural and functional connectivity profiles. Structural and functional connectivity of the three parahippocampal
place area (PPA) clusters. The anterior cluster (aPPA) is preferentially connected to retrosplenial complex and corresponds to the parieto-medial-temporal
branch of the dorsal visual stream21. The posterior cluster (pPPA) is preferentially connected to the anterior medial occipital lobe, i.e., peripheral
representations within early visual cortex (EVC). The lateral cluster (lPPA) is more ambiguous but is preferentially connected to EVC. This is discussed in
detail in Supplementary Note 1 (also see Supplementary Figs. 1–3).

moving anteriorly. However, while both encoding and retrieval are              PPA. While the PPA’s connections to the RSC/MPC have been
associated with the anterior PPA in the right hemisphere, only                 well characterised and described within the posterior cingulum
encoding shows a high peak in the posterior PPA (z-score >                     bundle and are well discussed in current models, the anatomy of
2 starting at y = −60 mm) and its overall load in the right PPA is             the connections between the PPA and EVC is less understood. On
much higher. These results are in line with previous functional                that account, we performed semi-automatic tractography
imaging studies and meta-analyses24,41.                                        dissections42 of the latter connections in the 200 HCP datasets
                                                                               using the ROIs described in the Methods section (see also Sup-
                                                                               plementary Fig. 4). The ROIs were delineated to dissect stream-
White matter bundle connecting the PPA to EVC. The con-                        lines that terminate in the region surrounding the PPA on one
nectivity analyses and the meta-analytic results point to the                  end, and in the medial occipital lobe (cuneus and lingual gyrus)
existence of at least two anatomical systems converging within the             on the other end. These dissections confirmed the existence of a

4                           COMMUNICATIONS BIOLOGY | (2022)5:318 | https://doi.org/10.1038/s42003-022-03265-4 | www.nature.com/commsbio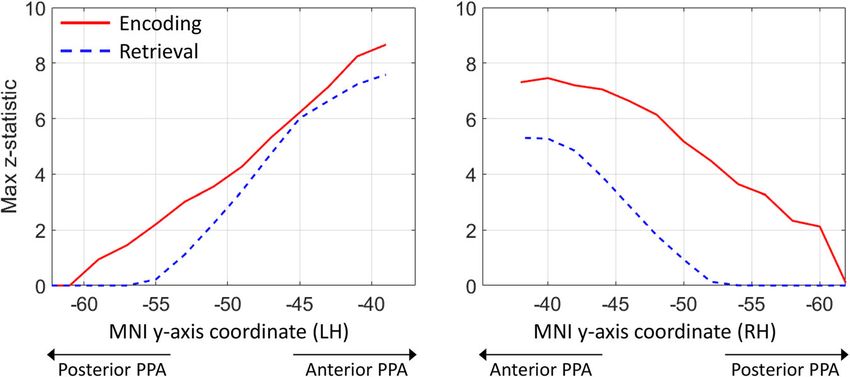
COMMUNICATIONS BIOLOGY | https://doi.org/10.1038/s42003-022-03265-4                                                                      ARTICLE

Fig. 4 Encoding and retrieval in the PPA. These plots are based on meta-analytic maps, obtained from NeuroSynth, of locations associated with the terms
‘encoding’ and ‘retrieval’. The maximum z-statistic is plotted along the posterior-anterior axis of the parahippocampal place area (PPA).

Fig. 5 The medial occipital longitudinal tract (MOLT). Tractography reconstruction of the medial occipital longitudinal tract (MOLT) in an example HCP
participant. The MOLT is an occipito-temporal white matter pathway that stems from the anterior cuneus (Cu) and lingual gyrus (LG) and terminates in
the posterior parahippocampal gyrus (PHG). In the medial occipital lobe, it projects onto peripheral visual field representations within early visual cortex
(EVC), while its temporal lobe terminations overlap the posterior parahippocampal place area (PPA). Further visual representations of the MOLT are
available in Supplementary Fig. 5, and descriptive statistics are presented in Supplementary Table 1.

large, coherent white matter bundle connecting EVC in the                      and their further anatomical characterisation may provide insight
medial occipital lobe to the posterior MTL. On one end, most of                into the MOLT’s functional role. For this reason, we used three
the streamlines of this bundle project in the anterior portions of             tractography-based metrics to assess the macrostructure and
areas V1, V2, and V3 within the occipital lobe. On the other end,              microstructure of the Cu and LG components of the MOLT and
most streamlines terminate within the posterior portion of                     their interhemispheric lateralisation. The first metric was tract
the PPA.                                                                       volume measured as the total volume of voxels intersected by
   Figure 5 shows the 3D reconstruction of this bundle, within the             streamlines (i.e., spatial occupancy) for each of the Cu and LG
brain surface of an example HCP participant. After leaving the                 components in the two hemispheres. The second metric was the
anterior peri-calcarine cortex with a lateral course, fibres                    surface area of their cortical projections within EVC. The third
emerging from the cuneus (Cu) and lingual gyrus (LG) merge                     metric was the hindrance modulated orientational anisotropy
into a single bundle. This bundle continues anteriorly toward the              (HMOA), which is a proxy for the microstructural measure of
temporal lobe and terminates in the region that overlaps the                   fibre density43. For each metric, we calculated a (Cu − LG)/
anterior tip of the LG and the posterior PHG. The entire course of             (Cu + LG) ratio within each hemisphere, and a (RH − LH)/
this bundle is infero-medial to the occipital horn and atrium of               (RH + LH) ratio for each component (Fig. 6). Full descriptive
the lateral ventricles. We chose to label this bundle as the medial            statistics of these metrics and comparisons are reported in
occipital longitudinal tract (MOLT) owing to its location and                  Supplementary Tables 2 and 3, and more details about these
anatomical course. Further visual representations of the MOLT                  comparisons are available in the “Methods” section.
are available in Supplementary Fig. 5, and descriptive statistics are             The comparison between the MOLT components within each
presented in Supplementary Table 1.                                            hemisphere revealed that the LG component is larger in size and
   The distribution of the MOLT’s projections within the occipital             targets a larger surface area within EVC compared to the Cu
lobe suggests the existence of two components within this bundle,              component. The LG component also has lower HMOA values, which

COMMUNICATIONS BIOLOGY | (2022)5:318 | https://doi.org/10.1038/s42003-022-03265-4 | www.nature.com/commsbio                                              5
ARTICLE COMMUNICATIONS BIOLOGY | https://doi.org/10.1038/s42003-022-03265-4
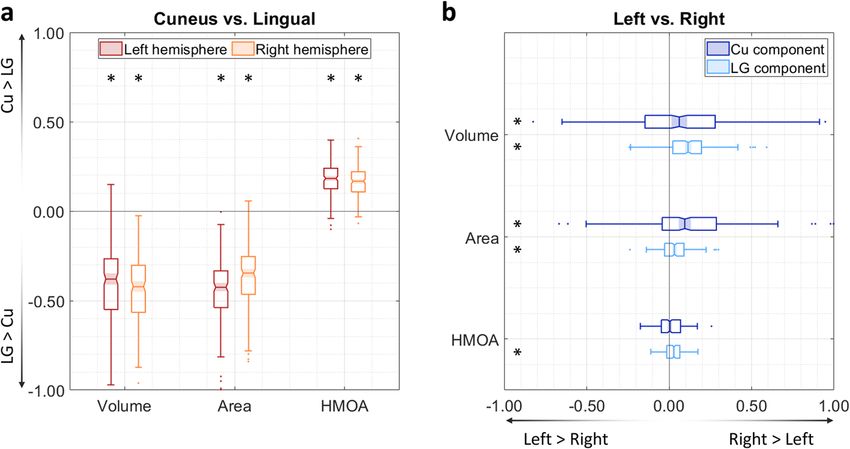
Fig. 6 Macrostructural and microstructural assessment of the MOLT. These box charts summarise the comparisons between the MOLT’s components
within each hemisphere and across hemispheres in 200 subjects. a In both hemispheres, the lingual gyrus (LG) component has a larger volume, distributes
to a wider occipital surface, and has a lower fibre density (as indicated by its lower HMOA) compared to the cuneus (Cu) component (values were derived
using Eq. 1). b Both the Cu and LG components of the MOLT tend to exhibit a slight lateralisation towards the right hemisphere (values derived using Eq. 2).
Within the box charts, the notch and shaded bar represent the median value, the edges of the box correspond to the upper and lower quartiles, and the
whiskers extend to the maximum and minimum non-outlier values. Asterisks indicate that the mean of the corresponding distribution is significantly
different from zero after Bonferroni correction. Detailed descriptions of these metrics are available in the Methods section. Full descriptive statistics of
these metrics and comparisons are reported in Supplementary Tables 2 and 3.
possibly indicates a lower axonal cohesion and/or density compared which do not extend to its anterior-most border defined by
to the Cu component. The inter-hemispheric comparison revealed anatomo-functional approaches48.
that both Cu and LG components of the MOLT are larger in size, This view of the PPA might seem different from its original
project to a larger surface area within EVC, and have higher HMOA description as a cortical region which shows greater functional
values in the right hemisphere. Overall, these results indicate that the responses to images of scenes compared to those of isolated faces
MOLT may carry more visual information about the upper visual or objects12. Yet, the two views go together given that the main
field and have a higher information capacity in the right hemisphere. features in a visual scene are its space-defining borders and the
spatial configuration of its constituent elements16,17,49. Addi-
tionally, the PHG plays a general role in processing contextual
Discussion associations, with spatial associations activating the pPHG and
Current models of visuo-spatial processing21,29 focus on input to non-spatial associations activating the anterior PHG10,50,51.
the MTL via multiple routes. Input that is specific to the PPA In our analysis of 200 HCP subjects, we consistently replicated
seems to arise mainly from indirect parietal projections relayed a coherent white matter bundle that runs between the peripheral
via the RSC/MPC, or from direct projections from area V4 of visual representations within EVC and the PPA. Considering its
EVC. This view does not disagree with our findings that different medial location and course along the posterior-anterior axis, we
sub-zones within the PPA receive information via separate ana- refer to this pathway as the medial occipital longitudinal tract
tomical pathways. On one hand, we observe that the anterior (MOLT). The MOLT has a dorsal (Cu) and a ventral (LG)
zone (aPPA) is strongly connected to the RSC/MPC, which is a component that both project onto the same zone in the posterior
connectivity profile that closely agrees with the descriptions of the PPA. Fibres of the MOLT were identified in early tractography
parieto-medial-temporal branch of the dual-stream model21 and studies but considered as part of the ventral cingulum52 and
previous functional connectivity analyses of this pathway44,45. On inferior longitudinal fasciculus53. The existence of a direct con-
the other hand, the posterior zone (pPPA) is strongly connected nection between EVC and posterior PHG as a separate tract from
to the anterior-most portions of the Cu and LG, overlapping the cingulum was presented by Catani33 and indicated with the
peripheral visual field representations within EVC. This obser- descriptive term ‘Sledge Runner’ fasciculus. Recent post mortem
vation challenges the current view that EVC projections to the dissection and in vivo tractography studies confirmed the exis-
PPA mainly arise from V4, and instead suggests that earlier visual tence of the ‘Sledge Runner’ fasciculus but they limited its occi-
areas contribute directly to PPA afferents. pital terminations to the most dorsal portion of the cuneus34,35,54.
The idea that the PPA contains multiple subunits with different Therefore, we believe that the ‘Sledge Runner’ fasciculus should
connectivity profiles has already been alluded to in the literature. only be considered as the dorsal-most component of the MOLT,
Cytoarchitectonic data suggests that TFO, the posterior-most area possibly projecting onto dorsal V2 and V3.
of the macaque PHG, has a prominent layer IV and a general This distinction becomes more important when we consider that
laminar profile more akin to the profiles of visual areas than to the MOLT mediates a stronger overall connectivity between the PPA
those of its anterior neighbours TF and TH46. Further, evidence and ventral EVC (LG, upper visual field) compared with dorsal EVC
from task fMRI studies of the human brain suggests that, within (Cu, lower visual field). This imbalance is in line with a functional
the PPA, the posterior portion exhibits stronger functional cou- bias within the PPA which contains a larger representation of the
pling with peripheral representations within EVC, while the upper visual field29,47,55. The MOLT also exhibits a right hemisphere
anterior portion shows a strong coupling with an extended lateralisation, which is an observation that fits existing literature
fronto-parietal network17,18. Additionally, the pPPA contains two reporting such a hemispheric bias in the spatial learning functions
distinct retinotopic maps of the visual field, PHC1 and PHC247, supported by the parietal lobe and MTL36,56. Further, this
6 COMMUNICATIONS BIOLOGY | (2022)5:318 | https://doi.org/10.1038/s42003-022-03265-4 | www.nature.com/commsbioCOMMUNICATIONS BIOLOGY | https://doi.org/10.1038/s42003-022-03265-4 ARTICLE
lateralisation may explain the higher frequency of visuospatial www.humanconnectome.org). As this study only used fully anonymised existing
learning deficits following posterior right hemisphere lesions6,56. data from a public dataset, no ethical approval was required according to the
guidelines of the King’s College London Ethics Committee. All subjects were right-
Axonal tracing reports in the macaque using anterograde tracer handed as determined by a score of 50 and above on the Edinburgh handedness
injections in EVC, specifically in peripheral visual field repre- questionnaire59.
sentations in V2, lead to traces in the posterior PHG31. Other Diffusion MRI data of the HCP were acquired on a 3T Siemens “Connectome
reports using anterograde injections in the PHG itself show traces Skyra” using a spin-echo EPI sequence (TR = 5520 ms; TE = 89.5 ms; matrix of
in the peri-calcarine occipital region32. This suggests that bidir- 168 × 144; 111 slices with a thickness of 1.25 mm; isotropic voxels of 1.25 mm;
multiband factor = 3). Three diffusion-weighted shells were acquired (b = 1000,
ectional information exchange takes places between the posterior 2000, and 3000 s/mm2) with two opposite phase-encoding directions each (L ≫ R
PHG and EVC in the macaque. Therefore, the MOLT likely and R ≫ L). Each shell consisted of 90 diffusion-weighted directions and six
represents reciprocal anatomical connections between EVC and interleaved non-diffusion-weighted volumes. For this study, only data from the
the PPA in the human brain. b = 2000 s/mm2 shell were used as this b-value offers a good compromise between
signal-to-noise ratio and high angular resolution, especially at high spatial
According to clinical reports, lesions affecting the posterior PHG resolution60.
and anterior tip of the LG (coinciding with the posterior PPA cluster) The data were obtained from the HCP database in pre-processed form
lead to a deficit known as landmark agnosia in which patients are following the HCP minimal pre-processing pipelines61. Briefly, correction for
“unable to represent the appearance of salient environmental motion and eddy current distortions was performed using eddy with outlier slice
replacement62,63. Correction of susceptibility distortions was incorporated into this
stimuli”56. Conversely, lesions to more anterior MTL regions and/or step by means of an off-resonance field estimated using topup64. Diffusion MRI
RSC lead to anterograde disorientation, meaning that patients are data were then corrected for gradient non-linearity and finally aligned to the
“unable to create new representations of environmental structural space using a boundary-based registration65.
information”56. This suggests that the posterior cortical regions are Tractography was computed using StarTrack (https://www.mr-startrack.com/).
Spherical deconvolution was based on a damped version of the Richardson-Lucy
more important for encoding the local space, while the anterior algorithm43,66 with the following parameters: fibre response α = 1.8; number of
regions are involved in placing and retrieving this information within iterations = 300; amplitude threshold η = 0.0020; geometric regularisation ν = 12.
the context of existing knowledge. Indeed, through the use of meta- Fibre tracking was then performed using the multi-fibre Euler-like algorithm with
analytic maps associated with these two terms, we found that the the following parameters: minimum HMOA threshold = 0.0033; step size =
posterior PPA is more involved in encoding, while retrieval is only 1.0 mm; maximum angle threshold = 45°; minimum fibre length = 20 mm;
maximum fibre length = 300 mm.
present in the anterior PPA, in line with previous reports24,39,41.
Our view is that the MOLT carries ‘raw’ visual information from
EVC which the PPA requires, in combination with higher-order Building vertex-wise connectivity matrices. The whole-brain tractogram of each
spatial information stemming from the parietal lobe, to fully map the subject was converted to a vertex-wise structural connectivity matrix. For each subject,
this approach was based on the native space midthickness cortical mesh, vertex-
visual scene. In other words, afferents from EVC and from RSC/ matched to the ‘32k FS LR’ surface template using the multimodal surface matching
MPC must work in tandem to allow the PPA to fully carry out its (MSM) method67,68. These surfaces have the advantage of maintaining the native
role. In this context, the MOLT may carry feedforward and feedback anatomy of the brain while offering a vertex-level matching between subjects. As a
spatial information between EVC and the PPA, thereby serving as a result, information from multiple subjects can be directly compared at each vertex.
pathway for re-entrant visual information57 that supports a multi- The end points of each tractography streamline were projected to the nearest
vertex on the midthickness surface, with a maximum allowed distance of 4 mm.
stage encoding and learning of the visual scene. As such, early acti- Only streamlines that resulted in two cortical targets (one for each end point)
vations within the PPA26 may correspond to an initial mapping of survived this step. Due to the sparse distribution of streamlines near the cortical
the ‘gist of the scene’ which, via feedback to EVC, refines the later, surface, this approach would result in a patchy representation of cortical targets
detailed mapping of object configuration. This refined information, which is problematic for group-level analysis. To compensate for this and for
tractography’s uncertainty near grey matter69, a geodesic Gaussian kernel
still in a retinotopic space, could then be combined with parietal and (FWHM = 2.5 mm) was applied to each target independently. The connectivity
retrosplenial spatial information at longer latencies27, and translated information resulting from each streamline was used to populate a
into an allocentric frame of reference. This higher order, viewpoint- 32492 × 32492 sparse matrix representing all vertices of the cortical surface. Each
invariant spatial information would ultimately reach more anterior subject’s matrix was then normalised by its highest value before the group-level
mean connectivity matrix was computed.
MTL regions including the hippocampal formation, and more distant
frontal regions21,28,32,58.
Here, we applied a multimodal investigation to a large cohort Defining cortical ROIs. In preparation for the connectivity analyses in the fol-
of healthy participants. It remains important to list some lim- lowing sections, several regions of interest were defined using published cortical
itations and suggestions for future investigations. First, neuroi- atlases.
First, an ROI was defined to cover EVC and included the following labels from
maging methods, including fMRI and diffusion tractography, rely the multimodal parcellation (MMP) atlas68: V1, V2, V3, V4, V3A, and V6. This
on models to produce results. Although these depend on data effectively covered the Cu, LG, and occipital pole, and included all eccentricity
quality and choice of processing pipeline, we used high resolution representations within EVC. Although the V3A and V6 regions are not EVC per se,
data processed according to best practices to minimise such they were included in this ROI to ensure the ROI’s spatial continuity and avoid
introducing sharp boundaries that may affect the clustering analysis.
biases. Second, future investigations aiming to ascertain the role A second ROI was defined to cover the MPC, RSC, and cortical areas that relay
of the MOLT in the spatial learning domain would benefit from information from the parietal lobe to the MTL according to the dual-stream
including specific testing for its putative function along with model21 and are important for spatial learning based on human case studies36. It
imaging investigation within the same cohort. Finally, the data we included the following MMP atlas labels: ProS, DVT, POS1, POS2, 7m, 7Pm, 7Am,
used is from a young adult cohort, so future investigations of the PCV, 31pd, 31pv, 31a, d23ab, v23ab, and RSC. Similar to the EVC ROI, this ROI
also included other neighbouring labels of the MMP atlas to ensure its spatial
MOLT’s developmental trajectory may offer insights into the continuity and that no artefactual boundaries are created.
development of visuospatial learning abilities across the lifespan. A third ROI was defined to cover the entire length of the MTL and included the
Based on converging evidence from structural and functional following MMP atlas labels: VMV1, VMV2, VMV3, PHA1, PHA2, PHA3, VVC,
connectivity, and from the distribution of the encoding and EC, PreS, H, and PeEc. These labels mainly span the length of temporal cortex
medial to the collateral sulcus.
retrieval systems within the PPA, we believe that the MOLT Finally, an ROI covering the PPA was obtained from Weiner et al.48 who
serves as a ventral white matter pathway that carries information demonstrated that the location of functional responses within the PPA can be
crucial for visuospatial learning. predicted with high accuracy using surface topology alone. The ROI covered parts
of the posterior CoS and PHG, and anterior LG. This ROI partially overlaps the
following labels from the MMP atlas68: VMV1, VMV2, VMV3, PHA1, PHA2, and
Methods PHA3. The ROI was released by the authors in the form of a FreeSurfer label
MRI data. DWI data from 200 healthy participants (100 females; age = registered to the ‘fsaverage’ template, which we subsequently realigned to the
29.16 ± 3.73 years) were obtained from the Human Connectome Project (https:// ‘32k_FS_LR’ template following HCP guidelines.
COMMUNICATIONS BIOLOGY | (2022)5:318 | https://doi.org/10.1038/s42003-022-03265-4 | www.nature.com/commsbio 7ARTICLE COMMUNICATIONS BIOLOGY | https://doi.org/10.1038/s42003-022-03265-4
Connection density in the MTL. The aim of this analysis was to assess the spatial a cuneus ROI was defined on consecutive sagittal sections to cover the grey and
distribution of the density of connections stemming from the EVC and RSC/MPC white matter of medial occipital lobe, superior to the calcarine sulcus. A second
ROIs, and projecting within the MTL. To this end, the vertex-wise connectivity occipital ROI was similarly defined to cover the lingual gyrus, inferior to the
matrices previously computed were filtered to only keep connections between the calcarine sulcus. Both ROIs were defined to cover EVC areas V1 through V3 as
MTL and either of these ROIs. The obtained values for the MTL vertices were then confirmed by a good overlap with these regions in the atlas. Third, a medial
sorted according to the position of each vertex along the y-axis and grouped into temporal ROI was defined to cover the entire extent of the MTL. This ROI was
1 mm bins. The connectivity value was first computed for each subject separately in similar to the MTL ROI defined for the surface-based analysis and extended
each bin, then the group mean and standard deviation were calculated. This posteriorly to cover cortical labels anterior to, and excluding V2. To capture the
effectively allowed for the assessment of the relationship between the location of an streamlines that terminate within the PPA only, a stopping ROI was defined on a
MTL vertex along the anterior-posterior axis and the strength of its connectivity to coronal section anterior to the PPA, at the y-coordinate of −26 mm (MNI).
the EVC or RSC/MPC ROIs. A Spearman rank correlation was finally computed to To dissect the dorsal component of the bundle of interest, streamlines that
assess the relationship between projection density and position along the y-axis. terminate in the MTL on one end and the cuneus on the other end were included.
To dissect the ventral component, streamlines that terminate in the MTL on one
end and the lingual gyrus on the other end were included. For both components,
PPA clustering and connectivity analysis. The aim of this analysis was to assess no streamlines were allowed to extend anteriorly beyond the coronal stopping ROI.
whether the PPA contains multiple sub-units with different anatomical con-
nectivity profiles based on a data-driven approach. First, the values of the subject-
level connectivity matrices previously computed were converted to z-scores70, and Assessment of lateralisation and vertical bias in the dissected tracts. Hemi-
the mean z-matrix was computed. This matrix was then filtered to only retain the spheric lateralisation for each of the dorsal and ventral components was assessed
connections between the PPA on one end, and both the EVC and RSC/MPC ROIs according to the following formula:
on the other end. valueright valueleft
The mean z-matrix was entered into a principal component analysis (PCA). In this lateralisation ¼ ð1Þ
valueright þ valueleft
context, the z-matrix acted as a large dataset where the PPA vertices represented
variables and the EVC/RSC/MPC vertices represented observations of these variables. where value represents one of the following metrics: (1) tract volume; (2) surface
This approach was blind to the locations of vertices on the brain surface and was thus area of connected EVC cortex; (3) hindrance modulate orientational anisotropy
completely driven by the connectivity profile of each PPA vertex. A scree plot71 was (HMOA). In this way, a lateralisation toward the right hemisphere would lead to
used to determine the number of components to retain. The resulting principal positive values, and left lateralisation would lead to negative values.
components effectively represented the PPA region in a reduced space of only a few Additionally, given that that PPA contains a substantially larger representation of
variables. Importantly, this step also acted as a filter that suppressed contributions from the upper visual field47,55, the connectivity between the PPA and ventral EVC (LG,
‘noisy’ connections, or ones that had very high inter-subject variability. representing the upper visual field) was expected to be stronger than that with dorsal
Agglomerative hierarchical clustering (Euclidean distance, ward algorithm) was EVC (Cu, representing the lower visual field). This vertical bias was assessed following a
applied to the resulting principal component coefficients to extract binary clusters similar approach to the one used for lateralisation, according to the following formula:
within the PPA. This approach resulted in a dendrogram (hierarchy tree) where each
valueCu valueLG
observation (PPA vertex) was linked to other observations in a hierarchical fashion. vertical bias ¼ ð2Þ
These links defined clusters of vertices that were most similar in their loadings on the valueCu þ valueLG
principal components. The spread vs. separation (SS) index proposed by Moreno- where value also represents one the previously described metrics, and where a
Dominguez et al.38 was used to objectively determine the optimal number of clusters. A dominance of the Cu component would result in positive values and a dominance of
higher SS index means that the variability of observations between clusters is greater the LG component would result in negative values.
than the variability within clusters. Therefore, the number of clusters was chosen to For each of these comparisons, statistical significance was determined through a
correspond to the highest SS index. one sample t-test (two-tailed) performed on the resulting bias index. The
The mean structural connectivity of each resulting cluster was then obtained from Bonferroni corrected significance level was set to 0.0042.
the mean connectivity matrix previously computed. Additionally, the mean functional
connectivity of each cluster was calculated based on the group average dense resting-
state functional connectome released by the HCP as part of the ‘HCP- Statistics and reproducibility. This study used MRI data from 200 subjects. All
S1200_GroupAvg_v1’ dataset (https://www.humanconnectome.org/study/hcp-young- statistical analyses were conducted in MATLAB using built-in functions (such as
adult/document/extensively-processed-fmri-data-documentation). Tract-based pca and pdist), and custom scripts to build on those functions. Where appropriate,
connectivity values, which follow a heavily skewed distribution compared to functional Bonferroni correction was used to control for FWE in multiple comparisons. For
connectivity, were log-transformed38,72. Spearman rank correlations (one-tailed) were hemisphere or tract component comparisons, two-tailed paired samples t-tests
then computed between tract-based and functional connectivity measures for each were conducted in MATLAB.
cluster to assess the degree of agreement between the two modalities.
Reporting summary. Further information on research design is available in the Nature
Research Reporting Summary linked to this article.
Functional meta-analysis. Two association test maps were generated for the terms
‘encoding’ and ‘retrieval’ following a meta-analytic approach40 using NeuroSynth
(https://neurosynth.org/). For each voxel, these maps contain a z-score from a two- Data availability
way ANOVA indicating how consistently that voxel is activated in studies that The pre-processed diffusion MRI data and structural surface models used in this study
mention the key term compared with studies that do not. These maps are corrected were obtained from the Human Connectome Project (HCP) database (https://
for multiple comparisons using a false discovery rate of 0.01. Each map was pro- db.humanconnectome.org). The resting-state functional connectivity dataset was
jected to the surface of the MNI brain, allowing us to use the PPA mask as an ROI obtained from a processed release of HCP data (https://www.humanconnectome.org/
for the analysis. The maximum z-score for each coordinate along the PPA’s study/hcp-young-adult/document/extensively-processed-fmri-data-documentation). The
anterior-posterior axis was plotted for each of the two maps, allowing us to meta-analysis voxel-wise maps were obtained from NeuroSynth (https://neurosynth.org).
compare their distribution along the PPA. Population atlas maps of the MOLT are available through the MegaTrack Atlas (http://
megatrackatlas.org). Source data underlying main figures are presented in Supplementary
Data 1–4.
Virtual dissections. Virtual dissections were performed in TrackVis (http://
trackvis.org/) to extract the anatomical bundle that gave rise to the observed
connectivity patterns between the posterior PPA cluster and the EVC in the Code availability
clustering analysis. The analyses performed here are based on MATLAB built-in functions. Wrapper scripts
MegaTrack42, a supervised semi-automatic group-level approach, was used to written for this paper are available upon request from the corresponding author.
handle the large number of participants. Each participant’s anisotropic power
map73 was mapped to the space of the MNI152 template using the symmetric
normalisation algorithm in ANTs74,75. The resulting affine and diffeomorphic Received: 11 April 2021; Accepted: 8 March 2022;
warping were applied to each participant’s tractogram and all tractograms were
concatenated to create a single ‘mega’ tractography dataset. Due to the large size of
the resulting tractogram, only streamlines terminating within the MTL were
retained beyond this step using a manually defined ROI (Supplementary Fig. 4).
After performing virtual dissections of the large dataset in common space, each
participant’s streamlines were mapped back to native space where tract-specific References
measurements could be extracted, and cortical projections analysed. 1. O’Keefe, J. & Dostrovsky, J. The hippocampus as a spatial map: Preliminary
To isolate the tracts of interest, ROIs were manually defined in the medial evidence from unit activity in the freely-moving rat. Brain Res. 34, 171–175
occipital and temporal lobes (Supplementary Fig. 4), guided by a volumetric (1971).
version of the MMP atlas (https://identifiers.org/neurovault.collection:1549). First,
8 COMMUNICATIONS BIOLOGY | (2022)5:318 | https://doi.org/10.1038/s42003-022-03265-4 | www.nature.com/commsbioCOMMUNICATIONS BIOLOGY | https://doi.org/10.1038/s42003-022-03265-4 ARTICLE
2. Burgess, N., Maguire, E. A. & O’Keefe, J. The human hippocampus and spatial 33. Catani, M. Occipital white matter networks. In International School of Clinical
and episodic memory. Neuron 35, 625–641 (2002). Neuroanatomy (2014).
3. Maguire, E. A. et al. Navigation-related structural change in the hippocampi of 34. Vergani, F., Mahmood, S., Morris, C. M., Mitchell, P. & Forkel, S. J. Intralobar
taxi drivers. Proc. Natl Acad. Sci. USA 97, 4398–4403 (2000). fibres of the occipital lobe: A post mortem dissection study. Cortex 56,
4. Maguire, E. A., Frith, C. D., Burgess, N., Donnett, J. G. & O’Keefe, J. Knowing 145–156 (2014).
where things are: Parahippocampal involvement in encoding object locations 35. Koutsarnakis, C. et al. Sledge runner fasciculus: Anatomic architecture and
in virtual large-scale space. J. Cogn. Neurosci. 10, 61–76 (1998). tractographic morphology. Brain Struct. Funct. 224, 1051–1066 (2019).
5. Owen, A. M., Milner, B., Petrides, M. & Evans, A. C. A specific role for the 36. Maguire, E. The retrosplenial contribution to human navigation: A review of
right parahippocampal gyrus in the retrieval of object-location: A positron lesion and neuroimaging findings. Scand. J. Psychol. 42, 225–238 (2001).
emission tomography study. J. Cogn. Neurosci. 8, 588–602 (1996). 37. Epstein, R. A., Parker, W. E. & Feiler, A. M. Where am I now? Distinct roles
6. Aguirre, G. K., Detre, J. A., Alsop, D. C. & D’Esposito, M. The parahippocampus for parahippocampal and retrosplenial cortices in place recognition. J.
subserves topographical learning in man. Cereb. Cortex 6, 823–829 (1996). Neurosci. 27, 6141–6149 (2007).
7. Bohbot, V. D. et al. Spatial memory deficits in patients with lesions to the right 38. Moreno-Dominguez, D., Anwander, A. & Knösche, T. R. A hierarchical
hippocampus and to the right parahippocampal cortex. Neuropsychologia 36, method for whole-brain connectivity-based parcellation. Hum. Brain Mapp.
1217–1238 (1998). 35, 5000–5025 (2014).
8. Ploner, C. J. et al. Lesions affecting the parahippocampal cortex yield spatial 39. Gould, R. L. et al. Functional neuroanatomy of successful paired associate
memory deficits in humans. Cereb. Cortex 10, 1211–1216 (2000). learning in Alzheimer’s disease. Am. J. Psychiatry 162, 2049–2060 (2005).
9. Bohbot, V. D. et al. Role of the parahippocampal cortex in memory for the 40. Yarkoni, T., Poldrack, R. A., Nichols, T. E., Van Essen, D. C. & Wager, T. D.
configuration but not the identity of objects: Converging evidence from Large-scale automated synthesis of human functional neuroimaging data. Nat.
patients with selective thermal lesions and fMRI. Front. Hum. Neurosci. 9, 431 Methods 8, 665–670 (2011).
(2015). 41. Prince, S. E., Dennis, N. A. & Cabeza, R. Encoding and retrieving faces and
10. Pihlajamäki, M. et al. Visual presentation of novel objects and new spatial places: Distinguishing process- and stimulus-specific differences in brain
arrangements of objects differentially activates the medial temporal lobe activity. Neuropsychologia 47, 2282–2289 (2009).
subareas in humans. Eur. J. Neurosci. 19, 1939–1949 (2004). 42. Dell’Acqua, F. et al. MegaTrack: A fast and effective strategy for group
11. Malkova, L. & Mishkin, M. One-trial memory for object-place associations comparison and supervised analysis of large-scale tractography datasets. Proc.
after separate lesions of hippocampus and posterior parahippocampal region Int. Soc. Magn. Reson. Med. 23, 2843 (2015).
in the monkey. J. Neurosci. 23, 1956–1965 (2003). 43. Dell’Acqua, F., Simmons, A., Williams, S. C. R. & Catani, M. Can spherical
12. Epstein, R. & Kanwisher, N. A cortical representation of the local visual deconvolution provide more information than fiber orientations? Hindrance
environment. Nature 392, 598–601 (1998). modulated orientational anisotropy, a true-tract specific index to characterize
13. Konen, C. S., Behrmann, M., Nishimura, M. & Kastner, S. The functional white matter diffusion. Hum. Brain Mapp. 34, 2464–2483 (2013).
neuroanatomy of object agnosia: A case study. Neuron 71, 49–60 (2011). 44. Margulies, D. S. et al. Precuneus shares intrinsic functional architecture in
14. Mishkin, M., Ungerleider, L. G. & Macko, K. Object vision and spatial vision: humans and monkeys. Proc. Natl Acad. Sci. USA 106, 20069–20074 (2009).
Two cortical pathways. Trends Neurosci. 6, 414–417 (1983). 45. Silson, E. H., Steel, A., Kidder, A., Gilmore, A. W. & Baker, C. I. Distinct
15. Mcnaughton, B. L., Leonard, B. & Chen, L. Cortical-hippocampal interactions subdivisions of human medial parietal cortex support recollection of people
and cognitive mapping: A hypothesis based on reintegration of the parietal and places. Elife 8, e47391 (2019).
and inferotemporal pathways for visual processing. Psychobiology 17, 230–235 46. Saleem, K. S., Price, J. L. & Hashikawa, T. Cytoarchitectonic and
(1989). chemoarchitectonic subdivisions of the perirhinal and parahippocampal
16. Epstein, R., Harris, A., Stanley, D. & Kanwisher, N. The parahippocampal cortices in macaque monkeys. J. Comp. Neurol. 500, 973–1006 (2007).
place area: Recognition, navigation, or encoding? Neuron 23, 115–125 (1999). 47. Arcaro, M. J., McMains, S. A., Singer, B. D. & Kastner, S. Retinotopic
17. Baldassano, C., Beck, D. M. & Fei-Fei, L. Differential connectivity within the organization of human ventral visual cortex. J. Neurosci. 29, 10638–10652
parahippocampal place area. Neuroimage 75, 236–245 (2013). (2009).
18. Baldassano, C., Fei-Fei, L. & Beck, D. M. Pinpointing the peripheral bias in neural 48. Weiner, K. S. et al. Defining the most probable location of the
scene-processing networks during natural viewing. J. Vis. 16, 1–14 (2016). parahippocampal place area using cortex-based alignment and cross-
19. Burles, F., Slone, E. & Iaria, G. Dorso-medial and ventro-lateral functional validation. Neuroimage 170, 373–384 (2018).
specialization of the human retrosplenial complex in spatial updating and 49. Kravitz, D. J., Peng, C. S. & Baker, C. I. Real-world scene representations in
orienting. Brain Struct. Funct. 222, 1481–1493 (2017). high-level visual cortex: It’s the spaces more than the places. J. Neurosci. 31,
20. Whitlock, J. R., Sutherland, R. J., Witter, M. P., Moser, M.-B. & Moser, E. I. 7322–7333 (2011).
Navigating from hippocampus to parietal cortex. Proc. Natl Acad. Sci. USA 50. Aminoff, E., Gronau, N. & Bar, M. The parahippocampal cortex mediates
105, 14755–14762 (2008). spatial and nonspatial associations. Cereb. Cortex 17, 1493–1503 (2007).
21. Kravitz, D. J., Saleem, K. S., Baker, C. I. & Mishkin, M. A new neural 51. Aminoff, E. M., Kveraga, K. & Bar, M. The role of the parahippocampal cortex
framework for visuospatial processing. Nat. Rev. Neurosci. 12, 217–230 (2011). in cognition. Trends Cogn. Sci. 17, 379–390 (2013).
22. Dalton, M. A., McCormick, C. & Maguire, E. A. Differences in functional 52. Catani, M., Howard, R. J., Pajevic, S. & Jones, D. K. Virtual in vivo interactive
connectivity along the anterior-posterior axis of human hippocampal dissection of white matter fasciculi in the human brain. Neuroimage 17, 77–94
subfields. Neuroimage 192, 38–51 (2019). (2002).
23. Epstein, R. A. Parahippocampal and retrosplenial contributions to human 53. Catani, M., Jones, D. K., Donato, R. & Ffytche, D. H. Occipito-temporal
spatial navigation. Trends Cogn. Sci. 12, 388–396 (2008). connections in the human brain. Brain 126, 2093–2107 (2003).
24. Baldassano, C., Esteva, A., Fei-Fei, L. & Beck, D. M. Two distinct scene- 54. Bugain, M. et al. Occipital intralobar fasciculi: A description, through
processing networks connecting vision and memory. eNeuro 3, tractography, of three forgotten tracts. Commun. Biol. 4, 433 (2021).
ENEURO.0178-16.2016 (2016). 55. Silson, E. H., Chan, A. W.-Y., Reynolds, R. C., Kravitz, D. J. & Baker, C. I. A
25. Rossetti, Y., Pisella, L. & McIntosh, R. D. Rise and fall of the two visual retinotopic basis for the division of high-level scene processing between lateral
systems theory. Ann. Phys. Rehabil. Med. 60, 130–140 (2017). and ventral human occipitotemporal cortex. J. Neurosci. 35, 11921–11935
26. Bastin, J. et al. Temporal components in the parahippocampal place area (2015).
revealed by human intracerebral recordings. J. Neurosci. 33, 10123–10131 56. Aguirre, G. K. & D’Esposito, M. Topographical disorientation: A synthesis and
(2013). taxonomy. Brain 122, 1613–1628 (1999).
27. Bastin, J. et al. Timing of posterior parahippocampal gyrus activity reveals 57. Hochstein, S. & Ahissar, M. View from the top: Hierarchies and reverse
multiple scene processing stages. Hum. Brain Mapp. 34, 1357–1370 (2013). hierarchies in the visual system. Neuron 36, 791–804 (2002).
28. Dalton, M. A. & Maguire, E. A. The pre/parasubiculum: A hippocampal hub 58. Van Hoesen, G. W. The parahippocampal gyrus: New observations regarding
for scene-based cognition? Curr. Opin. Behav. Sci. 17, 34–40 (2017). its cortical connection in the monkey. Trends Neurosci. 5, 345–350 (1982).
29. Kravitz, D. J., Saleem, K. S., Baker, C. I., Ungerleider, L. G. & Mishkin, M. The 59. Oldfield, R. C. The assessment and analysis of handedness: The Edinburgh
ventral visual pathway: An expanded neural framework for the processing of inventory. Neuropsychologia 9, 97–113 (1971).
object quality. Trends Cogn. Sci. 17, 26–49 (2013). 60. Dell’Acqua, F. & Tournier, J. ‐Donal. Modelling white matter with spherical
30. Ungerleider, L. G., Galkin, T. W., Desimone, R. & Gattass, R. Cortical deconvolution: How and why? NMR Biomed. 32, e3945 (2019).
connections of area V4 in the macaque. Cereb. Cortex 18, 477–499 (2008). 61. Glasser, M. F. et al. The minimal preprocessing pipelines for the Human
31. Gattas, R. Cortical projections of area V2 in the macaque. Cereb. Cortex 7, Connectome Project. Neuroimage 80, 105–124 (2013).
110–129 (1997). 62. Andersson, J. L. R. & Sotiropoulos, S. N. An integrated approach to correction
32. Schmahmann, J. D. & Pandya, D. N. Fiber Pathways of the Brain (Oxford for off-resonance effects and subject movement in diffusion MR imaging.
University Press, 2006). Neuroimage 125, 1063–1078 (2016).
COMMUNICATIONS BIOLOGY | (2022)5:318 | https://doi.org/10.1038/s42003-022-03265-4 | www.nature.com/commsbio 9You can also read