The interdecadal worsening of weather conditions affecting aerosol pollution in the Beijing area in relation to climate warming
←
→
Page content transcription
If your browser does not render page correctly, please read the page content below
Atmos. Chem. Phys., 18, 5991–5999, 2018
https://doi.org/10.5194/acp-18-5991-2018
© Author(s) 2018. This work is distributed under
the Creative Commons Attribution 4.0 License.

The interdecadal worsening of weather conditions affecting aerosol
pollution in the Beijing area in relation to climate warming
Xiaoye Zhang1,2 , Junting Zhong1 , Jizhi Wang1 , Yaqiang Wang1 , and Yanju Liu3
1 StateKey Laboratory of Severe Weather & Key Laboratory of Atmospheric Chemistry of CMA,
Chinese Academy of Meteorological Sciences, Beijing, 100081, China
2 Center for Excellence in Regional Atmospheric Environment, IUE, CAS, Xiamen, 361021, China
3 National Climate Centre, China Meteorological Administration, Beijing, 100081, China

Correspondence: Xiaoye Zhang (xiaoye@gov.cma.cn)

Received: 9 February 2018 – Discussion started: 16 February 2018
Revised: 15 April 2018 – Accepted: 22 April 2018 – Published: 27 April 2018

Abstract. The weather conditions affecting aerosol pollution     ∼ 4 % each year from 2010 to 2017. Given such a deterio-
in Beijing and its vicinity (BIV) in wintertime have wors-       ration rate, the worsening of weather conditions may lead to
ened in recent years, particularly after 2010. The relation      a corresponding amplitude increase in PM2.5 in BIV during
between interdecadal changes in weather conditions and cli-      wintertime in the next 5 years (i.e., 2018 to 2022). More strin-
mate warming is uncertain. Here, we analyze long-term vari-      gent emission reduction measures will need to be conducted
ations of an integrated pollution-linked meteorological index    by the government.
(which is approximately and linearly related to aerosol pol-
lution), the extent of changes in vertical temperature differ-
ences in the boundary layer (BL) in BIV, and northerly sur-
face winds from Lake Baikal during wintertime to evaluate        1   Introduction
the potential contribution of climate warming to changes in
meteorological conditions directly related to aerosol pollu-     Since individuals experienced heavy aerosol pollution
tion in this area; this is accomplished using NCEP reanal-       episodes (HPEs) in January 2013 in Beijing and its vicinity
ysis data, surface observations, and long-term vertical bal-     (BIV) in central–eastern China, changes in aerosol particle
loon sounding observations since 1960. The weather condi-        concentrations and their chemical components have attracted
tions affecting BIV aerosol pollution are found to have wors-    special attention to high population density areas with rapid
ened since the 1960s as a whole. This worsening is more          economic growth (Huang et al., 2014b; Zhang et al., 2013;
significant after 2010, with PM2.5 reaching unprecedented        Guo et al., 2014; Wang et al., 2014, 2015; Sun et al., 2014).
high levels in many cities in China, particularly in BIV. The    However, these studies were mainly concerned with changes
decadal worsening of meteorological conditions in BIV can        in emission sources and changes in aerosol physio-chemical
partly be attributed to climate warming, which is defined by     characterizations. In addition, weather conditions have an
more warming in the higher layers of the boundary layer          important impact on air pollution. Different weather condi-
(BL) than the lower layers. This worsening can also be in-       tions affect atmospheric pollution by changing ventilation
fluenced by the accumulation of aerosol pollution, to a cer-     efficiency (i.e., winds, boundary layer height, convection, or
tain extent (particularly after 2010), because the increase in   frontal passages), dry/wet deposition, loss ratios of chemical
aerosol pollution from the ground leads to surface cooling by    conversion, natural emissions, background concentrations
aerosol–radiation interactions, which facilitates temperature    (Li et al., 2005; Liu et al., 2003; Leibensperger et al., 2008),
inversions, increases moisture accumulations, and results in     early morning solar radiation, frontal passage days (Ordonez
the extra deterioration of meteorological conditions. If ana-    et al., 2005), surface temperature and relative humidity (Ca-
lyzed as a linear trend, weather conditions have worsened by     malier et al., 2007). Specifically, aerosol pollution in Beijing
                                                                 has been possibly affected by southerly/southwesterly sur-

Published by Copernicus Publications on behalf of the European Geosciences Union.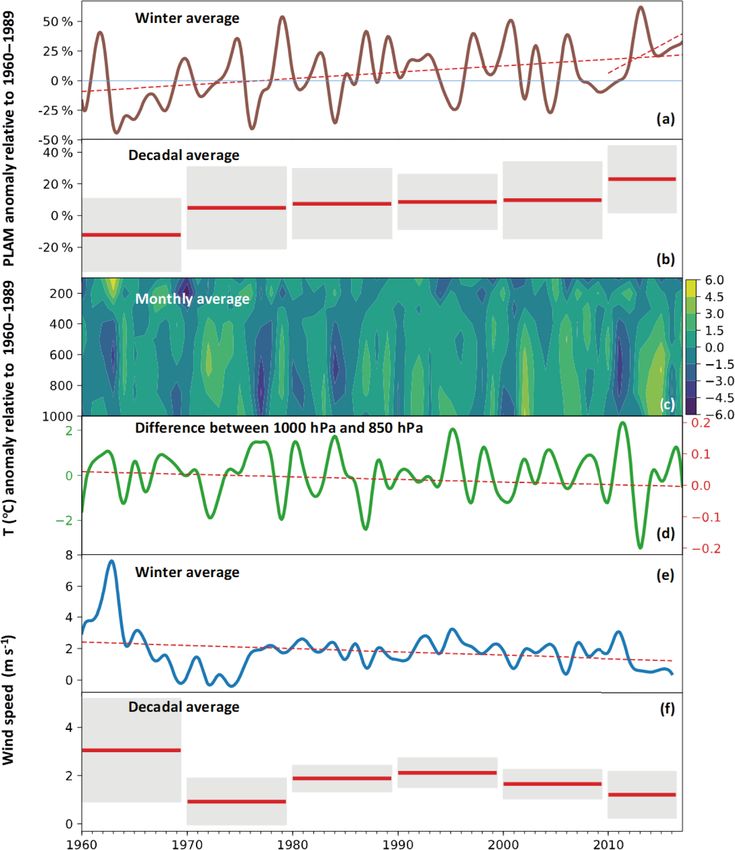
5992                                                         X. Zhang et al.: The interdecadal worsening of weather conditions

                                                                      2   Methods

                                                                      An index of meteorological conditions, PLAM (Parameter
                                                                      Linking Air Quality and Meteorological Elements), which
                                                                      is almost linearly related to PM pollution, is used to reveal
                                                                      changes in regional unfavorable weather conditions that af-
                                                                      fect aerosol pollution in BIV. The formation and accumula-
                                                                      tion of aerosol pollutants are closely related to various meteo-
                                                                      rological factors. However, a single factor cannot completely
                                                                      and linearly reflect pollution conditions, and the effect of
                                                                      some factors even counteract or offset one another (Sui et
                                                                      al., 2007; Pang et al., 2009). To describe meteorological con-
                                                                      ditions that change simultaneously with identical amplitudes
                                                                      for PM mass concentrations during HPEs in winter in BIV,
                                                                      we use one comprehensive meteorological index (PLAM),
                                                                      which mainly indicates regional atmospheric stability and air
                                                                      condensation ability, to reveal changes in regional unfavor-
                                                                      able weather conditions that affect heavy pollution in BIV.
                                                                      The PLAM was derived based on the relationship between
Figure 1. Location of the observational area (Beijing) and the area   PM mass concentrations and key meteorological parameters
of the north wind calculated (marked by square).                      from 2000 to 2007 for various regions in China (Wang et al.,
                                                                      2012, 2013).
                                                                         It was established as a function of the following parame-
face winds. Aerosol pollution was also found to become in-            ters:
creasingly serious during recent decades (Zhang et al., 2015),
which is partially due to increasing emissions in air pollu-
                                                                      PLAM (F ) in f (p, t, w, rh, e, s, c0 , . . .),             (1)
tants from anthropogenic activities (e.g., traffic, industry, and
power plants) (Li et al., 2017), but it is also influenced by
regional and unfavorable weather conditions (Zhang et al.,            where p, t, w, rh, e, s, and c0 represent air pressure, air tem-
2015). Such weather conditions might also be affected by              perature, wind, relative humidity, evaporability, stability, and
the direct, indirect or semi-direct effects of aerosols, includ-      the effective parameter associated with the contribution of air
ing dust aerosols, whose impact on air quality and weather            pollution β(c0 ), respectively. Furthermore, the final PLAM
conditions has been investigated (Shao et al., 2011; Huang            can be attributed to two major separate factors: (1) initial
et al., 2014a; Chen et al., 2017). Questions have been raised         meteorological conditions α(m) associated with atmospheric
regarding changes in weather conditions that affect HPEs in           condensation processes and (2) a dynamic effective param-
BIV from a long-term perspective and the effect of climate            eter associated with the initial contribution of air pollution
warming on meteorological factors that aggravate/alleviate            β(c0 ), which can be expressed as follows:
aerosol pollution in this area.
                                                                      PLAM = α (m) × β c0 .

   Here, we try to find a quantitative link between climate                                                                       (2)
warming and unfavorable weather conditions in BIV from
an interdecadal-scale perspective by investigating available          Initial meteorological contribution can be expressed as the
surface and upper-air observations of different meteorologi-          variation of wet-equivalent potential temperature (θe ):
cal factors; this type of study has not been conducted much
so far. We use long-term balloon sounding observations, par-
                                                                                dθe       fc
ticularly for temperature change in different layers, to ana-         α (m) =       = θe      ,                                   (3)
lyze the vertical diffusion of conditions and northerly winds                   dt       Cp T
from Lake Baikal (which is located in Beijing’s cold air up-
per transport pathway) to measure horizontal diffusion con-           where Cp is the heat capacity of air, T is the temperature,
ditions. The location of the observational area (Beijing) and         and the condensation function fc is described by
the area of the north wind we calculated are shown in Fig. 1.
Since HPEs in BIV usually appear in winter, we focus our                               fcd
                                                                      fc =                               ,                        (4)
research on January data since 1960.                                         [(1 + (L/Cp )(δqs /δT ))p ]

                                                                      where L is the latent heat for condensation or evaporation of
                                                                      water vapor, qs is the specific humidity, and fcd is the dry

Atmos. Chem. Phys., 18, 5991–5999, 2018                                                  www.atmos-chem-phys.net/18/5991/2018/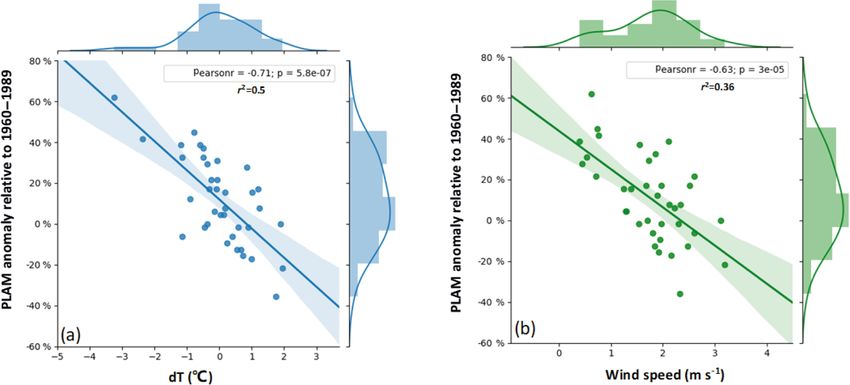
X. Zhang et al.: The interdecadal worsening of weather conditions 5993
condensation function as defined below: average in winter simply from unfavorable weather condi-
" # tions. Here, we use the PLAM in January to explore changes
δqs δqs in meteorological conditions during HPEs in wintertime. Ob-
fcd = +γ , (5)
δP T δT p servations from the observatory (54 511) in southern Beijing
Rd T for 57 years (from 1960 to 2017) were used to calculate the
γp = , (6) PLAM and analyze its long-term changes.
Cp P
Vertical temperature anomalies. Atmospheric vertical ob-
where Rd is the gas constant. The fc and θe only account for servations at standard isobaric surfaces were measured twice
the meteorological contributions to the PM. daily at 08:00 Beijing time (BT) and 20:00 BT; factors mea-
In order to quantify the relative impact of weather condi- sured included winds, temperature and relative humidity
tions on air pollution and eliminate the impact of total aerosol (RH) at the observatory (54 511) in the southern part of Bei-
concentration change, a ratio of the initial weather condi- jing in January from 1960 to 2017. Based on the climato-
tions to the observed pollution is introduced as the relative logical mean temperature in January, which was calculated
dynamic affect parameter µ: as the 30-year atmospheric climate basic state (i.e., 1960–
α(m) 1989), the temperature anomaly (δT ) from 1960 to 2017 at
µ= , (7) different pressure layers (1000–100 hPa) was calculated.
c0
Northerly winds from Lake Baikal. Based on the
where c0 represents the initial contribution of air pollution. NCEP/NCAR reanalysis data, we defined the mean northerly
To reduce a sharp seasonal variation in meteorological pa- wind velocity from Lake Baikal in January as an indicator of
rameters and derive a parameter applicable for a wider range the effects of winter monsoons on pollution-linked weather
of conditions, an adaptive function β 0 is introduced: conditions in BIV (Fig. 1).
(1 − µ)i−1
β0 = , (8)
µ
which completes the definition of Eq. (2) for the PLAM 3 Results and discussion
(Wang et al., 2012, 2013; Zhang et al., 2009).
This index has been employed to evaluate the contribution Weather conditions linked to aerosol pollution in BIV in win-
of meteorological factors to changes in atmospheric compo- tertime have worsened since the 1960s, and the worsening is
sition and optical properties over Beijing during the 2008 more obvious after the 1980s.
Olympic Games, identify the contribution of specific meteo- Observed January PLAM values in Beijing exhibited an
rological factors to a 10-day haze–fog event in 2013 (Zhang increasing trend from 1960 to 2017; particularly, positive
et al., 2013), estimate the relative contribution of meteoro- anomalies have occurred since the 1980s, which shows
logical factors to changes in aerosol mass concentrations and that weather diffusion conditions favoring aerosol pollu-
chemical compositions in different regions of China during tion in wintertime have strikingly worsened since the 1980s
winter from 2006 to 2013 (Zhang et al., 2015) and distin- (Fig. 3a). Meanwhile, China’s reform and opening up be-
guish the feedback effect of meteorological conditions on gan nearly 40 years of rapid economic growth, with a large
the explosive increase in PM2.5 mass concentration during amount of energy consumption with coal as the major part.
accumulation stages in the Beijing area (Zhong et al., 2017; For example, in the year of 1980, China consumed approx-
Zhang et al., 2017). imately 0.6 billion tons of coal. By 2013, China’s total coal
Because weather conditions that affect Beijing simulta- consumption was approximately 2.5 billion tons, which is a
neously affect a relatively large area, including Jing-Jin-Ji factor of 4 increase (NBS-China, 2014). Because the PLAM
(i.e., Beijing, Tianjin and Hebei Province) and its adjacent primarily reflects the stability of air masses and the con-
areas (including Shandong and Henan provinces and the densation rate of water vapor on aerosol particles, it is lin-
Guanzhong Plain) in China (Zhang et al., 2012), we use the early related to the PM mass change (Wang et al., 2012,
PLAM determined by meteorological data from an obser- 2013; Zhang et al., 2009). Approximately 20 % of increas-
vatory in Beijing to represent regional unfavorable weather ing PLAM values since the 1980s, when calculated with a
conditions, which are closely related to aerosol pollution in linear trend (Fig. 3a), have been thought to cause an in-
BIV. crease in PM2.5 with similar amplitudes; this 20 % change
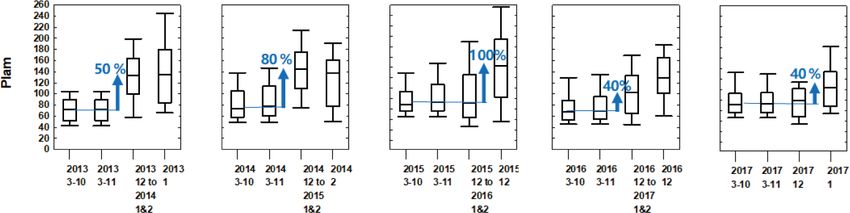
HPEs often occur in wintertime; therefore, we compared has been considered to be only caused by intensive unfa-
the average PLAM in winter with the other three seasons vorable weather. It is no wonder that in the case for con-
from 2013 to 2017 (Fig. 2). It was found that adverse weather tinued and increased emissions, when coupled with worsen-
conditions in winter are 1.4 to 2× worse than those in other ing weather conditions, the upper limit of the environmental
seasons, which indicates that even if no additional pollution capacity in BIV was exceeded in January of 2013; 10 days
sources were added in winter (e.g., heating), PM2.5 mass con- of severe aerosol pollution first appeared in central–eastern
centrations are going to increase by at least 40 to 100 % on China, with the most serious pollution appearing in BIV.
www.atmos-chem-phys.net/18/5991/2018/ Atmos. Chem. Phys., 18, 5991–5999, 2018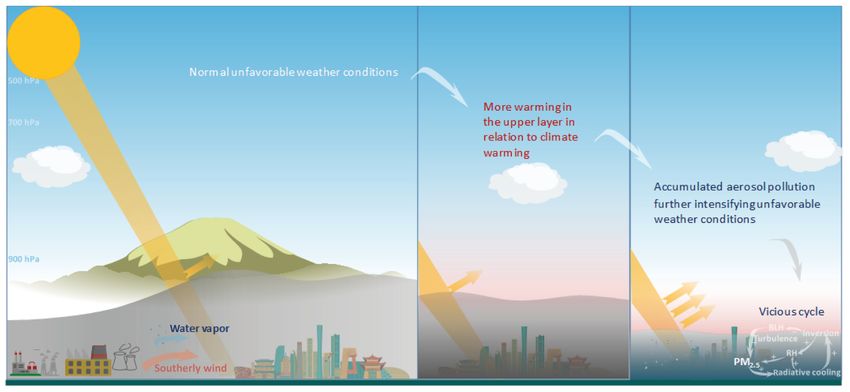
5994                                                      X. Zhang et al.: The interdecadal worsening of weather conditions

Figure 2. Comparison of the averaged PLAM in winter with the other three seasons from 2013 to 2017 in BIV.

Figure 3. Changes in PLAM, vertical temperature in BIV and northerly wind from Lake Baikal since 1960.

  Based on the average interdecadal change in the PLAM               mulated to a certain extent, it caused the further deteriora-
during wintertime (Fig. 3b), it can be seen that the PLAM            tion of weather conditions, which has been found in almost
has been increasing since the 1960s. Particularly, in the last 8     all HPEs in the Beijing area since 2013 (Zhong et al., 2017,
years between 2010 and 2017, the mean of PLAM increased              2018; Zhang et al., 2017). Therefore, we hypothesized that
more than the growth rate of the mean of each of the previ-          the substantial rise in mean PLAM between 2010 and 2017
ous 10 years, which exhibited more noticeable unfavorable            should have benefited from the further worsening of meteo-
weather conditions. When the PM2.5 mass pollution accu-              rological conditions caused by higher PM2.5 mass concentra-

Atmos. Chem. Phys., 18, 5991–5999, 2018                                                www.atmos-chem-phys.net/18/5991/2018/
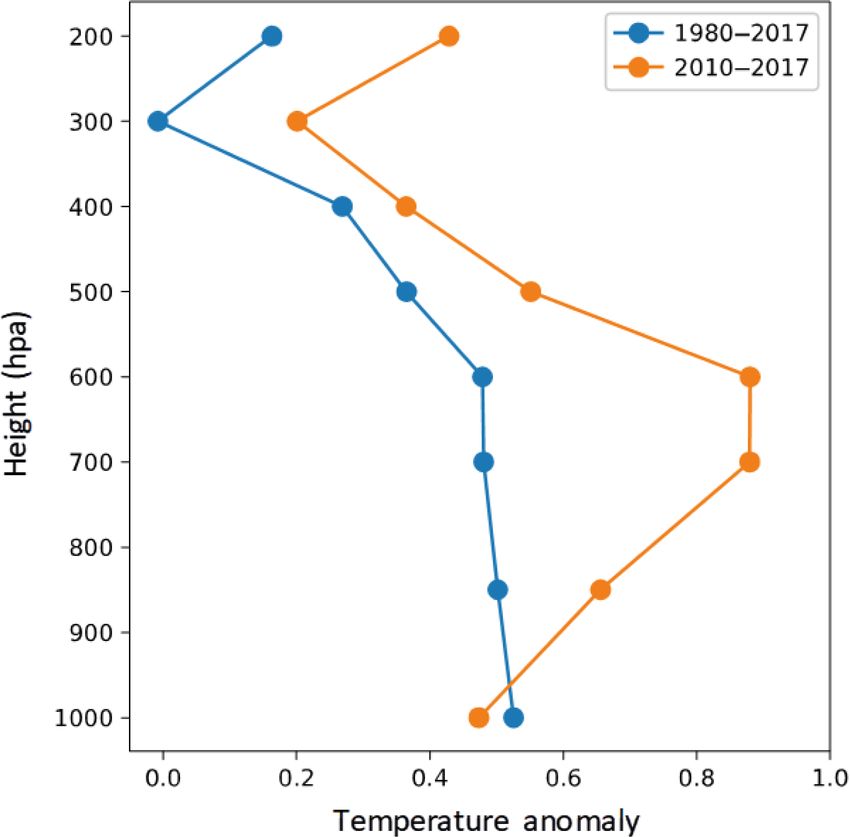
X. Zhang et al.: The interdecadal worsening of weather conditions                                                          5995

tions that reached a certain extent. In BIV, aerosol pollution    were indeed closely related to climate warming. With ∼ 0.5
has become increasingly serious during the past decades, par-     of the explained variance, one can believe that the contribu-
ticularly since 2010 (Zhang et al., 2015); in January 2013,       tion of temperature differences due to climate warming to the
February 2014, December 2015, and December 2016 to 10             continued increase in Beijing’s PLAM is around 50 % in the
January 2017, 12 persistent HPEs occurred in Beijing, and         month of January since the 1980s.
the mass concentrations of PM2.5 were at historically high           The decadal worsening of meteorological conditions, es-
levels (Zhong et al., 2018). There will be a detailed discus-     pecially when aerosol pollution increased to a certain extent
sion on this issue in a later section.                            after 2010, may also be partly related to aerosol pollution,
   The decadal worsening of meteorological conditions in          which induces further worsening of meteorological condi-
BIV was partly attributed to climate warming.                     tions.
   Climate warming has a series of consequences. The ver-            The larger rise in the PLAM mean value between 2010
tical gradient of atmospheric temperature decreases with the      and 2017 in BIV (Fig. 3b) can be considered to be partly
influence of climate warming (Dessler and Davis, 2013; Held       attributed to a vicious cycle in meteorological conditions,
and Soden, 2006). The decadal warming is accompanied by           which resulted from aerosol pollution increasing to a certain
increases in mid and upper tropospheric specific humidity.        extent. This can also be explained in detail, as an example, in
The warmer the atmosphere is, the smaller the temperature         Fig. 5.
gradient is, and the more stable the atmosphere is, the greater      We found a surface cooling effect indicated by mean tem-
the accumulation of air pollution in the surface boundary         perature anomalies, which was more striking from 2010 to
layer. In this study, it can be seen that the relative upper BL   2017 relative to that from 1980 to 2017. Aerosol pollution in
in Beijing is warmer than the lower layer (Fig. 3c–d), which      the BIV region has reached a very serious level since 2010
is indicative of the climate warming phenomenon in BIV. By        (Zhang et al., 2015), which was much higher than that in
analyzing 49 pollution episodes, Wu et al. (2017) found that      the 1980s. Remarkably, more aerosols back-scattered a larger
the occurrence of pollution accumulation is often caused by       amount of radiation into space, which caused a significant re-
the occurrence of high-level convergence layer in the context     duction in radiation reaching the ground. This phenomenon
of climate warming. Weak westerly or northwesterly winds          (i.e., when aerosol pollution reaches a certain extent and re-
dominate in the mid–upper troposphere and a convergence           sults in a temperature inversion near the surface layer, which
layer appears between 500 and 700 hPa (Wu et al., 2017),          causes more stable atmospheric stratification) was widely
which produce persistent and strong sinking motion in the         found in a large number of HPEs in BIV after 2013 (Zhong
mid–lower troposphere to reduce the BL height and accumu-         et al., 2018).
late pollutants (Wu et al., 2017). As a result of air masses         A feedback loop of climate warming intensifying local
sinking in the mid–lower troposphere, diverging in the lower      unfavorable weather conditions, forming aerosol pollution,
layers, and being warmed by adiabatic compression, a subsi-       and the accumulated aerosol pollution further exacerbating
dence inversion appears in the lower layers, which facilitates    the local unfavorable weather conditions and having a vi-
pollutant accumulation.                                           cious cycle of aerosol pollution, are illustrated in Fig. 6.
   In Fig. 3c, we found that the monthly mean tempera-            Climate warming via mid–upper tropospheric-specific hu-
ture anomalies below 200 hPa exhibited warming in some            midity increase and air adiabatic sinking causes more up-
years since 1960, despite the inter-annual variability. The       per atmosphere warming relative to the lower one, easily
difference in temperature anomalies between 1000 and              forming unfavorable weather in BIV to form aerosol pol-
850 hPa decreased throughout the time period since 1960           lution. During the transport stage (TS) in pollution forma-
when described by a linear trend (Fig. 3d), which indicated       tion, relatively strong southerly winds prevail in the lower
that temperature differences between the upper and lower          troposphere in BIV, which transports pollutants and water
boundary layers gradually declined in BIV, resulting in a         vapor from the south of Beijing to the urban area of Bei-
more stable atmospheric stratification in this region. Be-        jing. When the pollution accumulates to a certain extent dur-
cause PLAM anomalies gradually became positive after the          ing the cumulative stage (CS), elevated PM2.5 established by
1980s (Fig. 3a), temperature anomalies between 1000 and           the TS back-scatters amounts of solar radiation to space due
850 hPa also became negative approximately after the 1980s        to its scattering property, which leads to near-ground radia-
(Fig. 3d); this shows again that weather conditions after the     tive cooling. This radiation reduction reduces near-ground
1980s, when China’s reform and opening up led to the forma-       temperature to facilitate anomalous inversion, which subse-
tion of more aerosol pollution, worsened compared to those        quently suppresses vertical turbulent diffusion and decreases
before the 1980s within the context of climate warming. The       BL height to further trap pollutants and water vapor. Induced
correlation coefficient between the monthly mean PLAM             by surface cooling, decreased saturation vapor pressure sub-
and the temperature anomaly difference between 1000 and           stantially enhances RH. The joint effect of inversion suppres-
850 hPa since the 1980s was −0.71 (exceeding the 0.05 sig-        sion and surface cooling results in appreciable near-ground
nificance level) (Fig. 4), which suggests that weather condi-     moisture accumulation, which further accelerates heteroge-
tions most directly related to pollution in Beijing (PLAM)        neous and liquid-phase reactions and enhances aerosol hy-

www.atmos-chem-phys.net/18/5991/2018/                                              Atmos. Chem. Phys., 18, 5991–5999, 2018
5996                                                      X. Zhang et al.: The interdecadal worsening of weather conditions

Figure 4. (a) Correlations between the monthly mean PLAM anomalies and the temperature anomaly difference between 1000 and 850 hPa
since the 1980s; (b) correlations between the monthly mean PLAM anomalies and wind speed from Lake Baikal since the 1980s.

                                                                   clean periods and pollution episodes in BIV, respectively, be-
                                                                   cause northerly winds (which originate from less populated
                                                                   northern mountainous areas) carry unpolluted air masses,
                                                                   while southerly winds carry polluted air masses from more
                                                                   populated and polluted southern industrial regions (Jia et al.,
                                                                   2008; Guo et al., 2014; Zhong et al., 2018).
                                                                      Because Lake Baikal is located in the upper transport path-
                                                                   way of northerly winds in winter and is less affected by
                                                                   increasing/decreasing surface roughness in urban areas, the
                                                                   northerly winds from Lake Baikal substantially affect cold
                                                                   air mass movement to the North China Plain, which further
                                                                   affects the formation and elimination of aerosol pollution in
                                                                   BIV (Fig. 3e). We found that monthly mean northerly wind
                                                                   speed from Lake Baikal has declined over the past 57 years,
                                                                   particularly with respect to the past 27 years (i.e., since the
                                                                   1980s). The mean wind speeds during 1960–1969, 1970–
                                                                   1979, 1980–1989, 1990–1999, and 2010–2016 are 3.0, 0.92,
                                                                   1.88, 2.11, 1.64, and 1.21 m s−1 , respectively (Fig. 3f), which
                                                                   indicate that the northerly wind speed has declined gradu-
Figure 5. Temperature anomaly vertical profile. Blue denotes the
mean temperature anomaly from 1980 to 2017 relative to 1960 to
                                                                   ally as a whole since 1960. By carrying less cold and dry
1989; orange denotes the mean temperature anomaly from 2010 to     air over the North China Plain, weakened northerly winds
2017 relative to 1960 to 1989).                                    are unfavorable for atmospheric diffusion. Over the past
                                                                   37 years, the correlation coefficient between northerly wind
                                                                   speed and PLAM is −0.63 (exceeding the 0.05 significance
groscopic growth to increase PM2.5 mass concentration. The         level), which suggests that the year-to-year variability of the
noted positive meteorological feedback dominates PM2.5 ex-         northerly wind speed is closely associated with PLAM vari-
plosive growth (Zhong et al., 2017, 2018; Zhang et al., 2017).     ability. The number is statistically significant (p < 0.1 % for
   The weakening of northerly wind affecting BIV in winter-        the correlation coefficient).
time also contributed to the continuous deterioration of me-          For changes in surface wind, Mcvicar et al. (2012) found
teorological conditions in this area.                              that a decrease in surface wind was observed in major regions
   Wind conditions represent one critical parameter in reg-        of the world (Mcvicar et al., 2012). Such surface wind trends
ulating the cycles of pollution episodes in an area. Strong        can be due to increasing surface roughness, the decrease in
northerly winds and southerly winds closely correspond to          synoptic weather system intensity and/or changes in mean

Atmos. Chem. Phys., 18, 5991–5999, 2018                                             www.atmos-chem-phys.net/18/5991/2018/
X. Zhang et al.: The interdecadal worsening of weather conditions 5997
Figure 6. Schematic loop of important feedback for climate warming–unfavorable local and regional weather conditions–forming and accu-
mulating aerosol pollution–further intensifying unfavorable weather conditions–more pollution.
circulation (Vautard et al., 2010). A variety of studies found on aerosol pollution, which induces further worsening of me-
that surface winds decreased substantially in China (Xu et al., teorological conditions when increasing aerosol pollution to
2006; Guo et al., 2015; Chen et al., 2013). In the urban area of a certain extent (particularly after 2010). The impacts of cli-
Beijing, the decrease in winds below 300 m was considered mate change on meteorological conditions that are directly
to be partly due to increasing surface roughness caused by related to aerosol pollution in BIV can also be verified in an-
land-use change (Liu et al., 2017). However, this reason does other aspect: the decrease in wind speed from Lake Baikal
not suffice when explaining wind speed changes from Baikal, in winter. Climate warming, characterized by an increase in
because the surface roughness of Lake Baikal has not been warming in the upper atmosphere compared to the low layer
changed much due to less human activities and industrial in BIV, explained over 50 % of the decadal worsening of
construction. The surface wind slowdown from Lake Baikal weather conditions that are directly related to aerosol pollu-
was likely attributed to changes in atmospheric circulation, tion in BIV; this includes the part of weather condition wors-
which can explain 10 to 50 % of the wind decline in the ening caused by the accumulation of aerosol pollution to a
Northern Hemisphere (Vautard et al., 2010). In addition, the certain extent. This worsening is unfavorable for the reduc-
weakening of the East Asian winter monsoon system (Niu tion of PM2.5 mass concentrations in BIV in recent years; it
et al., 2010) was responsible for the wind slowdown. Both even played a counter role, which probably led to an approxi-
changes in mean circulation and decreases in winter mon- mate 4 % increase in PM2.5 mass concentration each year af-
soon system intensity are consequences of climate warming. ter 2010 when the linear trend from 2010 to 2017 was taken
into account. In the future, if the Chinese government aims
to maintain a decline in pollution, more effort is needed to
4 Conclusions offset the adverse effects of climate warming.
Changes in meteorological conditions in winter that are di-
rectly related to aerosol pollution in BIV have worsened Data availability. The underlying research data of this paper can
be accessed by contacting the author.
since the 1960s. Particularly, positive anomalies have oc-
curred since the 1980s, which shows that weather diffu-
sion conditions favoring aerosol pollution in wintertime have
Competing interests. The authors declare that they have no conflict
strikingly worsened since the 1980s. Meanwhile, China’s re-
of interest.
form and opening up began nearly 40 years of rapid eco-
nomic growth, with large amounts of energy consumption
mainly deriving from coal. The decadal worsening of me- Acknowledgements. We are grateful for thoughtful discussion with
teorological conditions in BIV was partly attributed to cli- Yihui Ding. This research is supported by the National Key Project
mate warming and may also partly be related to the impact
www.atmos-chem-phys.net/18/5991/2018/ Atmos. Chem. Phys., 18, 5991–5999, 20185998 X. Zhang et al.: The interdecadal worsening of weather conditions
of MOST (2016YFC0203306), the Atmospheric Pollution Control flow over the Pacific: Interannual and seasonal variations, J. Geo-
of the Prime Minister (DQGG0104), and the Basic Scientific phys. Res.-Atmos., 108, 1445–1459, 2003.
Research Progress of the Chinese Academy of Meteorological Liu, J., Gao, C. Y., Ren, J., Liang, H., Gao, Z., and Wang, L.: Wind
Sciences (2017Z011). resource potential assessment using a long term tower measure-
ment approach: A case study of Beijing in China, J. Clean. Prod.,
Edited by: Jianping Huang https://doi.org/10.1016/j.jclepro.2017.10.347, 2017.
Reviewed by: two anonymous referees Mcvicar, T. R., Roderick, M. L., Donohue, R. J., Li, L. T., Niel, T.
G. V., Thomas, A., Grieser, J., Jhajharia, D., Himri, Y., and Ma-
howald, N. M.: Global review and synthesis of trends in observed
terrestrial near-surface wind speeds: Implications for evapora-
References tion, J. Hydrol., 416, 182–205, 2012.
NBS-China: China Statistical Yearbook, China Statistics Press,
Camalier, L., Cox, W., and Dolwick, P.: The effects of meteorol- 2014.
ogy and their use in assessing ozone trends, Atmos. Environ., 41, Niu, F., Li, Z., Li, C., Kwon-Ho, L., and Wang, M.: Increase of
7127–7137, 2007. wintertime fog in China: Potential impacts of weakening of the
Chen, L., Li, D., and Pryor, S. C.: Wind speed trends over China: Eastern Asian monsoon circulation and increasing aerosol load-
quantifying the magnitude and assessing causality, Int. J. Clima- ing, J. Geophys. Res.-Atmos., 115, 1485–1490, 2010.
tol., 33, 2579–2590, 2013. Ordóñez, C., Mathis, H., Furger, M., Henne, S., Hüglin, C., Stae-
Chen, S. Y., Huang, J. P., Jingxin, L. I., Jia, R., Jiang, N. X., Kang, helin, J., and Prévôt, A. S. H.: Changes of daily surface ozone
L. T., Xiaojun, M. A., and Xie, T. T.: Comparison of dust emis- maxima in Switzerland in all seasons from 1992 to 2002 and dis-
sions, transport, and deposition between the Taklimakan Desert cussion of summer 2003, Atmos. Chem. Phys., 5, 1187–1203,
and Gobi Desert from 2007 to 2011, Science China Earth Sci- https://doi.org/10.5194/acp-5-1187-2005, 2005.
ences, 60, 1–18, 2017. Pang, X., Mu, Y., Lee, X., Zhang, Y., and Xu, Z.: Influences of char-
Dessler, A. E. and Davis, S. M.: Trends in tropospheric humidity acteristic meteorological conditions on atmospheric carbonyls in
from reanalysis systems, J. Geophys. Res.-Atmos., 115, D19127, Beijing, China, Atmos. Res., 93, 913–919, 2009.
https://doi.org/10.1029/2010JD014192, 2013. Shao, Y., Wyrwoll, K. H., Chappell, A., Huang, J., Lin, Z., Mc-
Guo, H., Xu, M., and Hu, Q.: Changes in near-surface wind speed tainsh, G. H., Mikami, M., Tanaka, T. Y., Wang, X., and Yoon,
in China: 1969–2005, Int. J. Climatol., 31, 349–358, 2015. S.: Dust cycle: An emerging core theme in Earth system science,
Guo, S., Hu, M., Zamora, M. L., Peng, J., Shang, D., Zheng, J., Du, Aeolian Res., 2, 181–204, 2011.
Z., Wu, Z., Shao, M., and Zeng, L.: Elucidating severe urban haze Sui, K., Wang, Z., Yang, J., Xie, F.-Y., and Zhao, Y.: Beijing Per-
formation in China, P. Natl. Acad. Sci. USA, 111, 17373–17378, sistent PM10 Pollution and Its Relationship with General Meteo-
2014. rological Features, Research of Environmental Sciences, 20, 77,
Held, I. M. and Soden, B. J.: Robust Responses of the Hydrological https://doi.org/10.13198/j.res.2007.06.80.suikk.009, 2007.
Cycle to Global Warming, J. Climate, 19, 5686–5699, 2006. Sun, Y., Jiang, Q., Wang, Z., Fu, P., Li, J., Yang, T., and Yin, Y.: In-
Huang, J., Wang, T., Wang, W., Li, Z., and Yan, H.: Climate effects vestigation of the sources and evolution processes of severe haze
of dust aerosols over East Asian arid and semiarid regions, J. pollution in Beijing in January 2013, J. Geophys. Res.-Atmos.,
Geophys. Res.-Atmos., 119, 11398–11416, 2014a. 119, 4380–4398, 2014.
Huang, R.-J., Zhang, Y., Bozzetti, C., Ho, K.-F., Cao, J.-J., Han, Y., Vautard, R., Cattiaux, J., Yiou, P., Thépaut, J.-N., and Ciais, P.:
Daellenbach, K. R., Slowik, J. G., Platt, S. M., and Canonaco, Northern Hemisphere atmospheric stilling partly attributed to
F.: High secondary aerosol contribution to particulate pollution an increase in surface roughness, Nat. Geosci., 3, 756–761,
during haze events in China, Nature, 514, 218–222, 2014b. https://doi.org/10.1038/ngeo979, 2010.
Jia, Y., Rahn, K. A., He, K., Wen, T., and Wang, Y.: A novel tech- Wang, H., An, J., Shen, L., Zhu, B., Pan, C., Liu, Z., Liu, X., Duan,
nique for quantifying the regional component of urban aerosol Q., Liu, X., and Wang, Y.: Mechanism for the formation and mi-
solely from its sawtooth cycles, J. Geophys. Res.-Atmos., 113, crophysical characteristics of submicron aerosol during heavy
6089–6098, 2008. haze pollution episode in the Yangtze River Delta, China, Sci.
Leibensperger, E. M., Mickley, L. J., and Jacob, D. J.: Sensitivity Total Environ., 490, 501–508, 2014.
of US air quality to mid-latitude cyclone frequency and impli- Wang, J., Wang, Y., Liu, H., Yang, Y., Zhang, X., Li, Y.,
cations of 1980–2006 climate change, Atmos. Chem. Phys., 8, Zhang, Y., and Deng, G.: Diagnostic identification of
7075–7086, https://doi.org/10.5194/acp-8-7075-2008, 2008. the impact of meteorological conditions on PM2.5 con-
Li, Q., Jacob, D. J., Park, R., Wang, Y., Heald, C. L., Hudman, R., centrations in Beijing, Atmos. Environ., 81, 158–165,
Yantosca, R. M., Martin, R. V., and Evans, M.: North American https://doi.org/10.1016/j.atmosenv.2013.08.033, 2013.
pollution outflow and the trapping of convectively lifted pollution Wang, J. Z., Gong, S. L., Zhang, X. Y., Yang, Y. Q., Hou, Q.,
by upper level anticyclone, J. Geophys. Res.-Atmos., 110, 257– Zhou, C. H., and Wang, Y. Q.: A Parameterized Method for Air-
266, 2005. Quality Diagnosis and Its Applications, Adv. Meteorol., 2012,
Li, X., Zhang, Q., Zhang, Y., Zhang, L., Wang, Y., Zhang, Q., 3181–3190, https://doi.org/10.1155/2012/238589, 2012.
Li, M., Zheng, Y., Geng, G., and Wallington, T. J.: Attribu- Wang, Y. H., Liu, Z. R., Zhang, J. K., Hu, B., Ji, D. S., Yu, Y.
tion of PM2.5 exposure in Beijing-Tianjin-Hebei region to emis- C., and Wang, Y. S.: Aerosol physicochemical properties and
sions:implication to control strategies, Sci. Bull., 957–964, 2017. implications for visibility during an intense haze episode dur-
Liu, H., Jacob, D. J., Isabelle, B., Yantosca, R. M., Duncan, B. N.,
and Sachse, G. W.: Transport pathways for Asian pollution out-
Atmos. Chem. Phys., 18, 5991–5999, 2018 www.atmos-chem-phys.net/18/5991/2018/X. Zhang et al.: The interdecadal worsening of weather conditions 5999 ing winter in Beijing, Atmos. Chem. Phys., 15, 3205–3215, Zhang, X. Y., Wang, J. Z., Wang, Y. Q., Liu, H. L., Sun, J. https://doi.org/10.5194/acp-15-3205-2015, 2015. Y., and Zhang, Y. M.: Changes in chemical components of Wu, P., Ding, Y., and Liu, Y.: Atmospheric circulation and aerosol particles in different haze regions in China from 2006 to dynamic mechanism for persistent haze events in the 2013 and contribution of meteorological factors, Atmos. Chem. Beijing–Tianjin–Hebei region, Adv. Atmos. Sci., 34, 429– Phys., 15, 12935–12952, https://doi.org/10.5194/acp-15-12935- 440, https://doi.org/10.1007/s00376-016-6158-z, 2017. 2015, 2015. Xu, M., Chang, C. P., Fu, C., Qi, Y., Robock, A., Robin- Zhang, Z., Zhang, X., Zhang, Y., Wang, Y., Zhou, H., Shen, son, D., and Zhang, H. M.: Steady decline of east Asian X., Che, H., Sun, J., and Zhang, L.: Characteristics of chem- monsoon winds, 1969–2000: Evidence from direct ground ical composition and role of meteorological factors during measurements of wind speed, J. Geophys. Res., 111, heavy aerosol pollution episodes in northern Beijing area https://doi.org/10.1029/2006JD007337, 2006. in autumn and winter of 2015, Tellus B, 69, 1347484, Zhang, X., Sun, J., Wang, Y., Li, W., Zhang, Q., Wang, W., Quan, https://doi.org/10.1080/16000889.2017.1347484, 2017. J., Cao, G., Wang, J., Yang, Y., and Zhang, Y.: Factors con- Zhong, J., Zhang, X., Wang, Y., Sun, J., Zhang, Y., Wang, J., Tan, tributing to haze and fog in China, Chinese Sci. Bull., 58, 1178, K., Shen, X., Che, H., and Zhang, L.: Relative contributions of https://doi.org/10.1360/972013-150, 2013. boundary-layer meteorological factors to the explosive growth of Zhang, X. Y., Wang, Y. Q., Lin, W. L., Zhang, Y. M., Zhang, X. PM 2.5 during the red-alert heavy pollution episodes in Beijing C., Gong, S., Zhao, P., Yang, Y. Q., Wang, J. Z., and Hou, Q.: in December 2016, J Meteorol. Res., 31, 809–819, 2017. Changes of Atmospheric Composition and Optical Properties Zhong, J., Zhang, X., Dong, Y., Wang, Y., Liu, C., Wang, J., Zhang, Over BEIJING – 2008 Olympic Monitoring Campaign, B. Am. Y., and Che, H.: Feedback effects of boundary-layer meteoro- Meteorol. Soc., 90, 1633–1651, 2009. logical factors on cumulative explosive growth of PM2.5 during Zhang, X. Y., Wang, Y. Q., Niu, T., Zhang, X. C., Gong, S. L., winter heavy pollution episodes in Beijing from 2013 to 2016, Zhang, Y. M., and Sun, J. Y.: Atmospheric aerosol composi- Atmos. Chem. Phys., 18, 247–258, https://doi.org/10.5194/acp- tions in China: spatial/temporal variability, chemical signature, 18-247-2018, 2018. regional haze distribution and comparisons with global aerosols, Atmos. Chem. Phys., 12, 779–799, https://doi.org/10.5194/acp- 12-779-2012, 2012. www.atmos-chem-phys.net/18/5991/2018/ Atmos. Chem. Phys., 18, 5991–5999, 2018
You can also read