The impact of diet upon mitochondrial physiology (Review)
←
→
Page content transcription
If your browser does not render page correctly, please read the page content below
INTERNATIONAL JOURNAL OF MOlecular medicine 50: 135, 2022

          The impact of diet upon mitochondrial physiology (Review)
               IOANNIS D. KYRIAZIS1*, ELENI VASSI1,2*, MARIA ALVANOU1,3*, CHRISTOS ANGELAKIS1,
                   ZOI SKAPERDA1, FOTIOS TEKOS1, VENKATA NAGA SRIKANTH GARIKIPATI4,
                            DEMETRIOS A. SPANDIDOS5 and DEMETRIOS KOURETAS1

     1
      Laboratory of Animal Physiology, Department of Biochemistry and Biotechnology, University of Thessaly, 41500 Larissa;
       2
         Laboratory of Biological Chemistry, Department of Medicine, University of Ioannina, 45110 Ioannina; 3Laboratory of
          Animal Molecular Genetics, Department of Agriculture, University of Western Macedonia, 50100 Kozani, Greece;
       4
         Department of Emergency Medicine, Dorothy M. Davis Heart Lung and Research Institute, The Ohio State University
              Wexner Medical Center, Columbus, OH 43210, USA; 5Laboratory of Clinical Virology, Medical School,
                                           University of Crete, 71003 Heraklion, Greece

                                          Received June 23, 2022; Accepted September 8, 2022

                                                        DOI: 10.3892/ijmm.2022.5191

Abstract. Mitochondria are considered the ‘powerhouses’ of             3.	Clinical impact
cells, generating the essential energy in the form of adenosine        4.	Conclusions
triphosphate that they need for their energy demands.
Nevertheless, their function is easily adaptable as regards the
energy demands and the availability of chemical substrates.            1. Mitochondrial physiology
This allows cells to buffer sudden changes and reassure
cellular metabolism, growth or survival. Currently, humans             Mitochondrial biogenesis. The biogenesis of mitochondria
have different dietary habits, which provide several stimuli           refers to the process through which mitochondria grow
to the cell. According to the energy substrate availability due        in number and/or size. This is mediated by physiological
to the diet quality and diet temporality, mitochondrial physi‑         stimuli, including physical exercise, dietary restrictions
ology is greatly affected. The present review article aimed to         and temperature (1). Mitochondrial biogenesis (Fig. 1) is
collect all the available information that has been published          transcriptionally controlled through the activation of peroxi‑
to date concerning the impact of five different popular diets          some proliferator‑activated receptor‑gamma coactivator 1α
(high‑fat diet, ketogenic diet, fasting, caloric restriction           (PGC‑1α) (2). PGC‑1α has specific tissue distribution and
diet and the Mediterranean diet) on specific mitochondrial             is mainly located in tissues with high energy requirements
physiological aspects, such as function, biogenesis, mitophagy         or high oxidative activity, such as the heart, skeletal muscle,
and mitochondrial fission/fusion.                                      liver and white or brown adipose tissue, suggesting that it is
                                                                       closely related to the energy metabolism of the body (3). The
                                                                       Ppargc1a gene structure contains a well‑conserved binding
Contents                                                               site for a cAMP response element‑binding protein (CREB)
                                                                       that allows activated CREB to bind and promote PGC‑1α
1. Mitochondrial physiology                                            expression (4,5). Furthermore, PGC‑1α can be activated by
2.	Diets                                                               reduced adenosine triphosphate (ATP)/adenosine mono‑
                                                                       phosphate (AMP) levels mediated by AMP‑activated protein
                                                                       kinase (AMPK) that functions as a cellular energy sensor (1).
                                                                       Thus, activated PGC‑1α leads to the consecutive stimulation
                                                                       of several transcription factors, including nuclear respiratory
Correspondence to: Professor Demetrios Kouretas or                     factors (NRFs)1 and 2, that promote the expression of nuclear
Dr Ioannis D. Kyriazis, Laboratory of Animal Physiology,               genes that are responsible for controlling transcriptionally
Department of Biochemistry and Biotechnology, University of            the majority of the subunits of mitochondrial complexes (6,7)
Thessaly, Viopolis, Mezourlo, 41500 Larissa, Greece
                                                                       and peroxisome proliferator‑activated receptors (PPARs) (8).
E‑mail: dkouret@uth.gr
E‑mail: ioankyriazis@uth.gr
                                                                       Furthermore, PGC‑1α can promote oxidative phosphoryla‑
                                                                       tion (OXPHOS) gene expression, which encodes proteins that
*
    Contributed equally                                                constitute the electron transport chain (ETC) and are respon‑
                                                                       sible for ATP synthesis. Last but not least, PGC‑1α cooperates
Key words: mitochondria, physiology, biogenesis, mitophagy,            with PPARα to regulate the expression of mitochondrial
dynamics, ketogenic, high‑fat diet, fasting, caloric restriction       fatty acid oxidation (FAO) enzymes and transport proteins,
                                                                       enabling increases in FAO pathway activity in coordina‑
                                                                       tion with mitochondrial biogenesis (9). The aforementioned
2                                    KYRIAZIS et al: MITOCHONDRIAL FITNESS DURING DIETING

findings indicate that PGC‑1a masters cellular mechanisms             are dysfunctional. Mitochondria divide and stimulate the
related to substrate utilization (fatty acids, glucose) and their     authophagy pathway (mitophagy) (23). Briefly, mitochondrial
intra‑mitochondrial oxidation to produce energy for cellular          fission begins when the endoplasmic reticulum (ER) is recruited
demands (10,11).                                                      and stimulates mtDNA replication. Fission is orchestrated by
    There is an ample amount of available literature on the           the dynamin‑related protein 1 (DRP1), which is a GTPase
molecular pathways that induce mitochondrial biogenesis and           that is recruited in the mitochondrial surface and anchored by
function during conditions of high energy demands, such as            complexes that are constructed from different mitochondrial
exercise. One bout of acute exercise in the muscle is sufficient to   proteins, such as mitochondrial fission 1 (FIS1), mitochondrial
initiate transcriptional signaling toward mitochondrial biogen‑       fission factor and mitochondrial dynamics protein 49 and 51
esis. More elaborately, exercise increases intracellular calcium      (MiD49 and MiD51) (18).
levels, allowing the calcium/calmodulin‑dependent protein
kinase IV‑dependent phosphorylation and the subsequent                Mitophagy. Macroautophagy is a genetically programmed and
activation of CREB (12,13). As previously described, PGC‑1α           conserved catabolic process (24) in which cytosol portions
is induced in the skeletal muscle by AMPK when ATP levels             and/or complete organelles are engulfed by double‑membrane
are low (10,14). In the liver, the hormonal and nutritional regu‑     structures known as autophagosomes, that fuse with lyso‑
lation of hepatic gluconeogenesis occurs mainly through the           somes in order to form single membrane structures known as
modulation of the transcriptional coactivator PGC‑1α. During          autophagolysosomes (25). Mitophagy is the macroautophagy
glucose deprivation, cells sensitize the need for additional          process through which the mitochondria are driven towards
substrates and thus stimulate the gluconeogenesis program             degradation (Fig. 2) (26,27). Mitophagy also constitutes a
and mitochondrial biogenesis through CREB and PGC‑1a in               mitochondrial quality control mechanism, preventing mito‑
order to supply mitochondria with new glucose molecules and           chondrial dysfunction, a hallmark of cellular aging (28).
build more available ‘factories’ in order to generate sufficient      Several autophagy‑related genes (ATGs) regulate autophagy or
amounts of energy. Therefore, gluconeogenesis and mitochon‑           autophagy‑related process, transcriptional control that is evolu‑
drial biogenesis are tightly coupled to allow hepatocytes to          tionary preserved since 30 ATGs have also been described in
adapt in low available glucose levels. Sirtuin (SIRT)1 protein        yeasts (29,30). The recognition of dysfunctional mitochondria
expression is induced in the liver through a nutrient‑signaling       is mediated by the p62 and PARKIN proteins. PARKIN is
response mediated by pyruvate kinase. SIRT1 then activates            an ubiquitin ligase that translocates into the mitochondria
forkhead box protein O1 (FOXO1) (15) and PGC‑1α through               and tags them in order to become processed for degradation.
their deacetylation (16). Subsequently, FOXO1 and PGC1a               Another protein, the mitochondrial receptor NIX, binds the
co‑orchestrate the gluconeogenesis program, enabling                  cytoskeleton related protein, such as like gamma‑aminobu‑
organism energetic stability through glucose utilization (15).        tyric acid type A receptor‑associated protein (GABARAP)
                                                                      and microtubule‑associated protein 1 light chain 3 (LC3,
Mitochondrial dynamics: Fusion‑fission. Cells have distinct           Atg8) (31), driving mitochondria towards apoptosis since it
mechanisms depending on their cycle status or their state to          regulates PARKIN translocation into mitochondria (32). On the
maintain mitochondrial morphology and proper function.                onset of Parkin‑mediated mitophagy, PARKIN interacts with
Mitochondria carry out two processes, fusion and fission              PTEN‑induced kinase 1 (PINK1) in order to finalize dysfunc‑
(Fig. 2), which are of paramount importance for self‑controlling      tional mitochondria labeling (33). Subsequently, ATG9a and
organelle quality (17,18). Mitochondrial fusion occurs when           the ULK1/2 can depolarize mitochondria, a biochemical
nearby mitochondria merge, while mitochondrial fission takes          manifestation that is responsible for the recruitment of addi‑
place when a mitochondrion needs to break apart into two              tional downstream autophagy‑related proteins (ATG) apart
separate organelles. Mitochondrial fusion occurs during the           from LC3. Finally, LC3 recruitment drives mitochondria into
early stages of the S and G1 phases (19), ensuring mainly three       the autophagosome for decomposition (34). Another molecular
main functions: Respiration, ATP production and intramito‑            pathway that stimulates mitophagy includes the transcriptional
chondrial material exchange (20). At the G‑S1 cellular phase,         factor, FoxO3, which regulates autophagy through Bcl‑2 inter‑
mitochondria shape a giant, hyper‑fused network character‑            acting protein 3 (BNIP3) (35). BNIP3 belongs to the BH3‑only
ized by higher ATP production capacity (19). Additionally, it         proteins of the Bcl‑2 family and can induce cellular apoptosis
has been found that fusion contributes to mitochondrial repair        and mitophagy (36). Mitophagy pathways are closely aligned
and elongation while the substrates of the fused mitochondrial        with those of mitochondrial dynamics. As such, mitochondrial
are optimally exploited for respiration. At the structural level,     fission appears to be the first step and a pre‑requisite of the
mitochondrial fusion is accomplished when both the inner              mitophagy process (37).
mitochondrial membrane (IMM) and outer mitochondrial
membrane (OMM) of the fused organelles merge, respec‑                 Mitochondrial function. Mitochondria are mainly consid‑
tively (20), while at a molecular level, three different proteins     ered the cellular ‘powerplants’ with their foremost function
are responsible for the structural fusion: In the OMM, both           to supply cells with energy through producing the energetic
mitofusins 1 and 2 (MFN1 and MFN2), while in the IMM,                 ‘coin’ ATP. Apart from energy metabolism, the mitochon‑
optic atrophy 1 (OPA1) (18).                                          dria contribute to different aspects of cellular biology, such
    In contrast to fusion, the mitochondrial fission process          as signaling, differentiation, cell cycle, growth and cellular
usually occurs during the S, G2 and M phases due to the need          death (38). Thereafter, mitochondrial and cellular metabolism
for the even separation of organelles that will be present in         and are tightly coupled. Mitochondria possess specific meta‑
offspring cells (21,22). Fission is beneficial when mitochondria      bolic lines to process different substrates and generate ATP
INTERNATIONAL JOURNAL OF MOlecular medicine 50: 135, 2022 3
Figure 1. Graphical illustration depicting distinct pathways that induces mitochondrial biogenesis via PGC‑1α activation. The image was created using the
Smart servier medical art website; smart.servier.com. PGC‑1α, peroxisome proliferator‑activated receptor‑gamma coactivator 1α; AMP, adenosine mono‑
phosphate; ATP, adenosine triphosphate; SIRT1, sirtuin 1; AMPK, AMP‑activated protein kinase; CREB, cAMP response element‑binding protein; PPARs,
peroxisome proliferator‑activated receptors; NRF, nuclear respiratory factor; TFAM, mitochondrial transcription factor A; mtDNA, mitochondrial DNA.
Figure 2. Graphical illustration depicting mitochondrial dynamics and mitophagy processes. The image was created using the Smart servier medical art website;
smart.servier.com. mtDNA, mitochondrial DNA; OPA1, optic atrophy 1; MFN, mitofusin; DRP1, dynamin‑related protein 1; PINK1, PTEN‑induced kinase 1.
(Fig. 3). These include pathways that pyruvate (derived from by several isotypes of glucose transporters present in different
glucose or lactate), fatty acids, and amino acids are eventually cell types (39). Glucose levels are elevated in the circulation
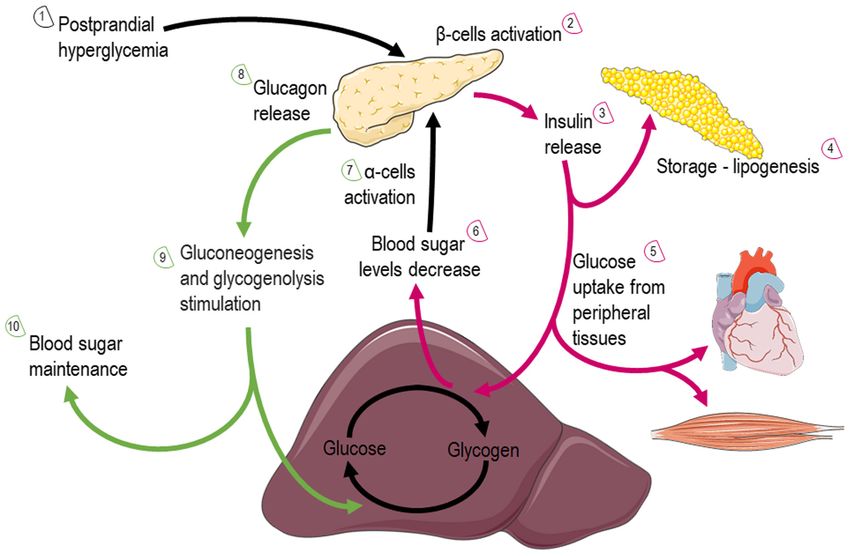
oxidized to gear protons onto NADH and FADH2. NADH and after feeding or through hepatic gluconeogenesis (Fig. 4);
FADH2 carry these electrons to the ETC, forming an electro‑ hepatic release during fasting, allows tissues to uptake glucose
chemical gradient that drives ATP‑synthetase to produce ATP and generate pyruvate through glycolysis, producing an initially
through oxidative phosphorylation. low number of ATP molecules. Subsequently, mitochondria can
Fuel metabolism: i) Glucose: Glucose is almost continu‑ utilize glucose through the form of pyruvate in order to produce
ously cellular available through facilitated diffusion conducted ATP. Depending on nutrient and oxygen availability, glucose is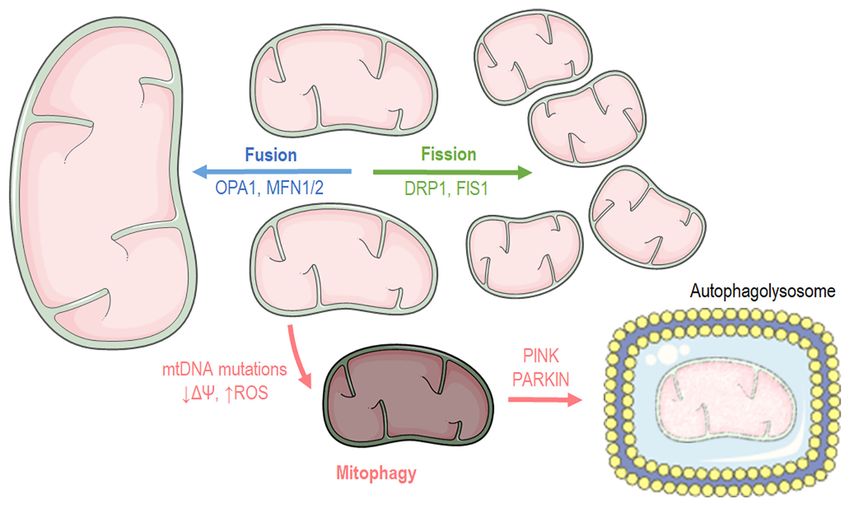
4                                           KYRIAZIS et al: MITOCHONDRIAL FITNESS DURING DIETING

Figure 3. Graphical illustration depicting cellular substrate utilization and pathways related to glucose and fatty acid metabolism in the mitochondria. The
image was created using the Smart servier medical art website; smart.servier.com. GLUTs, glucose transporters; ATP, adenosine triphosphate; TCA, tricar‑
boxylic acid; ETC, electron transport chain.

Figure 4. Graphical illustration depicting glucose utilization after feeding or through hepatic gluconeogenesis via the action of insulin and glucagon. More
elaborately, the illustration is consisted of 10 steps that include two cycles that glucose fate is under insulin (red arrows) or glucagon (green arrows) action. The
image was created using the Smart servier medical art website; smart.servier.com.

converted into pyruvate or lactate through pyruvate and lactate                     membrane via mitochondrial pyruvate carrier (MPC) (40).
dehydrogenase, respectively. Under physiological conditions,                        Oxygen deprivation mitigates oxidative phosphorylation, and
pyruvate is transported across the double‑mitochondrial                             net energy is produced through anaerobic glycolysis and lactate
INTERNATIONAL JOURNAL OF MOlecular medicine 50: 135, 2022                                         5

generation as the end‑product. Lactate can be converted back        popular processed foods, numerous other foods have a high
to pyruvate and glucose in hepatocytes through a different          fat content, including but not limited to animal fat, chocolate,
type of lactate dehydrogenase during oxygen abundancy,              butter and oily fish. Commonly higher in fat content, the
resulting though a net negative balance of ATP (41). Therefore,     majority of processed foods are easier to obtain as they are
the Cori cycle cannot be maintained relentlessly. On the other      normally more economical considering socioeconomical
hand, the inhibition of MPC proteins that block pyruvate shut‑      factors, such as a lower family income. A number of dishes
tling inside the mitochondria, forces the mitochondria into a       among different cultures and ethnicities, such as fried foods
metabolic reprogram and to depend mainly on fatty acids and         or ‘soul food’ contain ingredients with a high fat content,
glutamine. The glutaminolysis pathway allows glutamine to be        such as oils, butters and fats to increase flavor and appeal. A
oxidized in the mitochondria and stimulates the Krebs cycle,        HFD is not a common everyday diet for humans, but rather an
producing a‑ketoglutarate or pyruvate via malic enzymes (42).       experimental protocol with which to create a disease model in
Surprisingly, at high glucose levels, cells lose their ability      animals and mimic the metabolic adaptations that this creates
to utilize the excessive pyruvate that is available, leading to     in cellular physiology (53,54). More factors, such genetic and
cellular glucotoxicity through the activation of polyol pathway,    environmental factors can contribute to obesity, generating a
protein kinase C, increased advanced glycation end‑products,        more perplexed field that warrants further attention.
and hexosamine pathway flux (43). Thereafter, although the               HFD leads to obesity and is responsible for the induction
hypothesis that excessive glucose facilitates higher energy         of insulin resistance, which is one of the most critical patho‑
production, the mitochondria are actually vulnerable in toxic       physiological manifestations (55). This pathophysiology is
intermediates that glucotoxicity is generating, resulting into      emerging since the capacity of non‑adipose tissues for lipid
mitophagy and cellular death (44). This indicate that glucose       storage is met, and additionally, lipids cause lipotoxicity
homeostasis is crucial for the proper functioning of the mito‑      that affects cellular function and cell fate. In white adipose
chondria and cells.                                                 tissue, excessive energy intake causes tissue hypertrophy and
    ii) Fatty acids (FAs): FAs are the main metabolic substrates    the hyperplasia of adipocytes (56). The latter manifestations
for the mitochondria of cardiac and skeletal muscle in order to     stimulate lipolysis in fat cells and ultimately lead to elevated
suffice their energy demands (45). FAs derive from the white        circulating levels of free fatty acids (57). As aforementioned,
adipose tissue in the form of albumin‑bound FAs or via the          an increase in FA oxidation in the mitochondria is responsible
lipoprotein lipase‑dependent degradation of very‑low‑density        for elevating lipid catabolism and energy production, through
lipoprotein (46). FA intracellular uptake is facilitated through    β ‑oxidation and Krebs cycle respectively (58). Adiponectin,
different carriers and proteins, such as fatty acid transporter     leptin, acylation stimulating protein and resistin, which are
protein 1, plasma membrane‑associated fatty acid‑binding            hormones that are secreted by adipocytes play a critical role
protein, and long‑chain fatty acid transporter and fatty acid       in regulating mitochondrial biogenesis and insulin sensi‑
translocase CD36 (FAT/CD36). Subsequently, FAs enter the            tivity (59‑62). During HFD consumption, adiponectin levels
mitochondria or peroxisomes (they process long‑chain fatty          are decreased, leading to the diminished activation of the
acids and branched‑chain fatty acids) through CPT1 and              cellular pathways that usually stimulate. More specifically,
ABCD1 and are catabolized (46) through β‑ and α‑oxidation,          adiponectin physiologically binds to its receptors, AdipoR1
supplying the mitochondria with fuel substrates (47). The           (abundantly expressed in skeletal muscle and AdipoR2,
β‑oxidation rate and the levels of its main product, acetyl‑CoA,    activating AMPK, which finally leads to the stimulation of
dictate the energy cellular demand, since the lack of ATP           glucose uptake and FA oxidation (63). AMPK has also been
to cover increased cellular needs results in the enhanced           implicated in the regulation of PGC‑1α, the master regulator of
tricarboxylic acid (TCA) cycle activity OXPHOS. Similarly,          mitochondrial biogenesis (62). More specifically, AMPK can
NADH and acetyl‑CoA decrease leads to β ‑oxidation flux             directly interact and phosphorylate PGC‑1α, thus increasing
stimulation (48). On the other hand, the level of CPT1 activity     its transcriptional activity (64).
significantly determines the β ‑oxidation rate in cardiac or             Mitochondrial biogenesis during HFD. Impaired
skeletal muscle (49). As aforementioned, the end‑products of        mitochondrial biogenesis is one of the well‑described patho‑
β‑oxidation are acetyl‑CoA, which enters the TCA cycle, and         physiological adaptations that a HFD promotes (Table I).
NADH and FADH2, that are required for the proper flow of            More specifically, in a previous study, insulin‑sensitive male
electrons in the ETC, providing the necessary gradient for          mice that were fed a HFD for 3 days exhibited decreased
F‑ATPase to produce ATP energy molecular coins (50).                PGC‑1a mRNA transcript levels in skeletal muscle (65),
                                                                    indicating a mechanism through which a HFD decreases the
2. Diets                                                            expression levels of genes that are necessary for OXPHOS
                                                                    and mitochondrial biogenesis. The prolonged downregulation
High‑fat diet (HFD). A HFD was the mainstream diet followed         of this molecular reprogramming can lead to mitochondrial
as a dietary habit in the 1980s, even though an introductory        dysfunction that is found in prediabetic conditions and insulin
study that focused on its effects on health was assessed back       resistance, that eventually leads to insulin‑dependent type 2
in 1958 from Ancel Keys and is termed the Seven Countries           diabetes (T2D). In line with the above finding, in another
Study (51), indicating that this dietary habit had already been     study, C57Bl/6 mice treated with HFD for 3 weeks also
incriminated. HFD is referred to a diet in which at least 30‑35%    exhibited reduced PGC1a mRNA and protein levels in skel‑
of the amount of total calories are derived from both unsaturated   etal muscle (65). Furthermore, as previously demonstrated
and saturated fats (52) (https://health.gov/our‑work/food‑nutri‑    6‑week‑old male Sprague‑Dawley rats that were fed a HFD
tion/previous‑dietary‑guidelines/1980). In addition to the          for 28 weeks (60 kcal% fat) exhibited a reduced mtDNA copy
6 KYRIAZIS et al: MITOCHONDRIAL FITNESS DURING DIETING
Table I. Summary table indicating the mitochondrial manifestations and the molecular targets that are affected by the high‑fat diet.
High‑fat diet
Phenotype Tissue (host) Molecular target (Refs.)
Biogenesis Skeletal muscle ↧ PPARGC1a mRNA and protein levels (63)
C57BL/6J mice
Biogenesis Cardiac muscle ↧ mtDNA copy number (64)
Sprague‑Dawley rats
Biogenesis Cardiac muscle ↧ PGC‑1a mRNA and protein levels (65)
Wistar rats
Biogenesis Skeletal muscle ↥ PGC‑1α and TFAM protein levels (60)
Wistar rats
Biogenesis Skeletal muscle ↥ PGC‑1α protein (66)
C57BL/6J mice and Wistar rats
Biogenesis Skeletal muscle ↥ PGC‑1α protein (67)
Wistar rats ↥ PPRAGC1a mRNA levels
Function C57Bl/6 mice ↧ OXPHOS‑related mRNA transcripts (63)
↧ cytochrome c protein levels
Function Cardiomyocytes ↧ mitochondrial respiration (58)
Sprague‑Dawley rats ↧ citrate synthase activities
↧ ATP
↥ AMP/ATP ratio
Function Skeletal muscle ↥ protein expression of all subunits from the (66)
C57BL/6 mice respiratory chain
Function Skeletal muscle ↥ COX1, COX4, UCP3 and Cyt b protein levels (67)
Wistar rats
Function Myocardium ↧ mRNA expression levels of the OXPHOS genes (65)
Wistar rats ↧ protein expression of NDUFB5
Dynamics Myocardium ↥ FIS1 protein (64)
Sprague‑Dawley rats
Dynamics Diaphragm ↧ MFN2 protein (70)
C57BL/6 mice ↥ DRP1protein
Dynamics Skeletal muscle ‑ MFN2 protein (71)
Sprague‑Dawley rats ↥ DRP1 and FIS1proteins
Dynamics Skeletal muscle ‑ MFN1 protein (72)
C57BL/6 mice ↧ MFN2 and OPA1 protein
Mitophagy Skeletal muscle ‑ PINK1 (73)
non‑obese sedentary male subjects
and endurance‑trained male runners
Mitophagy Cardiomyocytes ↥ acidity (mitochondria come into contact with (74)
Tg‑Mito‑Keima transgenic mice the acidic milieu of lysosomes during mitophagy)
Mitophagy Cardiac muscle ↧ PARKIN protein (75)
C57BL/6 mice ‑ PARKIN mRNA
Upward arrows indicate an increase, and downward arrows indicate a decrease. mtDNA, mitochondrial DNA; GC‑1α, peroxisome prolif‑
erator‑activated receptor‑gamma coactivator 1α; TFAM, mitochondrial transcription factor A; OXPHOS, oxidative phosphorylation; AMP,
adenosine monophosphate; ATP, adenosine triphosphate; COX, cytochrome c oxidase; FIS1, mitochondrial fission 1; MFN, mitofusin; DRP1,
dynamin‑related protein 1; OPA1, optic atrophy 1; PINK1, PTEN‑induced kinase 1.
number, suggesting impaired mitochondrial biogenesis in the ejection fraction and heart failure with preserved ejection frac‑
myocardium (66). A reduction in mitochondrial abundance tion) and both can cause mortality if they remain undiagnosed
and mitochondrial dysfunction can eventually lead to both and untreated. Following that, another study revealed that the
systolic or diastolic heart failure (heart failure with reduced gene expression levels of PPARGC1α were diminished in theINTERNATIONAL JOURNAL OF MOlecular medicine 50: 135, 2022 7
cardiac tissue of 6‑week‑old Wistar rats fed a HFD (45 kcal% efficiency. Additionally, HFD administration for 4 weeks
fat) for 10 weeks (67). Another study also linked mitochon‑ in male Wistar rats has been shown to increase the levels
drial abnormal function with diastolic dysfunction. However, of proteins involved in the OXPHOS, such as cytochrome c
male and female 2‑month‑old Wistar rats that were fed a oxidase (COX)I, COXIV, uncoupling protein (UCP) 3 and
HFD for 26 weeks had increased PGC‑1α and mitochondrial cytochrome b (69). In another study, the mRNA expression
transcription factor A (TFAM) protein levels in the gastroc‑ levels of the OXPHOS genes were shown to be significantly
nemius muscle (62). The same study suggested that the effects decreased in the myocardium of 6‑week‑old Wistar rats. In
of a HFD on mitochondrial biogenesis may be sex‑dependent, addition, the protein expression of NDUFB5 (complex I), one
since male rats exhibited a greater increase in PGC‑1α and of the OXPHOS subunits in the mitochondria, was found to
TFAM levels compared to females (62). Similar findings were be lower in the HFD group (67). Even though some studies,
demonstrated in a study in which 8‑week‑old male C57BL/6 as aforementioned, have demonstrated an increase in the
mice and male Wistar rats exhibited increased PGC‑1α protein OXPHOS complex, possibly as a compensatory mechanism in
levels in skeletal muscle following 5 or 20 weeks of being order to allow mitochondria to produce more energy, the HFD
fed a HFD (68). Furthermore, another study suggested that appears to impair mitochondrial function, affecting cellular
augmented lipid availability and decreased muscle mitochon‑ energetics and ATP turnover.
drial fatty acid oxidative capacity due to the HFD could not Mitochondrial dynamics during the HFD. Mitochondrial
generate insulin resistance and elevated intramuscular lipid fusion and fission are cellular processes that numerous studies
abundance. Nonetheless, for a shorter period if time under have tried to shed light under the HFD (Table I). As previously
a HFD (4 weeks), PGC‑1α protein levels have been found to noted, Chen et al (66) examined the impact of the HFD on the
increase with no concomitant elevation in PPARGC1a mRNA mitochondria of rat cardiomyocytes. Male Sprague‑Dawley
levels in the skeletal muscle of male Wistar rats. This is rats fed a HFD (60% kcal) exhibited elevated levels of mito‑
related to the activation of PPARδ, due to increased free fatty chondrial FIS1 (66). In another study, 4‑week‑old healthy male
acids that mediate a post‑transcriptional increase in PGC‑1α C57BL/6 mice fed a HFD for 16 weeks exhibited a reduced
levels (69). These findings argue with the hypothesis that an relative expression of mitochondrial fusion protein 2 (MFN2),
impaired mitochondrial content is responsible for the develop‑ while the expression of mitochondrial DRP1 was detected
ment of insulin resistance. at higher levels (72). Another previous study demonstrated
Mitochondrial function during HFD. As aforementioned, that in 8‑week‑old male Sprague‑Dawley rats fed a HFD for
a prolonged period on a HFD affects the substrate availability 6 weeks, changes in the expression levels of a protein related
that mitochondria can utilize, and thus, mitochondria need to to mitochondrial fusion and fission were observed. More
adapt their molecular machinery to generate ATP efficiently specifically, elevated levels of DRP1 and FIS1 were assessed
in sufficient amounts, particularly in high‑energy consuming in the HFD‑treated group, while MFN2 levels remained
tissues, such as the brain and myocardium. Numerous studies unaltered (73). That study suggested that the HFD and
have tried to shed light on the effects of a HFD for different low‑intensity endurance training modulated mitochondrial
durations upon mitochondrial function in various tissues dynamics, contributing to insulin sensitivity, whereas they
(Table I). Even though differentiated levels of substrates enter failed to generate an additive effect on mitochondrial biogen‑
the cellular environment due to insulin resistance, master esis. In line with the above, no change in the MFN1 protein
regulators of mitochondrial‑substrate utilization are highly levels were detected in male C57BL/6 mice (4‑week‑old) fed
affected. More specifically, FOXO1 and PPARa transcription‑ a HFD (74). However, MFN2 and OPA1 protein levels were
ally control glucose and fatty acid utilization (61,70). Recently, assessed at a lower level in the HFD‑fed mice (74). These find‑
KLF5, another transcriptional factor, completes a triangle ings suggest that moderate aerobic training can only mitigate
that these transcriptional factors form, in order to orches‑ insulin resistance and mitochondrial dysfunction that are
trate substrate utilization and mitochondrial function during induced by obesity.
diabetic cardiomyopathy (71). Moreover, C57Bl/6 mice fed a Mitophagy during HFD. The protein content of total
HFD have been shown to have OXPHOS‑related mRNA tran‑ PINK1 in skeletal muscle has been detected at similar levels
scripts followed by decreased cytochrome c protein levels (65), between groups before and after a high‑fat meal in healthy
indicating that not only reduced mitochondrial abundance, as non‑obese, sedentary males and 10 endurance‑trained male
aforementioned, but also the decreased expression of genes runners (75), suggesting that mitophagy is not necessary
related to mitochondrial function can result in diastolic for metabolic flexibility in the healthy population. Studies
and/or systolic dysfunction in insulin‑resistant pathophysi‑ concerning the effects of the HFD on mitophagy markers
ological states. Similarly, a reduced mitochondrial respiration, have also been conducted in transgenic mice that exclusively
complex I‑III and citrate synthase activities have been detected express Mito‑Keima in cardiomyocytes. Mito‑Keima Red is
in HFD‑fed (60% kcal) rats (66), constituting important find‑ a fluorescent oligopeptide of which the excitation shifts to
ings that justify an impaired cardiac function. The previous higher wavelength when mitochondria are placed in an acidic
findings are also supported by ATP depletion, followed by an environment, such as lysosomes during mitophagy. Wild‑type
increase in the AMP/ATP ratio, that has been observed in the and transgenic Tg‑Mito‑Keima mice fed a HFD (60 kcal% fat)
mitochondria of cardiomyocytes (66). By contrast, a study in for 2 months, have been shown to exhibit mitophagy (elevated
which 8‑week‑old male C57BL/6 mice were fed a HFD (45% LC3II levels), followed by lower mitochondrial abundance
kcal) for 5 or 20 weeks, demonstrated elevated levels for all (mtDNA/nuDNA) (76). Additionally, ATG7 appears to play
subunits from the respiratory chain in the skeletal muscle (68), critical role in mitophagy stimulation under a HFD since
most probably as a compensatory mechanism of impaired ATG7‑KO mice have been shown to exhibit an alleviated8 KYRIAZIS et al: MITOCHONDRIAL FITNESS DURING DIETING
phenotype after the respective treatment protocol (76). The have also been found to be elevated (90). Moreover, the SIRT3
aforementioned study suggests that mitophagy in cardiomyo‑ (mainly expressed in the mitochondria) protein levels have
cytes is a quality control process during HFD consumption, been found to be increased in the skeletal muscle of C57BL/6
and its activation can serve as a therapeutic target against male mice after 12 months on the CR diet (91). SIRT3 activa‑
HFD‑induced diabetic cardiomyopathy. In another study, tion is able to stimulate PGC1a through the CREB or AMPK
impaired mitophagy activity was observed in the myocardium signaling pathway (91), inducing the mitochondrial biogenesis
of C57BL/6 mice fed a HFD for 24 weeks, which was driven molecular program. Of note, the CR diet in F344BNF1 male
through a reduction of PARKIN in the mitochondria that rats has been shown to result in the complete prevention of
were supposed to be recruited by PINK1. Moreover, the HFD the age‑related reduced levels of PGC‑1α in the liver (92).
failed to alter Parkin mRNA levels, suggesting that possible Thereafter CR can be used as a therapeutic approach to alle‑
independent transcriptional mechanism(s) are involved (77). viate age‑dependent mitochondrial confinement. In agreement
with this finding, PGC‑1α activation has also been found in the
Caloric restriction (CR). CR that has been studied since the liver of 12‑24‑month‑old male Fischer 344 rats that have been
beginning of the 20th century (78), is a nutritional approach on a CR diet for 25 months (93). Finally, the effects of CR on
that reduces calorie consumption without leading to malnu‑ mitochondrial biogenesis have also been assessed in humans.
trition. Additionally, it is worth mentioning that during CR, In healthy and overweight participants on the CR diet for
adequate levels of vitamins and minerals should be maintained. 6 months, the expression levels of SIRT1 and PPARGC1A in
CR typically involves a chronic reduction (20‑30%) in energy skeletal muscle were found to be elevated in non‑obese young
intake from the standard calorie intake (79,80). In accordance participants (94). The same study found that the expression of
with the current scientific literature, the term CR is often used the PGC‑1a target TFAM was increased, a protein that is a key
interchangeably with dietary restriction (DR). However, CR activator of mitochondrial transcription and genome replica‑
is a partial example of DR as DR protocols include CR (81). tion which is also used as a determinant for mitochondrial
CR has been shown to improve health and extend longevity in abundance (94).
several studies in organisms with varying levels of complexity, Mitochondrial function during caloric restriction. The
ranging from yeast to humans (79,80,82‑85). In contrast to activation of AMPK and SIRTs followed by the concomi‑
starvation, the CR diet is able to lower glucose levels and tant inhibition of mTOR downstream pathways are crucial
increase ketone bodies levels in the plasma within normal molecular events that the CR diet is able to promote in order
physiological ranges (86). for cells to fine‑tune oxidative metabolism, as well as the
Mitochondrial biogenesis during caloric restriction. mitochondrial biogenesis and turnover (Table II). It is well
Several studies have shed light on the effects of CR on mito‑ established that AMPK and PGC‑1α are key molecules that
chondrial biogenesis (Table II). Initially, CR has been studied orchestrate these pathways (95). CR is also known to lower
in vitro or ex vivo to examine the effects on the molecular reactive oxygen species (ROS) production through enhanced
level and the distinctive pathways that are affected. Studies mitochondrial aerobic metabolism and to increase the activity
performed in both skeletal muscle C2C12 cell line or murine of antioxidant enzymes in the cardiovascular system and
primary skeletal myoblasts treated under CR conditions have the skeletal muscle (96,97). In the gastrocnemius derived
shown that the NAD+/NADH ratio is increased, leading to from 10‑month‑old B6C3F1 female mice fed a CR diet (40%
subsequent SIRT1 activation (87). That study highlights that restriction), the activities of complexes I, III, and IV were
AMPK, NAMPT and SIRT1 are necessary molecules of a found to be diminished (98). In line with the that study,
functional pathway that permits cells from skeletal muscle 8‑ to 10‑month‑old rats fed a CR diet for 4.5‑6.5 months
origin to sense and react to substrate deprivation and avail‑ exhibited lower complex IV activity in the mitochondria in
ability. It is known that an increased SIRT1 activity triggered both skeletal and cardiac muscle (99). That study suggested
by elevated NAD + levels can increase the transcriptional that even though the CR diet can attenuate the decline in
activity of PGC‑1α (87) and FOXO1 (88), stimulating multiple mitochondrial function that is related to cellular aging, this
pathways that need to be activated due to energy depletion beneficial effect is insignificant compared with the impact that
and refer mainly to proliferative and metabolic processes. In the CR diet has upon mitochondrial biogenesis. In line with
a previous study, following PGC‑1a and FOXO1 activation, that previous study, in another study, the CR diet (40% restric‑
both NRF1 and NRF2βγ transcript levels were found to be tion) for 3 months in male and female 5‑month‑old Wistar
increased after CR for 24 h in HeLa cells (89). However, the rats was shown to result in a decrease at the activities of both
same study revealed that CR treatment did not induce PPARα complexes I and III (100). This adaptation to the CR diet can
levels (89). Therefore, the mitochondria can adapt their bioen‑ justify the lower mitochondrial‑derived superoxide formation
ergetics under CR conditions and at the same time are able to and the effect that the CR diet has upon age‑related disorders.
stimulate mechanisms to reduce oxidative damage. Moreover, The above has been also confirmed by the higher complex IV
primary hepatocytes from 12‑month‑old male Fischer 344 rats efficiency in response to long‑term CR administration that has
that have received CR (40% restriction) have exhibited elevated been described in the skeletal muscle of F344BN rats due to an
expression levels of PGC‑1α and PPARα (89). In line with the increase in high‑affinity binding sites of complex IV (101). In
above, in vivo studies have revealed that the CR (30% restric‑ another study, the CR (30% restriction) diet in male C57BL/6
tion) diet in male C57BL/6 mice for 1, 9 and 18 months have mice for 1, 9 and 18 months did not result in any effect on
increased PGC‑1a protein levels in the skeletal muscle (90). citrate synthase activity (90). By contrast, the mRNA levels of
Following that, the mRNA of several mitochondrial‑relevant several mitochondrial‑associated proteins (Ppargc‑1α, NRF1,
proteins, such as NRF1, Core 1, COXIV, Atps and COX content, Core 1, COXIV and Atps) and the COX content were increasedINTERNATIONAL JOURNAL OF MOlecular medicine 50: 135, 2022 9
Table II. Summary table indicating the mitochondrial manifestations and the molecular targets that are affected during the caloric
restriction diet.
Caloric restriction
Phenotype Tissue (host) Molecular target (Refs.)
Biogenesis HeLa cells ↥ mRNA NRF1 and NRF2 (87)
‑ PPARα protein
Biogenesis Primary hepatocytes ↥ PGC‑1α and PPARα proteins (87)
Fischer 344 rats
Biogenesis/function Skeletal muscle ↥ PGC‑1a protein (88)
C57BL/6 mice ↥ mRNA Nrf1, Core 1, Cox IV cytochrome c oxidase
Biogenesis/function Skeletal muscle ↥ SIRT3 protein (89)
C57BL/6 mice
Biogenesis Liver Prevents the age‑related reduced levels of PGC‑1α (90)
F344BNF1 rats
Biogenesis Liver ↧ PGC‑1a protein (91)
Fischer‑344 rats
Biogenesis/function Skeletal muscle human ↥ mRNA SIRT1 and PPARGC1A (92)
Function Skeletal muscle ↧ Complex I, III, and IV activity (96)
B6C3F1 mice
Function Skeletal and cardiac muscle ↧ Complex IV activity (99)
F344BN rats
Function Cardiac muscle ↧ Complex I and III activity (98)
Wistar rats
Function Skeletal muscle ↥ High‑affinity binding sites of complex IV (99)
F344BN rats
Function Skeletal muscle ‑ Citrate synthase activity (88)
C57BL/6 mice ↥ mRNA levels of several mitochondrial associated
proteins (PPARGC‑1α, NRF1, Core 1, COXIV, Atps)
and cytochrome c oxidase content
Function Skeletal muscle ↥ mRNA transcripts associated with mitochondrial ATP (100)
Sprague‑Dawley rats production (subunits of cytochrome‑c oxidase; COXI,
II, III, IV, Va and VIII, and NADH dehydrogenase
Function Skeletal and cardiac muscles ‑ ATP content (101)
Fischer 344 rats
Function Adipocytes overweight ↧ Expression of genes encoding ATP synthase subunits, (102)
healthy men and women cytochrome c oxidase, NADH dehydrogenase
Function Skeletal muscle ↥ Citrate synthase activity (103)
obese men and women
Function Skeletal muscle of overweight ‑ Activity of beta‑hydroxyacyl‑CoA dehydrogenase, (92)
male and female subjects citrate synthase, and cytochrome c oxidase II
Function Skeletal muscle of non‑obese ‑ Activity of citrate synthase, beta‑hydroxyacyl‑CoA (92)
male and female subjects dehydrogenase, and cytochrome c oxidase II
Dynamics Liver and skeletal muscle ↥ MFN2 levels in liver (108)
C57BL/6J mice ↥ MFN1 and NRF1 levels in the skeletal muscle
Dynamics Skeletal muscle ↥ MFN2 and OPA1 protein levels (105)
Male C57BL/6 mice ↥ DRP1 protein levels
Dynamics Soleus and gastrocnemius ↥ MFN2 protein levels (109)
male Sprague‑Dawley rats ↥ DRP1 protein levels
Dynamics Gastrocnemius ↥ OPA1 and MFN1 proteins levels (112)
male Sprague‑Dawley rats
Dynamics Hepatocytes No marked effects on the expression levels (110)
male C57BL/6 mice (DRP1, MFN1, MFN2 and OPA1)
Dynamics Hepatocytes ↥ FIS1 and DRP1 proteins levels (111)
male C57BL/6 mice no change in MFN1, MFN2, and OPA1 protein levels10 KYRIAZIS et al: MITOCHONDRIAL FITNESS DURING DIETING
Table II. Continued.
Caloric restriction
Phenotype Tissue (host) Molecular target (Refs.)
Mitophagy Skeletal muscle ↥ PINK1 and PARKIN protein (105)
C57BL/6 mice
Mitophagy Kidney ↥ LC3/ATG8 and BNIP3 protein (106)
Fischer 344 rats ↧ PINK1 protein
Mitophagy Primary hepatocytes C57BL/6 ↧ Mitochondrial membrane potential (107)
and GFP‑LC3 transgenic
male mice
Upward arrows indicate an increase, and downward arrows indicate a decrease. NRF, nuclear respiratory factor; PPAR, peroxisome prolifer‑
ator‑activated receptor; COX, cytochrome c oxidase; PGC‑1α, peroxisome proliferator‑activated receptor‑gamma coactivator 1α; SIRT1, sirtuin 1;
ATP, adenosine triphosphate; OPA1, optic atrophy 1; MFN, mitofusin; DRP1, dynamin‑related protein 1; PINK1, PTEN‑induced kinase 1.
in skeletal muscle (90). Following that, another study revealed was markedly decreased in the kidneys of male 3‑month‑old
that male Sprague‑Dawley rats that fed the CR diet for Fischer 344 rats after 20 months of CR treatment (108).
36 weeks exhibited an increase in the expression levels of genes Moreover, nutrient deprivation induces mitophagy in primary
associated with mitochondrial ATP production (six subunits of hepatocytes from wild‑type and GFP‑LC3 transgenic male
COX; COXI, II, III, IV, Va, VIII and NADH dehydrogenase) mice (109). The aforementioned findings suggest that the CR
in skeletal muscle (102). The CR‑related increase that has been diet stimulates the mitophagy program in cells in a possible
reported, particularly in genes that encode proteins related to attempt to discard energy consuming and not fully functional
oxidative stress scavenging, may contribute to the impact of mitochondria.
CR on cellular longevity. On the other hand, different levels of Mitochondrial dynamics during CR. As it is expected, a
CR diets in male Fischer 344 rats throughout their life (10% lack of energy intake is able to affect mitochondrial dynamics,
restriction; at 3.5 months, 25% restriction; at 3.75 months, 40% inducing the fusion phenotype in mitochondria (Table II). A
restriction; at 4 months until mortality) failed to enhance or previous in vivo study using male C57BL/6 mice fed a CR
alleviate the age‑related decrease in the ATP content of the diet (40% restriction) for 6 months revealed increased levels of
mitochondria isolated from gastrocnemius muscle (103). The MFN2 and OPA1 in skeletal muscle (107). A similar finding
effect of the CR diet on mitochondrial function has also been has also found in mice fed a CR diet (40% restriction) with
assessed in humans. Firstly, overweight healthy males and less calories, that expressed increased levels of MFN1 and
females on the CR diet (25% restriction) for 6 months exhib‑ NRF1 (110). Additionally, the prolonged duration of CR was
ited a downregulation in the levels of essential genes encoding found to have no effect on mitochondrial fusion, proposing
subunits of ATP synthase, COX and NADH dehydrogenase in that initial energy deprivation led to a rather early control of
adipocytes (104). By contrast, in aged obese males and females mitochondrial fusion (107). On the contrary, 18 months of CR
(60‑75 years old) that followed a CR diet, an increase in citrate has been shown to result in higher expression levels of DRP1,
synthase was observed in skeletal muscle (105). Another study which as aforementioned, is able to stimulate mitochondrial
revealed that healthy male and female overweight participants fission. Thereafter, distinct molecular signatures are required
on a CR diet (25% restriction) for 6 months, did not exhibit to orchestrate and control mitochondrial fission and fusion
an altered activity of β ‑hydroxyacyl‑CoA dehydrogenase, dynamics in mice fed a CR diet that also depend on the duration
citrate synthase and COXII (94). Finally, CR in overweight of the diet per se (107). The CR diet is also able to further induce
non‑obese participants did not lead to changes in the levels mitochondrial fusion in the skeletal muscle of aged mice (in
of citrate synthase, β ‑hydroxyacyl‑CoA dehydrogenase and which mitochondrial fusion has already been induced) (111).
COXII levels (94). These results indicate that the CR has a On the contrary, the CR diet can partially inhibit the induc‑
broad effect on the transcriptome in different tissues, although tion of mitochondrial dynamics in the glycolytic muscles of
it does not improve mitochondrial function in overweight and aged mice (111). This discrepancy suggests that the anti‑aging
obese participants. effects of the CR diet in mitochondrial dynamics may be
Mitophagy during caloric restriction. The CR is one of the restricted to highly oxidative muscular fibers. The effects
most potent non‑genetic triggers for initiating the mitophagy of the CR diet have also been studied in the liver. C57BL/6
process (106) (Table II). Specifically, the highest values of mice that fed a CR diet (40% restriction) have been shown to
PINK1 and Parkin have been detected in the skeletal muscle exhibit no change in mitochondrial fusion related proteins in
of male 10‑week‑old C57BL/6 mice fed the CR diet for hepatocytes (112,113). On the contrary, the study showcased an
18 months (107). In line with that previous study, in another elevation at DRP1 levels in mitochondria‑enriched fractions
study, the expression of the autophagosome formation marker, of hepatocytes (113), indicating that a similar CR diet is able
LC3/Atg8, and BNIP3 was increased, while that of PINK1 to affect mitochondrial dynamics differently between tissues.INTERNATIONAL JOURNAL OF MOlecular medicine 50: 135, 2022 11
Another study revealed that the CR diet was not able to change (e.g., glutathione) and detoxification enzymes (120). Moreover,
the mitochondrial abundance in hepatocytes, but stimulated the KD has been found to increase cytosolic and mitochon‑
MFN2 levels (110). drial protein acetylation and alter protein succinylation
The effects of the CR diet have been also studied in combi‑ patterns (121). More specifically, male mice fed the KD have
nation with exercise. As previously demonstrated, initially, the been shown to exhibit increased mitochondrial FA oxidation
CR diet was able to decrease the impact of resistance training in the liver, while a reduction of markers of hepatic de novo
in muscle hypertrophy since rats that received both the CR lipogenesis has been detected in comparison to mice that fed a
diet and resistance training exhibited elevated fusion‑related high fat/high sucrose ‘western’ diet (WD) (126). Furthermore,
proteins levels (OPA1 and MFN1), while no effect was exerted another study revealed that the KD for 4 months increased
on fission‑regulatory proteins (FIS1 and DRP1) (114). That mitochondrial activity in younger animals (127). On the
study suggests that CR promotes mitochondrial adaptation in contrary, the prolonged duration (14 months) of the KD was
the skeletal muscle, since it attenuates the effect of resistance found to be required to increase mitochondrial mass and
training upon muscle hypertrophy. Finally, another study function in elder animals in comparison with mice fed the
demonstrated that both CR and exercise training in obese rats isocaloric diet (127). It was suggested that the improvement of
was able to alleviate reduced mitochondrial fusion stimulated mitochondrial function due to the KD may contribute to the
by HFD, since they induced MFN2 expression and reduced the improved longevity; hence, no direct link has been determined
phosphorylation of DPR1 protein at Ser616 (115). In this case, between enhanced mitochondrial function with muscle mass,
the CR diet appears to act synergistically with exercise against strength, and muscular aging. In line with this previous study,
the HFD‑induced mitochondrial fusion. increased mitochondrial mass was also observed in the study by
Parry et al (128). More specifically, increased citrate synthase
Ketogenic diet (KD). The KD was first applied to a patient with activity that corroborates with a higher mitochondria volume
epilepsy back in the 1920s (116). The KD is a diet consisting of was found in the liver and gastrocnemius of rats fed the KD
low carbohydrates, a high‑fat content, and moderate amounts compared to rats fed standard chow. Additionally, the KD‑fed
of protein. Different types of the KD type have been introduced rats had a higher median lifespan (128). In another study,
in the scientific literature, including i) the classic DK (CKD); rats fed the KD and exposed to resistance exercise training,
ii) the less restrictive ‘modified Atkins diet’ (mAD); and iii) the exhibited more efficient coupling of complex II substrates in
‘medium‑chain triglyceride’ KD (MCT‑KD) (117). The CKD the skeletal muscle mitochondria compared with the control
refers to the diet in which every 4 g of fat accounts for 1 g of group that underwent the same exercise regime but received
protein plus carbohydrates, reducing the carbohydrates (118). the isocaloric western diet (125). Those authors suggested
mAD has a different composition since every 1 g of fat corre‑ that their insights may reflect unknown biochemical connec‑
sponds to 1 g of protein plus carbohydrates (119). The ratio tions between axes involving ketone bodies or medium‑chain
of MCT‑KD is similar to that of CKD, although the ketone triglycerides that modulate mitochondrial function (122).
bodies are generated efficiently as the AMPA receptors are Another study revealed that in the skeletal muscles of aged
directly inhibited by the medium‑chain triglycerides that are male C57BL/6 mice, an increase in the levels of markers
used in MCT‑KD. Consequently, cellular energetics are shifted of mitochondrial content (citrate synthase, complex I and
towards mitochondrial biogenesis (120). complex IV activity) was observed following long‑term expo‑
Generally, the KD can alter the organism's metabolic state sure to a KD (14 months) (129). On the contrary, in another
and shift its reliance from carbohydrates to FAs. This adaptation study, the long duration of the KD in 4‑month‑old male rats
also leads to an increase in FA oxidation, gluconeogenesis and was shown to result in lower gastrocnemius maximal citrate
ketogenesis, with produced ketone bodies entering the blood synthase activity and caused damage to the respiratory control
circulation (121). Acetoacetate, β‑hydroxybutyrate (β‑ΗΒ) and in the gastrocnemius myotubes, while it did not alter mito‑
acetone are the major forms of ketone bodies generated during chondial abundance and quality in the brain and liver (130).
the KD (117). Furthermore, the KD can stimulate numerous Similarly, a decrease has been documented in cytochrome c
pathways, upregulating proteins that participate in biochem‑ and complex IV levels in the hepatocytes of C57Bl/6 male
ical systems related to cellular bioenergetics, such as the TCA mice that fed the KD (124). The aforementioned results
cycle (citrate synthase, malate dehydrogenase), the OXPHOS suggest that the short‑term use of the KD can promote mito‑
system (CI, CII, CIII, CIV, CV and cytochrome c) and to FA chondrial biogenesis and/or alter mitochondrial physiology
oxidation [carnitine palmitoyl‑transferase, medium‑chain in specific tissues, with skeletal muscle being susceptible to
acyl‑CoA dehydrogenase (MCAD), long‑chain acyl‑CoA KD‑induced alterations (127). Due to contradictory findings,
dehydrogenase, very‑long‑chain acyl‑CoA dehydrogenase, further investigations are required in the future to shed more
β ‑hyd roxyacyl‑ CoA dehyd rogenase] a nd ketolysis light and delineate the net impact of KD on mitochondrial
(β‑hydroxybutyrate dehydrogenase) (122). mass and function.
Mitochondrial function during the ketogenic diet. It is known that the KD is able to shift cellular energy
Generally, the KD has been reported to stimulate pathways production reliance towards FA oxidation and not towards
that induce mitochondrial abundance, enhance mitochondrial glycolysis. This is a consequence of the elevated levels of
performance and regulate antioxidant mechanisms (123‑126) ketone bodies basically in the liver. Xu et al (131) reported
(Table III). Low‑level redox signaling molecules, such elec‑ the detrimental effect that is caused due to extensive KD or
trophiles and H2O2 can stimulate adaptive pathways such as frequent deep fasting. The main manifestations reported
the protective transcription factor, NF E2‑related factor 2 and were fibrotic lesions in the myocardium of the rats (131). This
as a result, lead to the increased production of antioxidants was followed by a reduction in mitochondrial biogenesis and12 KYRIAZIS et al: MITOCHONDRIAL FITNESS DURING DIETING
Table III. Summary table indicating the mitochondrial manifestations and the molecular targets that are affected during the
ketogenic diet.
Ketogenic diet
Phenotype Tissue (host) Molecular target (Refs).
Biogenesis/function Cardiac muscle Sprague‑Dawley rats ↥ Mitochondrial number (137)
Interscapular brown adipose tissue ↥ Electron transport chain proteins
(IBAT) C57BL/6 mice ↥ UCP1 protein
↥ AMPK, PPAR‑γ, PGC‑1α proteins
Biogenesis Liver Wistar rats ↥ mRNA PPARGC1α and TFAM (139)
Biogenesis Skeletal muscle, liver, brain from ‑ PGC‑1α protein levels (124,126)
Fisher Rats and mice
Biogenesis/dynamics Skeletal muscle C57BL/6 mice ↥ PGC‑1α protein (141)
↥ Mitochondrial fission/fusion related genes
Function Liver ↥ Mitochondrial fatty acid oxidation (124)
male C57BL/6 mice ↧ de novo lipogenesis
Function Skeletal muscle C57BL/6 mice ↥ Mitochondrial activity (TFAM, SIRT1, (125)
SIRT3, PGC‑1a) in younger animals
↥ Mitochondrial mass (level of OXPHOS) and
function (citrate synthase activity) in elder
animals
Function Liver and skeletal muscle Fisher rats ↥ Citrate synthase activity (126)
↥ Mitochondrial volume
Function Skeletal muscle Sprague‑Dawley rats ↥ Efficiency of coupling of complex II (123)
substrates (respiratory control ratio of
isolated mitochondria)
Function Liver C57Bl/6 mice ↧ Hepatic cytochrome c and complex IV levels (122)
Function Skeletal muscle ↧ citrate synthase activity (128)
Fisher rats
Function/dynamics Cardiac muscle type‑2 diabetic ↧ Mitochondrial fission (134)
db/db mice (mitochondrial number, size)
↥ PI3K, p‑Akt, Akt, mitochondrial respiratory
control ratio, ATP content
Function Myocardium tissue of male ↧ HDAC2 leading to the transcriptional (129)
Sprague‑Dawley rats activation of SIRT7
Function Cybrid cell lines from a patient with ↥ Mitochondrial volume (130)
Kearns‑Sayre syndrome (KSS)
Function Brain and muscle tissue BTBR mice ↥ Mitochondrial morphological deformations (131)
Function Skeletal muscle from healthy human ↥ Mitochondrial respiratory control ratio (132)
subjects (mitochondrial O2 consumption and membrane
potential index)
↥ ATP production
↥ ATP/H2O2 ratio
Function Skeletal muscle Fisher rats ↧ H2O2 emission (133)
↥ Mitochondrial respiration
↥↥ Cell viability
Function Skeletal muscle Twinkledupl ↧ Amount of cytochrome c oxidase negative (136)
transgenic mice muscle fibers
Function Liver ↥ mRNA expression PPARGC1α (140)
male C57BL/6 mice
Dynamics Liver ↧ Mitochondrial amount (decrease mtDNA) (143)
C57Bl/6 and BTBR mice ↥ BNIP3 mRNA and protein
Dynamics Skeletal muscle ↥ Markers mitochondrial content (citrate (127)
C57BL/6 mice synthase, Complex I, and Complex IV activity)INTERNATIONAL JOURNAL OF MOlecular medicine 50: 135, 2022 13
Table III. Continued.
Ketogenic diet
Phenotype Tissue (host) Molecular target (Refs).
Dynamics Cardiomyocytes of rabbits with ↧ Mitofusin 2 (MFN2) and dynamin‑related (144)
heart failure protein 1 (DRP1)
Dynamics SH‑SY‑5Y cells ↧ Dynamin‑related protein1 (DRP1) (145)
Mitophagy Hepatocytes of male and female ↧ Markers of de novo lipogenesis (FAS, ACC) (139)
Wistar rats
Mitophagy Liver ↥ BNIP3 protein (143)
C57BL/6 and BTBR mice
Upward arrows indicate an increase, and downward arrows indicate a decrease. UCP1, uncoupling protein 1; AMPK, AMP‑activated protein
kinase; PGC‑1α, peroxisome proliferator‑activated receptor‑gamma coactivator 1α; TFAM, mitochondrial transcription factor A; mtDNA,
mitochondrial DNA; SIRT1, sirtuin 1; DRP1, dynamin‑related protein 1.
cellular respiration, while cardiomyocyte apoptosis was found are exposed to a KD, their viability is extended after weaning,
to be stimulated. At the molecular level, their study added that which is attributed to differences in genes involved in oxida‑
during the increase in ketone body β‑HB levels, the acetyla‑ tive phosphorylation and mitochondrial integrity (137). Thus,
tion of the histone Sirt7 promoter was maintained due to lethal mitochondrial cardiomyopathy caused by a mutation in
HDAC2 inhibition. The aforementioned molecular cascade Med30 can be partially reversed through dietary control (137).
was able to lead to the transcriptional activation of Sirt7 (131) In a different pathophysiological in vivo model, the KD was
that inhibited the expression of genes related to mitochondrial shown to reduce the progression rate in a disease mouse
ribosome‑encoding and mitochondrial biogenesis, promoting model (transgenic mouse line) of late‑onset mitochondrial
cardiomyocyte apoptosis and myocardial fibrosis (131). In a myopathy (138). More specifically, the KD diminished the
previous study, β ‑ΗΒ supplementation in cybrid cell lines amount of COX‑negative muscle fibers, which is a hallmark
that contain a 1.9 kb partial deletion of mtDNA (the ‘FLP’ of mitochondrial respiratory chain deficiencies. However, the
deletion) derived from a patient with Kearns‑Sayre syndrome mtDNA quality or quantity remained unaffected after the KD,
(KSS) was found to increase mitochondria volume (132), while the study highlighted that mitochondrial biogenesis was
while β‑ΗΒ treatment improved mitochondrial morphological stimulated followed by liver lipid restoration (138). The afore‑
imperfections in brain and muscle tissue at BTBR mice (133), mentioned data suggest that minor mitochondrial dysfunction
which present hallmarks of idiopathic autism. The authors of can influence skeletal muscle energy metabolism by drifting
that study also reported that β‑ΗΒ supplementation increased towards anaerobic glycolysis. Furthermore, if lipids can enter
the diminished mitochondrial size that was induced in BTBR mitochondria, then the cells reprogram and use FAs as energy
mice, signifying that larger fused mitochondria exhibit a substrates, boosting β‑oxidation. In another study, 8‑week‑old
higher ATP production and lower ROS levels. male C57BL/6J mice fed D‑ β ‑hydroxybutyrate‑(R)‑1,3
Miller et al (134) investigated the changes in the mitochon‑ butanediol monoester [ketone ester (KE)], replacing the
dria of skeletal muscle in healthy individuals who followed carbohydrate diet content for 1 month, exhibited a higher
the KD combined with exercise training, focusing on peri‑ number of mitochondria and an increase in ETC proteins
odized resistance training, power training and high‑intensity levels, UCP1 and mitochondrial biogenesis‑regulating proteins
interval training. They observed that the KD increased the in the interscapular brown adipose tissue (139). An increase in
mitochondrial respiratory control ratio (mitochondrial O2 mitochondrial UCP expression and activity was also observed
consumption and membrane potential index), ATP production by Sullivan et al (140) in juvenile mice that received a high‑fat
and the ATP/H2O2 ratio (134). The latter depicts an increase in KD (HF‑KD). In addition, ROS levels after the HF‑KD were
the efficiency of energy production compared with the oxida‑ found to be decreased, and this suggested a potent neuroprotec‑
tive burst. In another study, β‑HB treatment in 5‑month‑old tion activity of the KD (140). UCP activation is able to remove
male Fisher rats resulted an improvement of mitochondrial protons from mitochondrial protein, decreasing the flow of
respiration followed by less H 2O2 generated by the mito‑ ETC. Therefore, UCP activation can indirectly diminish
chondria, without affecting mitochondrial abundancy (135). ROS mitochondrial production, serving as an additional axis
A previous study conducted on mice that had manifestations through which the KD can function in order to promote its
of T2D and fed the KD revealed that the KD was able to beneficial effect.
reduce the mitochondrial respiratory control ratio and the Mitochondrial biogenesis and mitophagy during the
ATP content (136). Notably, it has been demonstrated that KD. Male C57BL/6J mice and rats fed the KD have been
homozygous mice with a missense mutation in Med30 that shown to have elevated PGC‑1a and TFAM levels (141,142)
exhibit cardiomyopathy die soon after weaning, while they in comparison with respective animals fed a standard chow
are healthy at the lactation stage (137). When weaning mice diet. On the contrary, other studies have failed to documentYou can also read