The impact of a single surfing paddling cycle on fatigue and energy cost
←
→
Page content transcription
If your browser does not render page correctly, please read the page content below
www.nature.com/scientificreports
OPEN The impact of a single surfing
paddling cycle on fatigue
and energy cost
1,2,3,4 1,2,3* 1,2
Márcio Borgonovo‑Santos , Rodrigo Zacca , Ricardo J. Fernandes &
João Paulo Vilas‑Boas 1,2
Surfing is one additional sport proposed by the Tokyo 2020 Organizing Committee. Surprisingly,
substantial efforts to understand surfing energetics are recent, and the impact of a single surfing
paddling cycle on fatigue and energy cost is still not clear. Since surfing paddling technique is highly
specific, experiments in real practice conditions are necessary to provide deeper insights. Through a
biophysical approach, biomechanical and energetics responses of surfing paddling were quantified
and compared from 16 competitive male surfers (23.5 ± 10.0 years old, 65.3 ± 11.4 kg and 1.72 ± 0.01 m)
during two sets (PRE and POST) of 10 s all-out tethered paddling plus 20 m sprint paddling, interposed
by 6 min of endurance paddling. Faster surfers presented lower energy cost during sprint PRE
(r2 = 0.30, p = 0.03) and endurance (r2 = 0.35, p = 0.02) relative surfing paddling velocities. Although
the energy cost was higher for a lower velocity at maximal paddling velocity POST, the energy cost
of surfing paddling increased with absolute velocity according to a power function (R2 = 0.83). Our
results suggest that fatigue seems to occur even following a single surfing paddling cycle. Developing
a powerful and endurable metabolic base while reducing energy cost during surfing paddling should be
seen as key factors in surfing training programs.
Since the unanimous approval of the International Olympic Committee in 2016, surfing is one additional sport
proposed by the Tokyo 2020 Organizing Committee (www.olympic.org/the-ioc). For the first time 20 female
and 20 male surfers will compete in Chiba, Japan, as part of the Olympic competition. Seen as a youthful and
vibrant sport, surfing is characterized by intermittent bouts of varying durations and intensities, followed by
considerable recovery p eriods1. The Hawaiian Duke Kahanamoku, a three-time gold medalist in swimming,
widely considered the father of modern surfing, first argued for the sport to be included in the Olympic program
in the beginning of the twentieth century (www.tokyo2020.org). Currently, there are millions of active surfers
worldwide1. Typically, the duration of a surf session ranges from 20 min to 4–5 h in competition and training
conditions, respectively1,2, with surfers performing, almost cyclically, endurance and sprint paddling, popping-
up and maneuvering on the face of the w ave3–5.
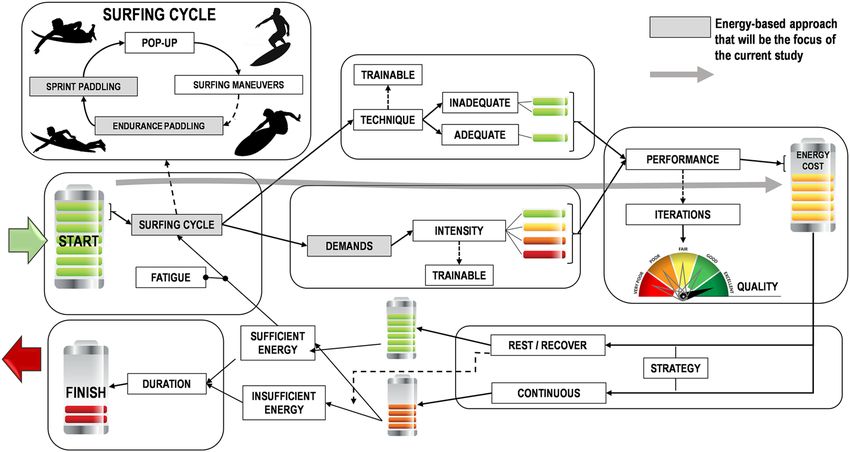
Energetics and technique are relevant performance related factors in surfing3–5. Figure 1 illustrates a con-
ceptual model of the main activities during a typical surf session and corresponding energetics. Be exercising or
resting during the surf session is a surfer decision to manage fatigue, technique and p erformance6–8.
7,8
It is well reported that fatigue impairs muscle performance . Thus, depending on the surfing paddling
cycle (sprint paddling interposed by endurance paddling) frequency, muscle metabolic homeostasis can be
impaired1,9,10. During a surf session, surfers expend ~ 50% paddling, ~ 3% wave riding, ~ 7% with miscellaneous
(e.g. recovering the surfboard) and ~ 40% recovering. This proportion of tasks is relatively consistent during
competition11–13, training9 or even in recreational p
ractice14. The surfing paddling can be divided in paddling to
return to the line-up, sprint paddling to the wave and general paddling, with a mean duration of ~ 64, 7 and 15 s
and a percentage of ~ 21, 4 and 18%, respectively9.
Substantial efforts to better understand surfing energetics are recent4,10,15, with the sprint and endurance
paddling integrated assessment (combining physiology and biomechanics) being very scarce. This gap is even
more evident regarding ecologic-related studies, i.e., conducted in-water16. Since surfing paddling technique is
highly specific, out-of-water simulations using land ergometers seems to be far from the real effort17, reason why
experiments in real practice conditions would provide deeper insights about surfers’ energetic profile. Likewise,
1
Centre of Research, Education, Innovation and Intervention in Sport (CIFI2D), Faculty of Sport, University of Porto,
Porto, Portugal. 2Porto Biomechanics Laboratory (LABIOMEP‑UP), University of Porto, Porto, Portugal. 3CAPES
Foundation, Ministry of Education of Brazil, Brasília, Brazil. 4Surfing Viana High Performance Centre – Surf Club
Viana, Viana do Castelo, Portugal. *email: rzacca@fade.up.pt
Scientific Reports | (2021) 11:4566 | https://doi.org/10.1038/s41598-021-83900-y 1
Vol.:(0123456789)www.nature.com/scientificreports/
Figure 1. Conceptual model of a surf session energetic profile. Solid grey line indicates an energy-based
approach that will be the focus of the current study.
a biophysical assessment in surfing could better guide researchers and coaches to improve planning strategies
and training methods.
The energetics of swimming has been extensively s tudied18–20, providing relevant insights to be applied in
surfing related s tudies4. In fact, the velocity in swimming is given by the ratio between net metabolic power (Ė)
and the energy cost to cover a distance unit, with the Aerobic (Aer), anaerobic lactic (AnL) and anaerobic alactic
(AnAL) energy contributions depending on the exercise duration and i ntensity5,18. Therefore, in surfing paddling,
as in swimming, any influence on hydrodynamic resistance and/or propelling efficiency will lead to changes
on energy c ost5,18,20,21. The current study aimed to understand the impact of a single surfing paddling cycle on
fatigue and energy cost. We hypothesized that there seems to be fatigue even in the first surfing paddling cycle.
Results
No differences were observed for mean tethered paddling force between PRE and POST (0.12 ± 0.01 vs.
0.12 ± 0.01 N kg−1) (Fig. 2A). However, a small decrease was observed for mean POST maximal paddling veloc-
ity (1.52 ± 0.28 vs. 1.46 ± 0.28 m s−1; mean diff: 0.06; 95% IC: 0.005–0.11; p = 0.033; Cohen´s d: 0.59) (Fig. 2B).
44% of surfers reached their highest velocity in the time interval of [4–6[s at PRE, while at POST 44% of surf-
ers reached higher values on the interval of [6–8[s. Direct relationships between mean tethered paddling force
(N kg−1) and maximal paddling velocity were not significant when checked separately (PRE: r2 = 0.19, p = 0.08;
POST: r2 = 0.14, p = 0.15).
Average distance paddled during 360 s (1.15 ± 0.11 m·s−1) was 414 ± 41 m. The HR ranged from 142 ± 23 to
167 ± 17 bpm (74 ± 12 to 88 ± 9% HRmax) in the first and the last minute (respectively). The V̇O2 kinetics response
to endurance paddling was best fitted by a bi-exponential model (p < 0.05). Estimated V̇O2 related parameters
obtained during 6 min paddling at 60% of maximal velocity can be observed in the Fig. 3.
The [La−] kinetics during the entire protocol and post-hoc analysis from tethered paddling PRE and from
maximal paddling velocity PRE are presented in Fig. 4. The Table 1 shows the E tot, Ė and energy cost throughout
the protocol. Regarding the small decrease in POST maximal paddling velocity, moderate increase were observed
for Etot (mean diff: − 8.1 kJ; 95% IC: − 13.4 to 2.8; p = 0.005; Cohen´s d: − 0.81), Ė (mean diff: − 0.51 kW; 95%
IC: − 0.86 to − 0.16; p = 0.008; Cohen´s d: − 0.77) and energy cost (mean diff: − 0.40 kJ m -1; 95% IC: − 0.67 to
− 0.14; p = 0.005; Cohen´s d: − 0.81).
Direct relationships between body mass and energy cost were observed at sprint (PRE: r2 = 0.70, p < 0.001;
POST: r2 = 0.71, p < 0.001) and endurance paddling (r2 = 0.40, p < 0.008). However, the direct relationship between
body mass and velocity was not significant in any test.
Figure 5A,B present the economy profile (energy cost) at two different relative intensities: maximal paddling
velocity (PRE and POST) (panel A) and endurance paddling for all surfers (panel B). The energy cost decreased
with maximal paddling velocity PRE ( r2 = 0.30, p = 0.03) and endurance paddling ( r2 = 0.35, p = 0.02), but not
in maximal paddling velocity POST (r2 = 0.16, p = 0.12). Thus, faster surfers presented lower energy cost dur-
ing sprint (PRE) and endurance velocities. Figure 5 panel C, presents the energy cost versus absolute velocity
relationship for the surfers from the present study. Although the energy cost was higher for a lower velocity at
maximal paddling velocity POST, the energy cost of surfing paddling increased with velocity according to a
power function, being described by the following equation:
y = 0.0661e2.1198x ; R2 = 0.8314 (1)
Scientific Reports | (2021) 11:4566 | https://doi.org/10.1038/s41598-021-83900-y 2
Vol:.(1234567890)www.nature.com/scientificreports/
Figure 2. Tethered-paddling force–time performance (A) and sprint paddling velocity (B) for PRE and POST
endurance-paddling. *Non-ordinal force reduction (p < 0.01).
Figure 3. Estimated V̇O2 related parameters (mean ± SD and coefficient of variation) obtained during 6 min
paddling at 60% of maximal velocity. A
0 is the V̇O2 before the endurance test; Afc and Asc_end, TDfc and T
Dsc are
respectively amplitudes and corresponding time delays of the fast and slow V̇O2 components. The CV (%) and
95%CI are the mean coefficient of variation and 95% confidence interval for each mean parameter estimate,
respectively.
Scientific Reports | (2021) 11:4566 | https://doi.org/10.1038/s41598-021-83900-y 3
Vol.:(0123456789)www.nature.com/scientificreports/
Figure 4. [La−] kinetics during the entire protocol. *Difference from tethered-paddling PRE (p < 0.05); #
Difference from maximal paddling velocity PRE (p < 0.05).
Tethered paddling PRE Maximum paddling velocity Maximum paddling velocity Tethered paddling POST
(10 s) PRE (20 m) Endurance paddling (360 s) POST (20 m) (10 s)
Aer energy (kJ) – – 247.6 ± 52.7 – –
AnL energy (kJ) 8.8 ± 6.4 16.3 ± 9.9 25.5 ± 13.5 24.0 ± 14.0 27.5 ± 12.4
AnAL energy (kJ) 9.5 ± 1.7 11.8 ± 2.6 27.4 ± 4.8 12.2 ± 2.7 9.5 ± 1.7
Etot (kJ) 18.3 ± 7.9 28.1 ± 12.2 300.5 ± 60.5 36.2 ± 16.2 36.9 ± 13.8
Ė (kW) – 2.09 ± 0.79 0.83 ± 0.16 2.60 ± 1.06 –
C (kJ m−1) – 1.40 ± 0.61 0.73 ± 0.17 1.81 ± 0.81 –
Table 1. Energy expenditure throughout the protocol, simulating one surfing cycle. Aer aerobic, AnL
anaerobic lactic, AnAL anaerobic alactic, Etot total energy expenditure, Ė : metabolic power, C energy cost, - not
estimated.
Discussion
We performed a surfing biophysical analysis to understand the biomechanics and energetics of sprint and endur-
ance paddling during a single surfing paddling cycle. We characterized the biomechanics and energetics of a surf-
ing paddling cycle, comparing sprint paddling performances interposed by endurance paddling in competitive
male surfers. The protocols were conducted respecting an ecological approach for surfing paddling, simulating
real efforts in-water. Small impairment was observed for mean maximal paddling velocity POST, despite simi-
lar values for mean tethered paddling force. Relationships between mean tethered paddling force (N kg−1) and
maximal paddling velocity were not significant. The V̇O2 kinetics in response to endurance paddling was best
fitted by a bi-exponential model and mean [La−] increased during the surfing paddling cycle. Moderate increase
were observed for Etot, Ė and energy cost. Faster surfers presented lower energy cost during sprint (PRE) and
endurance relative velocities. Although the energy cost was higher for a lower velocity at maximal paddling
velocity POST, the energy cost of surfing paddling increased with velocity according to a power function. It was
evident that there seems to be accumulated f atigue6–8 even in a single typical surfing paddling cycle, supporting
our hypothesis and improving the knowledge on biomechanics and energetics during a surf session.
Tethered swimming is considered a valid procedure for swimmer’s propulsive force assessment and reliable to
estimate swimming p erformance22. However, the relationships between mean tethered paddling force (N kg−1)
and maximal paddling velocity, checked separately in our study (both in PRE and POST moments), were not
significant. In fact, although tethered paddling does not evaluate the hydrodynamic drag that the surfer and
surfboard system must overcome, it allows assessing the surfer’s capacity to produce force. A similar protocol in
swimming (10 s maximal tethered bouts) found a peak force of 207.1 ± 27.2 N and mean force of 133.2 ± 16.8 N23.
Smaller absolute force values (Fig. 2, panel A) were observed (peak force of 163.9.1 ± 44.5 N and mean force of
76.7 ± 18.7 N). These differences were expected, firstly due to surfers’ age and anthropometrics heterogeneity.
Scientific Reports | (2021) 11:4566 | https://doi.org/10.1038/s41598-021-83900-y 4
Vol:.(1234567890)www.nature.com/scientificreports/
Figure 5. Energy cost at two different relative intensities, maximal paddling velocity (PRE and POST; A) and
endurance paddling (B), and energy cost versus absolute velocity relationship (C) for all surfers.
Secondly, the surfboard buoyancy makes only part of the arms to be immersed in the water during the propul-
sion phase, thus reducing the water contact area, a mechanical determinant to produce propulsion force in water
locomotion24.
The effect of wind, water surface and currents, which affect the surfers’ performance, can be controlled in a
swimming pool environment25. Besides, surfing evaluation protocols in swimming pool environments are more
respectful (ecological) when comparing the characteristics of movements performed by surfers into the ocean
with land ergometers26. Pool-based protocols have already been applied in junior practitioners and professional
surfers (peak velocities ranging from 1.10 m s−1 to 2.00 m s−1)9,10,15,27–30. Our results are in agreement with the
available literature (Fig. 2, panel B). However, we also tested the effect of endurance paddling (and recovery
intervals) on the performance of sprint paddling (POST). Impaired mean and peak velocity suggest that repeated
Scientific Reports | (2021) 11:4566 | https://doi.org/10.1038/s41598-021-83900-y 5
Vol.:(0123456789)www.nature.com/scientificreports/
cycles may drop sprint paddling performance. This information may help to improve coaches’ strategies and
training programs.
To date, evaluating the surfing endurance paddling energetic profile (and also sprint paddling) in real environ-
ment (sea) and with direct measurements was not possible. Besides, the portability of available equipment limits
the area of data collection, thus creating some movement constraints for surfers. This is why studies are typically
conducted with tethered surfboard p addling31, adapted ergometers on land12,13,15,29,30,32 and, recently, using a
swim flume . However, tests performed on land ergometers may underestimate efforts from water l ocomotion33.
16
Studies evaluating surf sessions in ecological conditions are scarce. Mean velocities of ~ 52 m∙min−1 were
reported by Secomb et al.9, resulting in ~ 312 m during six minutes (counting recovery time dilution). The
endurance-paddling test in our study was fixed in six minutes effort, with quite higher distances (414 ± 41 m;
1.15 ± 0.11 m s−1). In our study, surfers reached ~ 74% HRmax after the first minute effort and ~ 88% HRmax after
6 min effort, with mean and maximal HR values being comparable with other studies9,14.
This is first study detailing the V̇O2 kinetics in surfing paddling. The lower velocity observed at POST indicates
that fatigue can occur even during a single surfing paddling cycle. Indeed, a bi-exponential model best modelled
the V̇O2 kinetics in response to endurance paddling, i.e., a loss of muscle metabolic homeostasis may have been
observed, impairing muscle power production. Thus, the recruitment of extra motor units leads to a higher
energy cost, which will develop a slow component in the V̇O2 kinetics6–8. Endurance paddling was performed
at 60% of the peak velocity previously obtained, with lower values than those from Furness et al.15 who analyzed
competitive and recreational surfers. Other studies27,28 showed ~ 37 ml kg−1·min−1 as the lower V̇O2 peak value
during maximal surfing paddling.
Maximal surfing paddling velocity is as greater the higher the Ė and the lower the energy cost of the s urfer5,21.
The Ė results from energy sources, and energy cost relies on hydrodynamic resistance, overall efficiency and
propelling efficiency5,21. Thus, factors influencing energy cost (e.g. velocity, paddling rate/length, body mass,
training) affects drag, propelling efficiency or b oth5,18,21,34. In the present study, maximal paddling velocity POST
was lower than PRE, but Ė and energy cost increased. The relationships between energy cost and velocities close
to those obtained during actual competitions have been studied for swimming and boat locomotion5,21, opening
the window to explore it, for the first time, in surfing paddling.
Both in swimming and boat locomotion, there is a direct relationship between energy cost and hydrodynamic
resistance, and an inverse relationship between propelling efficiency and overall e fficiency5,21. In our study the
energy cost was analyzed at both relative and absolute velocities. Regarding relative velocities, lower energy cost
was associated with higher velocities in male surfers at both maximal paddling velocity and endurance pad-
dling (Fig. 5 panel A and B). Although energy cost was higher for a lower absolute velocity at maximal paddling
velocity POST (Fig. 5 panel C), the energy cost of surfing paddling increased with velocity according to a power
function5,21,35. The relationship between body mass and velocity was not significant, but the direct relationships
between body mass and energy cost were strong. Thus, the lower energy cost observed for faster surfers is, at
least in part, due to the smaller hydrodynamic resistance (form, friction and wave drag), i.e., a lower wetted area
of the surfer and his board and a more horizontal position in water5,21. Besides, the distance covered per stroke
cycle (in swimming) or paddling cycle (in surfing and boats) is related to the efficiency of locomotion, i.e. the
higher the distance covered, the higher the propelling and overall efficiencies35. In fact, energy cost in boats is
lower when comparing to swimming, due to a lower hydrodynamic resistance and higher propelling e fficiency5.
The increase in Ė with velocity is associated with the increase in total mechanical power output from muscles to
sustain that velocity, which means that powerful and endurable metabolic base cannot be overlooked in surfing
paddling training p rograms36. Despite that, improvements in velocity can easily be reached by reducing energy
cost rather than by increasing Ė (from aerobic or anaerobic pathways) by the same a mount5,21,37. For that purpose,
technique training and hydrodynamics of the surfboard are mandatory issues.
The sequence of experiments from our study was created to simulate, in part (sprint and endurance paddling),
the real conditions of a surf session. Differences in [ La−] were observed between surfing paddling sprint and
endurance paddling. Together, the results from our study confirm the initial hypothesis, i.e. fatigue can occur
after the first cycle of sprint and endurance paddling, which could affect subsequent surfing cycles, even with the
available rest intervals. Our work examined surfers’ performance in a swimming pool, performing the paddling
action at different intensities, which is somewhat different from paddling in the ocean. For instance, salt water
generates greater buoyancy forces relative to fresh water, and these differences may contribute to differences in
the total energy expenditure. In addition, the tethered force test (stationary paddling) allowed us to measure
the upper limbs paddling propulsion. However, limitations in equipment have not allowed us to test it in the
ocean. On the other hand, the analyses from our study were performed under highly controlled and repeatable
conditions, which are very difficult to achieve in the ocean. Besides, the paddling motions analyzed in this study
are biomechanically and energetically very similar, apparently, to those performed in open water.
In conclusion, our findings suggest that there seems to be fatigue even in a single typical surfing paddling
cycle. Although faster surfers seem to be more economical at both maximal paddling velocity and endurance
paddling, the energy cost of surfing paddling increased with velocity according to a power function. Together,
these findings offer an original assessment of bioenergetics during sprint and endurance paddling, respecting
the ecology of surfing. The endurance test between sprint paddling, simulating a surfing paddling cycle, brought
new insights into the V̇O2 kinetics of surfers during the paddling action, best fitted by a bi-exponential behavior
with fast and slow components. Finally, the entire protocol showed an estimation of the energy pathways, Etot,
Ė and energy cost during a single surf paddling cycle, contributing to better understand the biomechanical and
energetic requirements in surfing. The chance of fatigue installation already in the first surfing paddling cycle
provide valuable knowledge, which can be applied in surfing for training, testing and competitions. From a
strategy point of view, coaches can estimate Etot, Ė and energy cost to better allocate recoveries, surfing paddling
intensities and technique, whether in a recreation, training or competition.
Scientific Reports | (2021) 11:4566 | https://doi.org/10.1038/s41598-021-83900-y 6
Vol:.(1234567890)www.nature.com/scientificreports/
Figure 6. Design of the study in which surfers were tested trough specific functional protocols of sprint (PRE
and POST) and endurance paddling actions, thus simulating a surfing paddling cycle. [ La−]: blood lactate
sample assessment.
Methods
A single-group prospective study was conducted, in which surfers were tested trough specific functional proto-
cols, simulating the combination of sprint and endurance paddling actions during one surfing cycle. The experi-
mental protocol took place in a 25 m indoor pool with 27 and 26ºC of water and air temperatures (respectively)
and 65% relative humidity. Surfers used their own surfboards, minimizing eventual constraints and simulating
their personal surfing environment. After a warm-up (with self-stretching exercises, 3 min moderate inten-
sity continuous paddling, 2 × 15 m maximal intensity paddling and 10 min of recovery)30, surfers performed
a sequence of functional paddling tests (Fig. 6) consisted by sprint (PRE and POST) and endurance paddling
protocols (with 3 min of rest intervals in-between tests). The proposed warm-up, typically carried out in experi-
ments with surfers30, tries to maintain the ecology of what normally takes place prior to a surf session, since most
of the warm-up is performed out of the water.
Participants. Sixteen competitive male surfers (age: 23.5 ± 10.0 years, body mass: 65.3 ± 11.4 kg, height:
1.72 ± 0.01 m, arm span: 1.75 ± 11.4 m and 9.1 ± 8.9 years of previous experience) volunteered to participate. The
inclusion criteria were two years of surfing experience, two training sessions per week of regular practice and
the absence of any serious musculoskeletal injury in the last six months. Surfers and respective parents (when
subjects were under 18 years old) were informed about the benefits and risks of taking part in experiments.
After receiving all information about the data collection protocols so that they could participate in the study, all
participants gave their duly signed informed consent forms. This study was approved by the ethics committee of
the Faculty of Sport, University of Porto—Porto—Portugal (CEFADE 27.2014) and the procedures were carried
out in accordance of Declaration of Helsinki.
Procedures. The anthropometric profile (body mass, height and arm span) was obtained by an Interna-
tional Society for the Advancement of Kinanthropometry accredited level I anthropometrist. For assessing the
maximal paddling propulsive force, a belt (attached on the lumbar-sacral area) was connected to a 5 m length
non-elastic steel cable. The cable was coupled to a load cell (5000 N, Globus, Codogne, Italy; 100 Hz frequency)
fixed on the w all22 connected to an analogic/digital data acquisition system (Biopac MP150 and software Acq-
Knowledge 4 (BIOPAC Systems, Inc., Goleta, CA, USA). A digital low-pass filter smoothed data with 10 Hz
cut-off frequency to remove noise and movement artefacts was used. Surfers adopted a horizontal position on
the surfboard with the cable fully extended (Fig. 7, panel A), with data collection starting when the first paddle
cycle was completed, avoiding the cable extension inertial effect22. Since the sprint paddling duration is ~ 7 s9,
each participant performed the all-out tethered surfing paddling test during 10 s29,30.
Then, to assess maximal paddling velocity, subjects performed a 20 m all-out paddling test, starting in a prone
position on the surfboard without contact with the wall (Fig. 7, panel D). Velocity was recorded using a custom-
made cable-based speedometer device fixed at the wall, 0.3 m above the water surface38, using a bobbin with a
non-elastic line fixed at the lumbar region. Continuous velocity data was obtained at a 50 Hz frequency, exported
to the software AcqKnowledge 4 (BIOPAC Systems, Inc., Goleta, CA, USA) and filtered with a 15 Hz cut-off
digital filter (FIR—Window Blackman − 61 dB). The cut-off value was selected using Fast Fourier Transform
analysis to minimize artefact noise, with peak and mean velocities obtained by individual velocity–time curves
every two seconds. The second trial (POST) of both the above-referred tests was performed after the endurance
paddling test using the same methodological procedures.
Paddling bouts can last from few to ~ 90 s during a 2 h training session9 and the endurance paddling mean
velocity ranges from 64 to 70% of maximal velocity27,28,39. Thus, each surfer paddled 6 min in the endurance
paddling test, at 60% of the peak velocity previously obtained. For that purpose, two cones were placed on the
edge of the pool (20 m away from each other) as a reference for surfers inverting their direction and to guarantee
they performed at constant velocity (using acoustic pacing).
Respiratory and pulmonary gas exchange data were measured breath-by-breath using a telemetric portable
gas analyzer (K4b2, Cosmed, Rome, Italy) connected to a respiratory snorkel and valve system (AquaTrainer,
Cosmed, Rome, Italy)40—Fig. 7, panel C. The K 4b2 was calibrated prior to each testing session with gases of
known concentration (16% O2 and 5% CO2) and the turbine volume transducer was calibrated using a 3 L syringe
Scientific Reports | (2021) 11:4566 | https://doi.org/10.1038/s41598-021-83900-y 7
Vol.:(0123456789)www.nature.com/scientificreports/
Figure 7. Tests on the swimming pool: (A) tethered paddling; (B) blood lactate assessment; (C) endurance
paddling test with V̇O2 assessment and heart rate monitoring; (D) maximal paddling velocity test.
according to the manufacturer instructions. The telemetric portable gas analyzer was transported along the
swimming pool suspended at a 2 m height over the water on a steel c able41. The V̇O2 kinetics parameters were
estimated, including the precision of estimation (confidence limits), by bootstrapping with 1000 samples42,43. The
cardiodynamic phase was not considered for V̇O2 kinetics analysis. Parameter estimates and the goodness of fit of
each model (mono- and bi-exponential) were only analyzed with raw d ata43. For each surfer, the on-transient of
endurance paddling test was modelled with mono- and bi-exponential models using the VO2FITTING software43,
as described in Eqs. (2) and (3):
V̇O2 (t) = A0 + H(t − TDfc ) × Afc 1 − e−(t−TDfc )/τfc (2)
V̇O2 (t) = A0 +H(t − TDfc )×Afc 1 − e−(t−TDfc )/τfc +H(t − TDsc )×Asc 1 − e−(t−TDsc )/τsc (3)
where V̇O2(t) represents the V̇O2 normalized to body mass at the time t, A0 is the V̇O2 at rest (2 min average)
and H represents the Heaviside step function described in Eq. (4)44. The Afc and Asc, TDfc and TDsc, and τfc and
τsc, are the amplitudes, the corresponding time delays and time constants of the fast and slow V̇O2 components,
respectively.
0, t < 0
H(t) =
1, t ≥ 0 (4)
V̇O2 at the end was calculated as the average of the last 60 s of exercise. Since the asymptotic value of the sec-
ond function is not necessarily reached at the end of the exercise, the amplitude of the A
sc at the end of the test
(Asc_end) was also calculated (Eq. 5)45:
Asc_end = Asc (1 − e−(tend −TDsc )/τsc ) (5)
where tend is the time at the end of the endurance paddling test. Heart rate (HR) was continuously monitored
using a Polar Vantage NV (Polar Electro Oy, Kempele, Finland) transmitting data telemetrically to the K 4b2
portable unit aiming to assess the percentage of maximal HR (HRmax) during the effort. Capillary blood sam-
ples for blood lactate concentrations ([La−]) assessment using a Lactate Pro analyzer (Arkay, Inc., Kyoto, Japan)
were collected from the earlobe (Fig. 7, panel B) before exercise, during the recovery intervals and immediately
after the tests (at the first and third min). During sprint and endurance paddling tests surfers received verbal
encouragement to be motivated and achieve their best performance.
The total energy expenditure ( Etot ) during the 6 min endurance paddling was estimated by the sum of
anaerobic alactic (AnAL), anaerobic lactic (AnL) and aerobic (Aer) energy p athways5,18,36. The Etot during sprint
paddling was estimated by the sum of AnAL and AnL energy pathways due to its short time duration (~ 10 s)46.
The Aer energy expenditure was calculated from the time integral of the net V̇O2 versus time relationship (di
Prampero 1986; Zamparo et al. 2020) and AnL obtained using the following e quation47,48:
Scientific Reports | (2021) 11:4566 | https://doi.org/10.1038/s41598-021-83900-y 8
Vol:.(1234567890)www.nature.com/scientificreports/
AnL = La− net · β · M
(6)
− −
where [La ]net is the difference between the [La ] before and after exercise, β is the constant for O2 equivalent
of [La−]net (2.7 ml·kg−1·mM−1) and M is the body m ass47. Then, AnL was expressed in kJ by assuming an energy
equivalent of 20.9 kJ L −147. AnAL was estimated from the maximal phosphocreatine splitting in the contracting
muscle using the equation48:
AnAL = PCr · 1 − e−t/τ · M (7)
where PCr is the phosphocreatine concentration at rest, t is the exercise time, τ is time constant of the PCr split-
ting at exercise onset (23.4 s) and M is the body mass. Subsequently, it was expressed in kJ by assuming an energy
equivalent of 0.468 kJ·mM−1 and a phosphate/oxygen ratio of 6.2549. The energy cost was obtained as the ratio
between Etot and distance, and the metabolic power (Ė) was estimated as the ratio between Etot and time34,36,49.
Statistical analyses. An algorithm for identifying maximal and minimum force–time curve peaks was
developed in the Excel 2013—VBA package (Microsoft Corp., Redmond, WA). Mean and SD are presented as
descriptive statistics. Normality, homogeneity and sphericity were satisfied. Repeated Measures ANOVA was
applied to check differences between PRE and POST sprint-paddling tests. When necessary Bonferroni post-
hoc was used. Effect sizes (Cohen’s d) were interpreted with the following criteria: 0–0.19 trivial, 0.2–0.59 small,
0.6–1.19 moderate, 1.2–1.99 large, 2.0–3.99 very large and > 4.0 nearly p erfect50,51. Linear and non-linear regres-
sions between biomechanical and energetic variables were computed. Statistical analysis was carried out using
Statistica 12 software (StatSoft, Tulsa, USA). A significance level (α) of 0.05 was defined a priori.
Ethical approval
All procedures performed in studies involving human participants were in accordance with the ethical stand-
ards of the institutional and/or national research committee and with the 1964 Helsinki declaration and its later
amendments or comparable ethical standards.
Informed consent
Informed consent was obtained from all individual participants included in the study.
Data availability
Raw and unprocessed data are available upon request at rzacca@fade.up.pt.
Received: 25 September 2020; Accepted: 5 February 2021
References
1. Méndez-Villanueva, A. et al. Upper body aerobic fitness comparison between two groups of competitive surfboard riders. J. Sci.
Med. Sport 8(1), 43–51 (2005).
2. Frank, M., Zhou, S., Bezerra, P. & Crowley, Z. Effects of long-term recreational surfing on control of force and posture in older
surfers: a preliminary investigation. J. Exerc. Sci. Fit 7(1), 31–38 (2009).
3. Tran, T. T. et al. Comparison of physical capacities between nonselected and selected elite male competitive surfers for the National
Junior Team. Int. J. Sports Physiol. Perform. 10(2), 178–182 (2015).
4. Godoy, D. F., Cadore, E. L., Feitosa, W. G., Correia, R. D. A., Castro, F. A. D. S. Oxygen uptake of wave surfers and complementary
parameters in front crawl and surfing-paddling tests. J. Strength Cond. Res. https: //doi.org/10.1519/jsc.000000 00000 03205 (2019).
5. Zamparo, P., Cortesi, M. & Gatta, G. The energy cost of swimming and its determinants. Eur. J. Appl. Physiol. 120(1), 41–66 (2020).
6. Enoka, R. M. & Stuart, D. G. Neurobiology of muscle fatigue. J. Appl. Physiol. 72(5), 1631–1648 (1992).
7. Burnley, M. & Jones, A. M. Power–duration relationship: physiology, fatigue, and the limits of human performance. Eur. J. Sports
Sci. 18, 1–12 (2018).
8. Korzeniewski, B. & Rossiter, H. B. Exceeding a “critical” muscle Pi: implications for VO2 and metabolite slow components, muscle
fatigue and the power–duration relationship. Eur. J. Appl. Physiol. https://doi.org/10.1007/s00421-020-04388-4 (2020).
9. Secomb, J. L., Sheppard, J. M. & Dascombe, B. J. Time-motion analysis of a 2-hour surfing training session. Int. J. Sports Physiol.
Perform. 10(1), 17–22 (2015).
10. Minahan, C. L., Pirera, D. J., Sheehan, B., MacDonald, L. & Bellinger, P. M. Anaerobic energy production during sprint paddling
in junior competitive and recreational surfers. Int. J. Sports Physiol. Perform. 11(6), 810–815 (2016).
11. Mendez-Villanueva, A., Bishop, D. & Hamer, P. Activity profile of world-class professional surfers during competition: a case study.
J. Strength Cond. Res. 20(3), 477–482 (2006).
12. Farley, O. R., Harris, N. K. & Kilding, A. E. Physiological demands of competitive surfing. J. Strength Cond. Res. 26(7), 1887–1896
(2012).
13. Farley, O. R. L., Harris, N. K. & Kilding, A. E. Anaerobic and aerobic fitness profiling of competitive surfers. J. Strength Cond. Res.
26, 2243–2248 (2012).
14. Meir, R. A., Lowdon, B. J. & Davie, A. J. Heart rates and estimated energy expenditure during recreational surfing’. Aust. J. Sci.
Med. Sport 23(3), 70–74 (1991).
15. Furness, J. W. et al. Physiological profile of male competitive and recreational surfers. J. Strength Cond. Res. 32(2), 372–378 (2018).
16. Ekmecic, V. et al. Increasing surfboard volume reduces energy expenditure during paddling. Ergonomics 60, 1255–1260 (2017).
17. Araújo, D., Davids, K. & Passos, P. Ecological validity, representative design, and correspondence between experimental task
constraints and behavioral setting: comment on. Ecol. Psychol. 19, 69–78 (2007).
18. di Prampero, P. E. The energy cost of human locomotion on land and in water. Int. J. Sports Med. 7, 55–72 (1986).
19. Sousa, A. et al. Exercise modality effect on bioenergetical performance at VO2max intensity. Med. Sci. Sports Exerc. 47(8), 1705–
1713 (2015).
20. Zacca, R. et al. 5 km front crawl in pool and open water swimming: breath-by-breath energy expenditure and kinematic analysis.
Eur. J. Appl. Physiol. 120(9), 2005–2018 (2020).
Scientific Reports | (2021) 11:4566 | https://doi.org/10.1038/s41598-021-83900-y 9
Vol.:(0123456789)www.nature.com/scientificreports/
21. Zamparo, P., Capelli, C. & Guerrini, G. Energetics of kayaking at submaximal and maximal speeds. Eur. J. Appl. Physiol. Occup.
Physiol. 80, 542–548 (1999).
22. Morouço, P. G., Vilas-Boas, J. P. & Fernandes, R. J. Evaluation of adolescent swimmers through a 30-s tethered test. Pediatr. Exerc.
Sci. 24, 312 (2012).
23. Loturco, I. et al. A correlational analysis of tethered swimming, swim sprint performance and dry-land power assessments. Int. J.
Sports Med. 37, 211–218 (2016).
24. Lauer, J., Rouard, A. H. & Vilas-Boas, J. P. Upper limb joint forces and moments during underwater cyclical movements. J. Biomech.
49, 3355–3361 (2016).
25. Everline, C. Shortboard performance surfing: a qualitative assessment of maneuvers and a sample periodized strength and con-
ditioning program in and out of the water. Strength Cond. J. 29, 32–40 (2007).
26. Nessler, J. A., Silvas, M., Carpenter, S. & Newcomer, S. C. Wearing a wetsuit alters upper extremity motion during simulated
surfboard paddling. PLoS ONE 10, e0142325 (2015).
27. Farley, O. R. L., Abbiss, C. R. & Sheppard, J. M. Testing protocols for profiling of surfers’ anaerobic and aerobic fitness: a review.
Strength Cond. J. 38(5), 52–65 (2016).
28. Farley, O. R. L. et al. Five weeks of sprint and high-intensity interval training improves paddling performance in adolescent surfers.
J. Strength Cond. Res. 30, 2446–2452 (2016).
29. Loveless, D. J. & Minahan, C. Peak aerobic power and paddling efficiency in recreational and competitive junior male surfers. Eur.
J. Sports Sci. 10, 407–415 (2010).
30. Loveless, D. J. & Minahan, C. Two reliable protocols for assessing maximal-paddling performance in surfboard riders. J. Sports
Sci. 28, 797–803 (2010).
31. Lowdon, B., Bedi, J. & Horvath, S. Specificity of aerobic fitness testing of surfers. Aust. J. Sci. Med. Sports 21, 7–10 (1989).
32. Mendez-Villanueva, A. & Bishop, D. Physiological aspects of surfboard riding performance. Sports Med. 35, 55–70 (2005).
33. Bonen, A., Wilson, B. A., Yarkony, M. & Belcastro, A. N. Maximal oxygen uptake during free, tethered, and flume swimming. J.
Appl. Physiol. 48, 232–235 (1980).
34. Fernandes, R. J. et al. Does net energy cost of swimming affect time to exhaustion at the individual’s maximal oxygen consumption
velocity?. J. Sports Med. Phys. Fit. 46(3), 373–380 (2006).
35. Pendergast, D. et al. Energy balance of human locomotion in water. Eur. J. Appl. Physiol. 90, 377–386 (2003).
36. Zacca, R. et al. Monitoring age-group swimmers over a training macrocycle: energetics, technique, and anthropometrics. J. Strength
Cond. Res. 34(3), 818–827 (2020).
37. Capelli, C. Physiological determinants of best performances in human locomotion. Eur. J. Appl. Physiol. Occup. Physiol. 80, 298–307
(1999).
38. Lima, A., Semblano, P., Fernandes, D., Gonçalves, P., Morouço, P., Sousa, F., Fernandes, R., Barbosa, T., Correia, M. V. & Tani,
G. A kinematical, imagiological and acoustical biofeedback system for the technical training in breaststroke swimming. In: Xth
International Symposium Biomechanics and Medicine in Swimming. (eds Vilas-Boas, J. P., Alves, F. & Marques, A.) 22 (Portuguese
Journal of Sport Sciences, 2006).
39. Coyne, J. O. C. et al. Maximal strength training improves surfboard sprint and endurance paddling performance in competitive
and recreational surfers. J. Strength Cond. Res. 31, 244–253 (2017).
40. Baldari, C. et al. Is the new AquaTrainer snorkel valid for VO2 assessment in swimming?. Int. J. Sports Med. 34, 336–344 (2013).
41. de Jesus, K. et al. Which are the best VO2 sampling intervals to characterize low to severe swimming intensities?. Int. J. Sports Med.
35, 1030–1036 (2014).
42. Curran-Everett, D. Explorations in statistics: the bootstrap. Adv. Physiol. Educ. 33, 286–292 (2009).
43. Zacca, R. et al. VO2FITTING: a free and open-source software for modelling oxygen uptake kinetics in swimming and other
exercise modalities. Sports (Basel) 7, 31 (2019).
44. Ma, S., Rossiter, H. B., Barstow, T. J., Casaburi, R. & Porszasz, J. Clarifying the equation for modeling of kinetics above the lactate
threshold. J. Appl. Physiol. 109, 1283–1284 (2010).
45. Reis, J. F., Millet, G. P., Bruno, P. M., Vleck, V. & Alves, F. B. Sex and exercise intensity do not influence oxygen uptake kinetics in
submaximal swimming. Front. Physiol. 8, 72 (2017).
46. Gastin, P. B. Energy system interaction and relative contribution during maximal exercise. Sports Med. 31, 725–741 (2001).
47. di Prampero, P., Pendergast, D., Wilson, D. & Rennie, D. Blood lactic acid concentrations in high velocity swimming. In Swimming
Medicine (eds Eriksson, B. & Furberg, B.) 249–261 (University Park Press, Baltimore, 1978).
48. Sousa, A. C., Vilas-Boas, J. P. & Fernandes, R. J. VO2 kinetics and metabolic contributions whilst swimming at 95, 100, and 105%
of the velocity at VO2max. Biomed. Res. Int. 2014, 675–363 (2014).
49. Zamparo, P., Capelli, C. & Pendergast, D. Energetics of swimming: a historical perspective. Eur. J. Appl. Physiol. 111, 367–378
(2011).
50. Harrison, A. J. et al. Recommendations for statistical analysis involving null hypothesis significance testing. Sports Biomech. 19(5),
561–568 (2020).
51. Hopkins, W.G. A scale of magnitudes for effect statistics. New View Stat. 502, 411 (2002).
Acknowledgements
The authors thank the support of coaches, surfers, LABIOMEP-UP staff and all those who were involved in this
study. This study was partially supported by CAPES Foundation, Ministry of Education of Brazil, Brasília, Brazil
– BEX 0819140. The authors declare that they have no conflict of interest.
Author contributions
M.B.S., R.Z., R.F. and J.P.V.B. developed the original research inquiry, M.B.S. recruited participants, M.B.S., R.Z.,
R.F. and J.P.V.B. collected data, M.B.S. and R.Z. analysed data, M.B.S., R.Z., R.F. and J.P.V.B. collaborated in data
interpretation, writing, and reviewing the manuscript. All authors approved the final version of this manuscript.
Competing interests
The authors declare no competing interests.
Additional information
Correspondence and requests for materials should be addressed to R.Z.
Reprints and permissions information is available at www.nature.com/reprints.
Publisher’s note Springer Nature remains neutral with regard to jurisdictional claims in published maps and
institutional affiliations.
Scientific Reports | (2021) 11:4566 | https://doi.org/10.1038/s41598-021-83900-y 10
Vol:.(1234567890)www.nature.com/scientificreports/
Open Access This article is licensed under a Creative Commons Attribution 4.0 International
License, which permits use, sharing, adaptation, distribution and reproduction in any medium or
format, as long as you give appropriate credit to the original author(s) and the source, provide a link to the
Creative Commons licence, and indicate if changes were made. The images or other third party material in this
article are included in the article’s Creative Commons licence, unless indicated otherwise in a credit line to the
material. If material is not included in the article’s Creative Commons licence and your intended use is not
permitted by statutory regulation or exceeds the permitted use, you will need to obtain permission directly from
the copyright holder. To view a copy of this licence, visit http://creativecommons.org/licenses/by/4.0/.
© The Author(s) 2021
Scientific Reports | (2021) 11:4566 | https://doi.org/10.1038/s41598-021-83900-y 11
Vol.:(0123456789)You can also read