THE GROWING BURDEN OF NON-COMMUNICABLE DISEASES IN THE EASTERN CARIBBEAN - Human Development Unit Caribbean Country Management Unit Latin America ...
←
→
Page content transcription
If your browser does not render page correctly, please read the page content below
THE GROWING BURDEN
OF NON-COMMUNICABLE
DISEASES IN THE
EASTERN CARIBBEAN

Human Development Unit
Caribbean Country Management Unit
Latin America and the Caribbean Region

The World Bank
Document of the World Bank
This document has a restricted distribution and may be used by recipients only in the performance of their official duties. Its
contents may not otherwise be disclosed without World Bank authorization
ABREVIATIONS & ACRONYMS

API		          Active Pharmaceutical Ingredients
BMI		          Body Mass Index
CARICOM        The Caribbean Community
CDC		          Center for Disease Control
COPD		         Chronic Obstructive Pulmonary Disease
CWD		          Caribbean Wellness Day
DALY		         Disability-Adjusted Life Year
DMP		          Disease Management Program
EPM		          Energy Protein Malnutrition
FAO		          Food and Agriculture Organization
FCTC		         Framework Convention on Tobacco Control
GDP		          Gross Domestic Product
GFATM		        Global Fund to Fight AIDS, Tuberculosis, and Malaria
GYTS		         Global Youth Tobacco Survey
HALE		         Healthy Life Expectancy
HIV/AIDS       Human Immunodeficiency Virus / Acquired Immunodeficiency Syndrome
LAC		          Latin America and Caribbean
LEB		          Life Expectancy at Birth
MOH		          Ministry of Health
NCDs		         Non-Communicable Diseases
NGO		          Non-Governmental Organization
NLTA		         Non Lending Technical Assistance
OECD		         Organization for Economic Cooperation and Development
OECS		         Organization of Eastern Caribbean States
PAHO		         Pan American Health Organization
PEPFAR		       President’s Emergency Fund for AIDS Relief
UN		           United Nations
UWI		          University of West Indies
WDI		          World Development Indicators
WHO		          World Health Organization
WRI		          World Resources Institute

CURRENCY EQUIVALENTS

Currency Unit: Eastern Caribbean Dollar (EC$) US$1.0 = EC$ 2.70
The $ sign in the text refers to US$ unless otherwise stated

FISCAL YEAR

Antigua and Barbuda and St. Lucia: April 1 – March 31
Dominica: July 1 – June 30
Grenada, St. Kitts and Nevis, St. Vincent and the Grenadines: January 1 – December 31

Contents
Acknowledgements8

Executive Summary9

I. Introduction12

       The World Bank’s Role in the OECS12

       Objectives and Scope of this Report13

II. The emergence and predominance of NCDs14

       The Demographic Transition15

       The Epidemiological Transition21

III. Risk factors contributing to the burden of disease26

       Obesity27

       Physical Inactivity29

       Alcohol Consumption31

IV. Assessing the economic impact of NCDs in OECS countries34

       Expenditure on Diabetes Mellitus in the Six Independent OECS Countries35

       A Case Study: The Private Economic Burden of Major NCDs in St. Lucia36

V. Country responses to control and prevent NCDs40

VI. Lessons from other countries applicable to address NCDs in OECS countries44
VII. Policy options for OECS countries to address NCDs effectively48
Annex 1. OECS NCD country overviews52
Appendix 1: Key WHO global recommendations on physical activity for health70
References72

TABLES
Table 1. Population and population growth rate17
Table 2. Age structure across selected OECS countries (%)19
Table 3. Demographic and health indicators20
Table 4. Burden of disease in OECS countries: age standardized disability adjusted life-years per 100,000
         of population by cause22
Table 5. Leading causes of death in OECS countries, 2004 (% of total deaths, age adjusted)22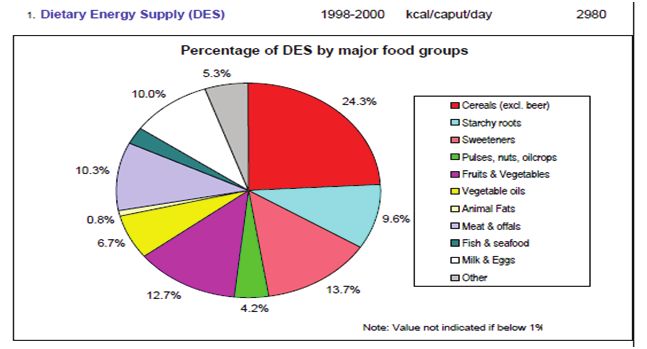
Table 6. Healthcare financing OECS countries (latest year available)23
Table 7. Expenditure per capita on diabetes mellitus in six independent OECS countries (in USD, 2005)35
Table 8. Total public annual expenditure on diabetes mellitus in six independent OECS countries
         (in USD millions, 2005)35
Table 9. Estimate of the NCD population in St. Lucia38
Table 10. Antigua and Barbuda, overweight and obesity prevalence (%)53
Table 11. Dominica, overweight and obesity prevalence (%)55
Table 12. Prevalence of obesity and overweight in Grenada (%)56
Table 13. Prevalence of obesity and overweight in St. Kitts and Nevis, (%)60
Table 14. Prevalence of obesity and overweight in St. Lucia (%)61
Table 15. Prevalence of obesity and overweight in St. Vincent and the Grenadines (percent)66

FIGURES
Figure 1. Infant mortality rates (deaths per 1,000 live births)15
Figure 2. Death rates per 1,000 population15
Figure 3. Birth rate per 1,000 live births16
Figure 4. Total fertility rate16
Figure 5. Life expectancy at birth17
Figure 6. Distribution of population by age groups and sex (%), 2000 and 201118
Figure 7. Increasing female and male population in the 65+ age group19
Figure 8. Urban population as a percentage of total population, 201121
Figure 9. Estimated mortality rates by groups of disease for the Americas and its main sub-regions,
          2002-200422
Figure 10. Three leading causes of death by OECS countries and gender, 2004
           (% of total deaths, age adjusted)23

Figure 11. Distribution of disability adjusted life-years by NCDs and OECS countries, 2004
           (% in total disability-adjusted life-years, age adjusted)24
Figure 12. Prevalence of overweight people in the OECS countries29
Figure 13. Prevalence of obesity in the OECS countries30
Figure 14. St. Lucia – prevalence of physical inactivity among the 13–15 age group in 200631
Figure 15. St. Vincent and the Grenadines – prevalence of physical inactivity among the 13–15 age
           group in 200731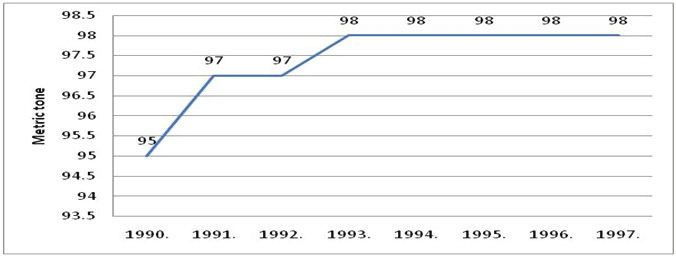
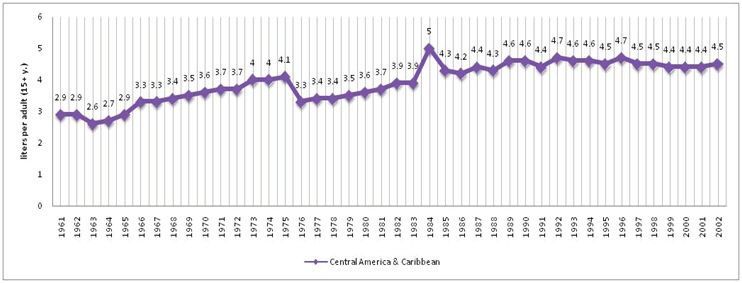
Figure 16. Alcohol consumption in Central America and Caribbean, in liters per adult per year
           (among the 15+ age group)32
Figure 17. Alcohol consumption in OECS countries, liters per adult (among the 15+ age group)33
Figure 18. Distribution of individual economic burden from major NCDs in St. Lucia (in US$, 2006)36
Figure 19. Individual annual direct healthcare cost for major NCDs disaggregated by facility type
           (public or private) (in US$, 2006)36
Figure 20. Individual annual direct healthcare cost for major NCDs by insurance cover (in US$, 2006)37
Figure 21. Percent of NCD patients making healthcare visits by household expenditure quintiles37
Figure 22. Individual annual direct healthcare cost by population quintiles for the four major NCDs
           (in US$, 2006)38
Figure 23. Estimated national aggregate private economic burden of major NCDs by socio-economic
           subgroups in St. Lucia (in US$ millions, 2006)38
Figure 24. Antigua and Barbuda: Tobacco smoke prevalence among the 13-15 age group54
Figure 25. Antigua and Barbuda: Alcohol - gross inland availability54
Figure 26. Dominica, Dietary Energy Supply (DES), 1998–200056
Figure 27. Dominica, major food imports as percentage of dietary energy supply56
Figure 28. Dominica, tobacco smoking prevalence among the 13-15 age group57
Figure 29. Grenada, mean cholesterol level among the population aged 15-10058
Figure 30. Grenada, tobacco smoking prevalence among the 13–15 age group58
Figure 31. St. Kitts and Nevis, mean cholesterol level among the population aged 15-10058
Figure 32. St. Kitts and Nevis, tobacco smoking prevalence among the 13-15 age group60
Figure 33. Percentage of population suffering from four major NCDs by age group61
Figure 34. Percentage of population suffering from four major NCDs by Gender and Population Quintile61
Figure 35. St. Lucia, smoking prevalence among the 25+ age group. Current user, cigarette
           (general/unspecified), 199462
Figure 36. St. Lucia, smoking prevalence among the 13-15 age group63
Figure 37. St. Lucia, Smoking prevalence per household quintiles category (MoH 2006)63
Figure 38. St. Lucia, percentage of alcohol consumer by gender among the 25+ age groups65
Figure 39. St. Lucia, Drinking alcohol per household quintile category66
Figure 40. St. Vincent and the Grenadines, tobacco smoking prevalence among the 13-15 age group67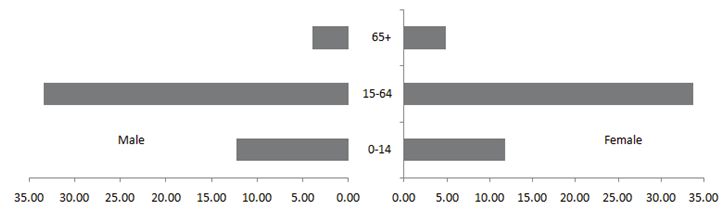
8

ACKNOWLEDGEMENTS
    This report was prepared by a team led by Shiyan Chao (Task Team Leader) including Carmen Carpio, Willy De Geyndt, Zukhra
Shaabdullaeva, and Yuyan Shi. Editorial support was provided by Colin Douglas, Viviana Gonzalez, and Julie Nannucci; and graphic design
and desk-topping by Juan Carlos Rojas. The work was carried out under the guidance of Françoise Clottes (Country Director, LCC3C), Yvonne
Tsikata (Formal Country Director, LCC3C), Keith Hansen (Sector Director, LCSHD), Joana Godinho (Sector Manager, LCSHH), and David
Warren (Sector Leader, LCSHD).

  The peer reviewers were Son Nam Nguyen and Irina Nikolic. Additional comments were received from Maria Eugenia Bonilla-Chacin,
Margaret Grosh, Montserrat Meiro-Lorenzo, and Afef Haddad.

    The authors would like to acknowledge Dr. David Johnson, Chief Medical Officer of the Dominica Ministry of Health and Xysta Edmunds,
Chief Health Planner of the St. Lucia Ministry of Health for facilitating their respective Ministry of Health team’s input during the development
of the study and for sharing available information. The study also benefitted from consultations carried out during a Regional Dissemination
Meeting on Non-Communicable Chronic Diseases hosted by Jamaica’s Ministry of Health in partnership with the Pan American Health
Organization (PAHO) and the World Bank from September 7-8, 2011. The participants, mainly the Chief Medical Officers from Antigua &
Barbuda, Bahamas, Belize, Barbados, Dominica, Guyana, Grenada, St. Kitts and Nevis, St. Lucia, St. Vincent and the Grenadines, Trinidad
and Tobago, and Suriname provided comments and written inputs for finalization of the study
9
EXECUTIVE SUMMARY
Countries comprising the Organization of Eastern Caribbean States1 (OECS) face a growing challenge of non-communicable diseases
(NCDs). NCDs are responsible for six of the top ten leading causes of death in the region, represent a growing portion of health spending, and
impose a large economic burden at the societal, community, and household level. The common underlying risk factors fueling the crisis are
poor diet, physical inactivity, tobacco use, and alcohol abuse. Current policies and programs do not sufficiently focus on prevention and could
be improved with a multisectoral and coordinated approach.
The World Bank undertook a review to assist them reduce the burden of NCDs. This report proposes a set of policy options to consider
in developing their national NCD strategies based on a situation analysis and a review of global experiences. Data in the OECS countries on
the epidemiology of NCDs are limited, preventing a fully comprehensive review. Secondary data sources and aggregate descriptive data are
used to review the demographic and epidemiological transitions in the OECS countries, to assess key risk factors and make inter-country
comparisons. Household survey data were available for St. Lucia, however, enabling an estimate of the economic burden of NCDs and their
impact on patients and on families from poorer households.
Main Findings
The demographic transition has resulted in a longer-living population with new demands on the health systems in OECS countries.
Overall population growth rate across the six OECS countries has increased between 1990 and 2011. Women represent a larger percentage
of the population and the 65+ segment of the population is growing relative to the younger segment. OECS countries are also becoming
more urbanized, resulting in more crowding.
Their epidemiological transition has shifted the major causes of mortality and morbidity from communicable diseases to NCDs. Of Years
of Life Lost, 70 percent are now due to NCDs; the global average is fewer than 50 percent, and for low- and middle-income countries in the
Americas about 60 percent.
That NCDs are largely preventable by reducing the main behavioral risk factors is the global consensus convincingly supported by existing
evidence. This study assesses and analyzes the challenges faced to tackle NCDs in the six countries.
Overweight/obesity is steadily increasing, especially among women. Dominica has the highest obesity prevalence in both gender groups
in the OECS; it is projected that about 38.4 percent of males and 65.3 percent of females will be obese by 2015. It is also estimated that almost
60 percent of females in St. Lucia will be obese by 2015. WHO and FAO data confirm the shift from undernourishment to overweight among
children in the OECS countries and that obesity is common among children.
Physical inactivity levels are high and females are less physically active than males in each country. The degree of physical inactivity has
been steadily increasing due to growing urbanization and sedentary lifestyles.
Tobacco use and excessive alcohol consumption are widespread across the Caribbean; of particular concern is the early age of onset.
Alcohol use is common across OECS countries but varies from 10.9 liters per capita in St. Lucia to 5.5 liters per capita in Antigua and
Barbuda. Inadequate prevention and the late stage of seeking care heightens the financial consequences.
NCDs impose a large economic burden on patients, their families, and society at large. Available data from the WHO’s Diabetes Atlas
indicates that treating NCDs is costly. In the OECS countries the annual cost for treating a diabetic ranges from US$322 to US$769. The St.
Lucia data show that NCD patients spend 36 percent of their total household expenditure annually for care. Poorer households spend 48
percent of their per capita expenditure on healthcare while better-off households spend less than 20 percent.
1 Antigua and Barbuda, Dominica, Grenada, St. Kitts and Nevis, St. Lucia and St. Vincent and the Grenadines10
Policy Options:
Experiences and lessons learned from developed countries in addressing NCDs could be useful for developing national strategies to control
their impact. The following policy options may be applied:
• Strengthen surveillance and monitoring. To set priorities and design and evaluate interventions, more comprehensive and reliable
data are needed on the prevalence of risk factors, NCDs, and health behaviors of high risk groups, including the costs and effectiveness
of priority health promotion, prevention strategies, and investments in technologies for secondary and tertiary prevention. The
key trends and common patterns observed across OECS countries can be countered through strengthening surveillance systems,
identifying the key indicators and data available, and ensuring that they are captured in health management information systems.
• Tackle risk factors. WHO recommends collecting relevant data on risk factors in each country to design targeted interventions. At
the April 2011 First Global Ministerial Conference on Healthy Lifestyles and NCDs Control, consensus was reached on the need to
prioritize the implementation of cost-effective policies to reduce common risk factors. The four priority population-based programs
would tackle excessive alcohol consumption, tobacco use, and obesity, and promote physical activity. Together with the traditional
diet of starchy and high-sugar foods, these are fueling an NCD crisis in the region. Across the OECS, women tend to be more obese
and less physically active. Smoking prevalence is low but is responsible for ten percent of all deaths in the Caribbean. The limited
information available on alcohol consumption indicates that it has been increasing since 1961. Of particular concern is the growing
trend of the risk factors affecting adolescents with increased physical inactivity and early use of tobacco and alcohol. Specific policy
options would need to be developed to address the higher tendencies for women’s obesity and physical inactivity, and for prevention
programs to reach the adolescent population, but a first step would be education on healthy food choices, while ensuring accessibility
and affordability.
• Develop and enforce legislative and policy actions. Develop regulations on tobacco and alcohol around pricing and taxation, smoke-
free work and public places, and restrict alcohol outlets and operating hours. Develop standards and enforcement control, especially
on sales restrictions, advertising and drunk driving.
• Develop health promotion policies. The private sector should be involved in disease prevention and health promotion, starting at
the work-place and in schools. Work- place Health Promotion can go beyond occupational safety to target smoking, alcohol, stress,
and healthy eating and can help reach middle-aged, employed males who often neglect their health and are a difficult target group
to reach. School programs have the largest return on investment in promoting a healthy lifestyle and decreasing the future disease
burden. Ministries of Health should work with education authorities to integrate health promotion and prevention into curricula
and teach about the risk factors that lead to NCDs, and the importance of diet and physical activity. Strategies and incentives could
encourage the food industry to manufacture, distribute, and market healthier products, and to include health messages in marketing
campaigns.
• Develop primary prevention through population-based programs that target the whole population to prevent adverse health risks from
occurring in the first place. Successful programs require an integrated approach with: (a) mass media activities to promote healthy
lifestyles; (b) feasible public awareness and health education campaigns; (c) supportive structures that engage non-governmental
organizations and private sectors; and (d) health promotion messages based on reliable, evidence-based information with wide
distribution of material through different channels.
• Develop secondary prevention through individual clinical intervention programs to identify high-risk individuals at the point of service
delivery. Interventions and follow-up are needed for individuals with risk factors to prevent deterioration, incapacity, and fatality.
Clinical interventions require a focus on primary healthcare with an emphasis on continuity, integrated management of key chronic
conditions, checking adherence, periodic retesting and adjusting of regimens. An effective primary healthcare system with close
links to secondary and social care can improve prevention and management of NCDs.
• Train health professionals in delivering preventive services. The capacity and motivation of physicians and nurses is often key to
promoting health and preventive care. The OECS countries have a history of using regional institutions for training health workers,
especially physicians, so regional cooperation can develop new qualifications to prevent and treat NCDs and share faculty, didactic
materials, educational strategies, learning methods and lessons learnt. They should increase involvement of health professionals
in health promotion, organize continuing education on prevention, especially intervention strategies and methods, involve nurses
in screening and management of risk factors, organize risk factor management services for health professionals (e.g. smoking
cessation), and enhance collaboration between health professionals in primary healthcare and other public and civil society entities
involved in prevention and health promotion.11
• Apply a multisectoral approach. Experience with implementing HIV/AIDS projects has given the OECS countries tools and methods
to change behavior and to advocate changes in lifestyles through awareness raising, sensitization campaigns, working with mass
media and NGOs, prevention activities, and treatment programs. These could be applied to reduce the impact of NCD risk factors.
Reducing this burden in the OECS countries will require coordinated regional and national intersectoral strategies that involve the
public and private sectors, government and non-governmental organizations, and communities and families. The OECS Secretariat
could coordinate technical assistance to member countries. The experience of high-income countries could be examined for insights
into tried and tested approaches to yield results in addressing NCDs.
• Develop a regional approach. Harmonized legislation and policies, especially in the areas of tobacco, alcohol, food, essential
medicines, and information technologies, are necessary for successful prevention. A regional strategy would be cost-effective for
reasons of economies of scale and the presence of positive or negative externalities. This will be gradual, however, as countries would
move at different speed according to capability and the varying degrees of difficulty in implementing regional policies and actions.
Harmonization could be achieved by assigning overall coordination to an already existing regional authority. The Mesoamerican
Initiative and other diagonal approaches offer learning on elements of regional approaches.
• Mobilize resources for implementing strategies and programs. Lessons from other countries can help identify approaches for
mobilizing resources. For example, Jamaica’s experience may provide insight on how NCD treatment can be financed as well as ensure
that incentives are designed to focus on prevention programs. Jamaica’s National Health Fund (NHF) provides free or subsidized
medicines to patients with NCDs and finances prevention programs. It generates a sustained revenue stream through tobacco tax
and special consumption taxes on petrol, alcohol, and motor vehicles. The OECS can also tap into the private sector as Jamaica
did in involving the pharmaceutical companies in meeting claims of NCD patients under the NHF program. The Pharmaceutical
Procurement Service (PPS) agency already invites tenders and awards Regional Price Contracts for procuring pharmaceuticals for
OECS states. After 15 years of successful centralized tendering and pooled procurement of pharmaceuticals and medical products, it
has demonstrated that regional cooperation can reduce costs and enhance the efficiency of health service delivery.
• Raise Political Awareness. The UN High-Level Meeting on NCDs prevention and control took place in September 2011 and provided
an opportunity to create a sustained global movement against premature death and preventable morbidity from NCDs, mainly heart
disease, stroke, cancer, diabetes, and chronic respiratory disease. The Caribbean region has played an instrumental role in raising
the profile of the issue and was featured at the UN High Level Meeting. The OECS should build on this momentum to ensure that
prioritization of NCDs on a global stage is mirrored at the country and regional level.THE GROWING BURDEN OF NON-COMMUNICABLE DISEASES IN THE EASTERN CARIBBEAN 12
I. INTRODUCTION
The purpose of this report is to examine
and propose options for policy design and
implementation, based on a situational
analysis for six Eastern Caribbean
countries and a review of the lessons of
other nations in prevention and control. A
committed partner of the OECS countries,
the World Bank is responding to their
needs to address the increasing NCDs
burden by providing this report.INTRODUCTION 13
THE WORLD BANK’S ROLE IN THE OECS
The Bank has been a committed partner. The World Bank has been assisting the independent OECS countries in enhancing
competitiveness and in building capacity for economic growth through protection and improvement of human capital (social safety
nets, education, and health), inter alia. The main support in the health sector over the past decade has been to combat HIV/AIDS by
providing loans, grants, or credits to Grenada, St. Kitts and Nevis, St. Lucia, and St. Vincent and the Grenadines, totaling US$22.05
million2. That epidemic has stabilized at a prevalence rate of less than one percent in all OECS countries but requires ongoing
surveillance, prevention, and treatment, and the targeting of high-risk populations. The US President’s Emergency Fund for AIDS
Relief (PEPFAR) provides assistance on HIV/AIDS related activities and the OECS Secretariat is trying to mobilize resources from the
Global Fund to Fight AIDS, Tuberculosis, and Malaria (GFATM) to sustain the response to HIV/AIDS in the region.
Country and donor consultation reached consensus on the need to systematically address NCDs. Through consultation at the
October 2010 13th Meeting of OECS Health Ministers, as well as consultation with donor agencies and the OECS Secretariat, it has
become clear that tackling NCDs in the region is urgent. Donor agencies are focusing on health system assessment and strengthening.
As small states, OECS countries feel the need for a regional approach to address common health challenges, build on economies of
scale, and learn from each other. Their common features and interests create opportunities to address challenges in their health
sectors through an enabling environment. The proposed study is a direct response to a request from the OECS Secretariat to assist in
identifying priority actions at country and regional level.
OBJECTIVES AND SCOPE OF THIS REPORT
This report analyzes the situation, reviews lessons learnt in other countries in the prevention and control of major NCDs, and
proposes policy options to address the challenges. Specifically, this report aims to provide policy makers with an overview of the NCDs
and key risk factors in the region and make inter-country comparisons; assess the economic impact of key NCDs and risk factors where
data are available; outline policy options and cost effective interventions for controlling major NCDs that are common to the OECS
countries; and provide input for developing a regional health strategy. In the belief that powerful information can drive strategic action,
the report aims to (a) raise awareness of the reality and consequences of failure to take strong action and (b) identify priority actions
that are realistic and tangible for policy makers in developing strategies and allocating resources.
This report draws on available data. The report draws on publically available information and relies mainly on secondary sources of
data for analysis. Limited data in the OECS imposes a major challenge for this study and preventing a more comprehensive assessment
of the economic impact of NCDs in the OECS countries. While some aggregate descriptive data for all six countries are available
for specific diseases such as heart disease, cancer, stroke, diabetes, and specific risk factors (tobacco use, alcohol consumption, and
overweight people and obesity) from WHO, PAHO, and the World Bank, there are little or no household survey data that would permit
analysis of the socio-economic aspects of the NCDs. Household survey data from 2006 for St. Lucia enabled an estimate of the economic
burden of NCDs and their impact on patients and on families from poorer households. Data on expenditure and costing for NCDs are
unavailable outside the country. The report uses information from the internet complemented by data provided by the Government.
The following chapters will consider the emergence and predominance of NCDs in the OECS countries, the risk factors that are contributing to this
burden of disease, the responses of OECS countries in dealing with NCDs, an assessment of the economic impact of NCDs in the OECS countries,
lessons from other countries which are applicable to addressing NCDs in the OECS countries, and policy options for addressing NCDs effectively.
2 These projects came to an end in 2009 with the exception of the St. Vincent and the Grenadines HIV Project, which closed in April 2011.THE GROWING BURDEN OF NON-COMMUNICABLE DISEASES IN THE EASTERN CARIBBEAN 14
II. THE Key Messages
EMERGENCE AND 1. Mortality rates in the OECS countries are declining as
PREDOMINANCE OF a result of the combination of lower overall death rates
and infant mortality rates.
NCDS
2. The longer-living population in the OECS countries is
creating new demands on the health systems of each
country.
The demographic transition and
3. The population growth across the OECS countries
epidemiological transition involve an has resulted in an increasingly older, female, urban
population.
increase in NCDs as the major cause
of death in the OECS countries. This 4. Across the OECS countries, six out of ten leading
causes of death are NCDs.
chapter reviews both transitions and
5. Mortality from cardiovascular diseases and diabetes is
their impact on the OECS countries
higher for women than men.
and considers life expectancy, the shift
in age distribution, and the results of
urbanization.THE EMERGENCE AND PREDOMINANCE OF NCDS 15
THE DEMOGRAPHIC TRANSITION
Mortality
The OECS countries have experienced a decline in Infant Mortality. The Infant Mortality Rate declined in all six countries from 1990 to
2011 (Figure 1). In Dominica this increased from 13 to 17.1 deaths per 1,000 live births between 1990 and 2000 but this dropped below
1990 levels in 2011. The general death rates in some countries have declined, while others have experienced an increase. Antigua and
Barbuda, Grenada, and St. Kitts and Nevis (SKN) have experienced declining death rates but these have increased in Dominica, St. Lucia
(STL), and St. Vincent and the Grenadines (SVG). (Figure 2).
FIGURE 1. INFANT MORTALITY RATES (DEATHS PER 1,000 LIVE BIRTHS)
45
40
35
30
25
20
15
10
5
0
Antigua & Dominica Grenada SKN STL SVG
Barbuda
1990 2000 2011
Source: (Central Intelligence Agency n.d.)
FIGURE 2. DEATH RATES PER 1,000 POPULATION
12
10
8
Antigua & Barbuda
Dominica
6
Grenada
SKN
4 STL
SVG
2
0
1990 2000 2011
Source: (Central Intelligence Agency n.d.)THE GROWING BURDEN OF NON-COMMUNICABLE DISEASES IN THE EASTERN CARIBBEAN 16
Birth rates fell from 1990 to 2011, with the total fertility rate remaining consistent and even increasing in the case of one country. Birth
rates fell across the region from 1990 to 2011 with the largest decline in Grenada, where the total nearly halved from 36 to 17 live births
per 1,000 (Figure 3). The total fertility rate, by contrast, presents a mixed picture: Antigua and Barbuda, Dominica, and Grenada continue
to hold rates above 2.0; Antigua and Barbuda increased this rate over the two decades; and while Grenada is on a decreasing pattern, it
continues to have the highest rate of all six countries at 2.2 children per woman of reproductive age (Figure 4).
FIGURE 3. BIRTH RATE PER 1,000 LIVE BIRTHS
40
35
30
25
20
15
10
5
0
Antigua & Dominica Grenada SKN STL SVG
Barbuda
1990 2000 2011
Source: (Central Intelligence Agency n.d.)
FIGURE 4. TOTAL FERTILITY RATE
6
5
4
3
2
1
0
Antigua & Dominica Grenada SKN STL SVG
Barbuda
1990 2000 2011
Source: (Central Intelligence Agency n.d.)
Populations are living longer. All six OECS countries experienced an increase in life expectancy at birth between 1990 and 2011, with a
high of 76 in Dominica and St. Lucia (Figure 5). The increase in life expectancy at birth, decrease in the death rate, and increase in infant
mortality rates result in populations living longer. At the same time, the decreasing birth rates and a constant total fertility rate favor growth
of the older population segment.THE EMERGENCE AND PREDOMINANCE OF NCDS 17
FIGURE 5. LIFE EXPECTANCY AT BIRTH
78
76
74
72
70
68
66
64
62
60
58
Antigua & Dominica Grenada SKN STL SVG
Barbuda
1990 2000 2011
Source: (Central Intelligence Agency n.d.)
Age Distribution Shift
Population growth rates have fluctuated across the OECS countries with an overall increase from 1990 to 2011. While the total
population across the six OECS countries decreased from 1990 to 2000, by 2011 it has increased beyond the 1990 levels. Antigua and
Barbuda experienced the highest growth rate of 1.3 percent in 2011 but all other countries remained below 1.0 percent or experienced
decreases in this range in either 2000 or 2011 (Table 1).
TABLE 1. POPULATION AND POPULATION GROWTH RATE
Population Population Growth Rate (%)
1990 2000 2011 (est.) 1990 2000 2011 (est.)
Antigua and Barbuda 63,726 66,422 87,884 NA 0.73 1.289
Dominica 84,854 71,540 72,969 NA -1.14 0.214
Grenada 84,135 89,018 108,419 NA -0.36 0.551
St. Kitts and Nevis 40,157 38,819 50,314 NA -0.22 0.823
St. Lucia 153,196 156,260 161,557 NA 1.21 0.389
St. Vincent and the Grenadines 112,646 115,461 103,869 NA 0.43 -0.327
Total 538,714 537,520 585,012
Source: (Central Intelligence Agency n.d.)
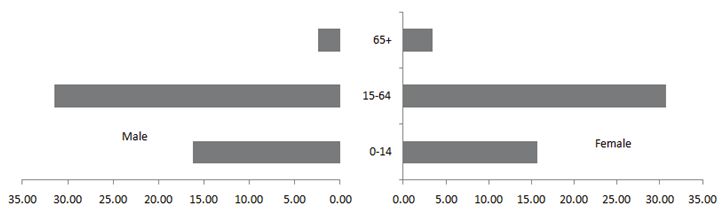
The overall age structure of the population reflects three trends: a declining 0-14 age group, an increasing 15–64 age group, and an
increasing 65+ age group. There is a lack of data on mortality by age group with the result that a population projection by age structure is
not available. Nevertheless, available data for the six study countries show the changing age structure from 2000 to 2011 (Figure 6). Even
though the changes are slight, a decrease in the 0–14 age group can be observed from 2000 to 2011. Data for the 15–64 age group, however,
reflect a population increase. Both men and women increased in the 65+ age group.THE GROWING BURDEN OF NON-COMMUNICABLE DISEASES IN THE EASTERN CARIBBEAN 18
FIGURE 6. DISTRIBUTION OF POPULATION BY AGE GROUPS AND SEX (%), 2000 AND 2011
2000
65+
15-64
M a le
Femal e
0-14
35 30 25 20 15 10 5 0 0 5 10 15 20 25 30 35
2 0 11
65+
15-64
M a le Femal e
0-14
35 30 25 20 15 10 5 0 0 5 10 15 20 25 30 35
Source: (Central Intelligence Agency n.d.)
The population is aging with more women in older age groups. From 2000 to 2011, the 65+ population increased as a share of the total
population from 5.9 to 8.7 percent. Women accounted for a larger share of the 65+ population as a percentage of the total population than
men (3.47 percent women versus 2.43 percent men). By 2011, women aged 65+ further increased their share of the total population to
4.82 percent compared to men at 3.89 percent.THE EMERGENCE AND PREDOMINANCE OF NCDS 19
FIGURE 7. INCREASING FEMALE AND MALE POPULATION IN THE 65+ AGE GROUP
Female
30,000 28,220
Male
25,000 22,772
Female
18,661
20,000
Male
15,000 13,059
10,000
5,000
0
2000 2011
Source: (Central Intelligence Agency n.d.)
TABLE 2. AGE STRUCTURE ACROSS SELECTED OECS COUNTRIES (%)
0–14 years 15–64 years 65+
2000 2011 2000 2011 2000 2011
Antigua and Barbuda 28 25.8 67 67.4 5 6.8
Dominica 29 22.9 63 66.8 8 10.3
Grenada 38 25.4 58 65.7 4 8.9
St. Kitts and Nevis 30 22.8 61 69.6 9 7.6
St. Lucia 33 22.8 62 67.5 5 9.7
St. Vincent and the Grenadines 30 24.5 63 67.4 7 8.1
Source: (Central Intelligence Agency n.d.)
Urbanization a Consequence of Demographic Transition
The OECS countries are also facing urbanization. Countries on the whole usually experience urbanization as part of the economic
development and modernization, the OECS countries are no different. What is unique about the OECS countries is that, because of their
relatively small geographic size, urbanization trends would perhaps be felt more immediately than in larger countries, due to visibly limited
resources and services. Dominica has a far larger urbanized share of population (67 percent) but this is occurring at the lowest rate among
all six countries (0.3 percent). St. Kitts and Nevis has the highest annual rate of change in urbanization (2010 to 2015 est. of 1.8 percent).
This is followed by Grenada and St. Lucia (both 1.6 percent), Antigua and Barbuda (1.4 percent), and St. Vincent and the Grenadines (1
percent) (Figure 8). Urbanization carries health risks from more crowded living conditions, congested traffic, noise, environmental pollution
and also increased emotional stress and loss of traditional family structure, which can have negative impact on health.THE GROWING BURDEN OF NON-COMMUNICABLE DISEASES IN THE EASTERN CARIBBEAN 20
FIGURE 8. URBAN POPULATION AS A PERCENTAGE OF TOTAL POPULATION, 2011
80
70 67
60
49
50
39
40
30 32
28
30
20
10
0
Antigua and Dominica Grenada St. Kitts and St. Lucia St. Vincent
Barbuda Nevis and
Grenadines
Source: (Central Intelligence Agency n.d.)
The demographic transition requires planning for an increasingly older, female, and urban population, placing stress on social and
healthcare services. With women surpassing men as a percentage of the overall population, particularly in the 65+ age group, OECS
countries face the challenge to ensure that social services are made available to reduce their vulnerabilities. The elderly are more likely
to require treatment and care for chronic diseases, which can be costly and difficult for them to access and place additional burdens on
overstretched healthcare systems. Urbanization also calls for an adequate scale-up and availability of needed social services for newly
migrating population groups. The impact of overcrowding and proximity of living environments to industry suggests a greater need for
health services and a greater need to plan appropriate prevention interventions. Finally, modern lifestyles have contributed to changing
disease patterns that need more sophisticated technology for diagnosis and treatment.
The Epidemiological Transition
The OECS countries have made significant progress in improving the health status of their populations in the past two decades. Key
demographic and health indicators compare favorably with those of developed countries: the total fertility rate is around replacement level,
there are relatively low mortality rates of infants and under-five-year-olds, and there is a low percentage of low birth weight in most of the
OECS countries (Table 3).
TABLE 3. DEMOGRAPHIC AND HEALTH INDICATORS
Antigua and Dominica Grenada St. Kitts and St. Lucia St. Vincent and
Barbuda Nevis the Grenadines
Population 90,800 73,193 103,538 49,190 170,205 109,117
Birth rate, crude (per 1,000 people) 18.1 14.9 19.4 17.3 14.0 17.6
Death rate, crude (per 1,000 people) 5.1 7.5 6.1 10.8 6.7 7.5
Infant mortality (per 1,000 live births) 18.0 9.0 13.0 14.0 13.0 12.0
Under 5 mortality per 1,000 live births 25.0 11.0 15.0 16.0 13.0 13.0
Low birth weight (%THE EMERGENCE AND PREDOMINANCE OF NCDS 21
Population ageing and economic development have shifted mortality from communicable diseases to NCDs. This shift is expected to intensify
in the next decades. Chronic, age-related illnesses become more prevalent as the demographic transition accelerates the epidemiological
transition, mortality from infections and from maternal and childhood causes of disease decreases, and the average population age increases,
(Tsounta 2009). NCDs in Caribbean countries have replaced communicable diseases, in line with other countries in the Americas, (Figure 9).
FIGURE 9. ESTIMATED MORTALITY RATES BY GROUPS OF DISEASE FOR THE AMERICAS AND ITS
MAIN SUB-REGIONS, 2002-2004
35 0
Mortal i ty rate per 100,000 i nhabi tant s
30 0
25 0
20 0
15 0
10 0
50
0
Am er ic a s Nor t h M ex ic o Central Latin Non-Latin Andean Brazil So uth e r n
Am er ic a America Caribbean Caribbean Area Cone
Co m m u n ica b l e di seases D i seases of the ci rcul atory system
M a lig n a n t n e opl asms E xternal causes
Source: (Pan American Health Organization 2007)
THE BURDEN OF NCDS IN THE OECS COUNTRIES
The OECS countries increasingly face the challenges of NCDs, which represent the major causes of death in the region. The burden of
NCDs has escalated in the OECS as a result of demographic and epidemiological transition, increasing urbanization, and population ageing
(Table 4). In 2004, NCDs accounted for 75–85 percent of total deaths in OECS countries, higher than in the low- and middle-income
countries of the Americas and even higher than the global average of 59.6 percent. Deaths attributable to communicable diseases were
only about 10 to 20 percent of the total. Across OECS countries, six out of ten leading causes of death are chronic illness. The single largest
cause of death was cardiovascular disease, accounting for roughly 30-46 percent of total deaths, followed by malignant neoplasms (10 to
20 percent) and diabetes mellitus (3 to 14 percent) (Table 5). No region in the world has higher death rates from diabetes mellitus than the
Caribbean. The prevalence of people aged 20 to 79 living with diabetes in the six OECS countries is estimated at from 7.1 percent in Antigua
and Barbuda to 11.5 percent in Dominica and there is no indication that this rate is slowing. Those three NCDs are all substantially higher
in the OECS relative to global averages as well as relative to low- and middle-income country averages in the Americas. St. Kitts and Nevis
has the highest share of deaths from cardiovascular diseases (46 percent) and the lowest percent of deaths from diabetes mellitus (3 percent)
among the six countries. The major NCDs share common underlying risk factors, such as unhealthy eating habits, obesity, physical inactivity,
tobacco and alcohol use, and an inadequate utilization of preventive health services.THE GROWING BURDEN OF NON-COMMUNICABLE DISEASES IN THE EASTERN CARIBBEAN 22
TABLE 4. BURDEN OF DISEASE IN OECS COUNTRIES: AGE STANDARDIZED DISABILITY ADJUSTED
LIFE-YEARS PER 100,000 OF POPULATION BY CAUSE
Antigua and Dominica Grenada St. Kitts St. St. Vincent and the
Barbuda and Lucia Grenadines
Nevis
All causes* 16,511 16,395 20,810 18,234 16,329 20,278
Communicable diseases 2,103 2,317 3,582 3,227 2,109 4,128
NCDs Selected causes 12,871 12,798 15,601 13,433 11,856 13,828
Malignant 1,363 1,768 2,136 1,073 1,333 1,655
neoplasms
Diabetes mellitus 869 629 784 506 915 1,301
Endocrine 694 303 – 672 400 376
disorders
Neuropsychiatric 3,554 4,141 3,626 3,713 3,609 3,674
conditions
Cardiovascular 2,616 2,117 4,065 3,569 1,849 2,804
diseases
Respiratory 750 646 1,169 530 782 833
diseases
Digestive diseases 654 691 1,199 702 573 700
Genitourinary 214 241 437 414 200 241
diseases
Percentage of NCDs 78% 78% 75% 74% 73% 68%
Data source: WHO 2004
* Communicable diseases, NCDs, and injuries
TABLE 5. LEADING CAUSES OF DEATH IN OECS COUNTRIES, 2004
(% OF TOTAL DEATHS, AGE ADJUSTED)
Leading Cause of Death Antigua and Dominica Grenada St. Kitts and St. St. Vincent and Global America low
Barbuda Nevis Lucia the Grenadines and middle
income
Cardiovascular disease 36.29 34.85 41.13 46.44 31.20 32.09 29.0 28.49
Malignant neoplasms 19.60 23.99 18.00 11.88 19.51 16.83 12.6 15.50
Diabetes mellitus 11.11 7.50 6.68 3.16 13.45 13.97 1.9 4.99
Infectious and parasitic 5.73 5.35 6.69 7.66 3.76 9.26 16.2 8.02
disease
Digestive disease 5.15 5.13 4.23 4.48 4.08 3.77 3.5 6.03
Unintentional injuries 4.29 2.42 3.73 3.46 5.38 4.21 6.6 6.23
Respiratory infections 3.32 3.29 5.28 7.70 3.02 3.60 7.2 5.57
Respiratory disease 2.62 3.56 2.47 1.32 4.12 2.40 6.9 6.06
Genitourinary disease 2.15 1.96 3.30 3.53 1.78 1.20 1.6 2.45
Perinatal conditions 1.70 2.32 2.42 2.42 2.72 3.05 5.4 3.83
Data source: (WHO 2008)
Leading causes of death are similar among men and women in OECS countries with mortality from cardiovascular diseases and diabetes
being higher for women. Deaths attributed to cardiovascular diseases and diabetes mellitus are higher among women than among men in all
six OECS countries. Compared with the global average of 31.5 percent for women and 26.8 percent for men, cardiovascular disease deaths in
OECS member countries are much higher for both women and men at 40 and 33 percent of the total, respectively (Figure 10).THE EMERGENCE AND PREDOMINANCE OF NCDS 23
FIGURE 10. THREE LEADING CAUSES OF DEATH BY OECS COUNTRIES AND GENDER, 2004 (% OF TO-
TAL DEATHS, AGE ADJUSTED)
60%
50%
40%
30% Male Cardiovascular diseases
20% Male Malignant neoplasms
10% Male Diabetes mellitus
0% Female Cardiovascular diseases
Female Malignant neoplasms
Female Diabetes mellitus
Data source: (WHO 2008)
NCDs represent a growing portion of health spending and impose a large economic burden at the societal, community, and household
levels. The costs of NCDs include direct costs of individual health spending as well as indirect loss of earnings in addition to the economic
burden to families, communities, and private and public healthcare systems. Chapter 5 deals with these in some detail. In addition, NCDs
cause lost productivity and reduced economic growth from lost earnings, lost work days, restricted activity days, lower productivity at work,
mortality, and permanent disability.
The lack of effective financial protection from illness further compounds the challenges to the health system. More than half of the
total of healthcare services in OECS countries (ranging from 49 to 69 percent) was financed by governments in 2007. Private expenditure is
mostly made up of out-of-pocket payments (ranging from 84 to 100 percent), complemented by a very small commercial insurance sector.
Spending on health ranges from 4.6 to 7 percent of GDP. Expressed in purchasing power parity, the total expenditure on health per capita
varies from $457 to $964 (Table 6). Antigua and Barbuda and St. Kitts and Nevis have the highest incomes and lowest rates of poverty and
unemployment while Dominica and St. Vincent and the Grenadines, with the lowest income, have higher rates. Inequity in all six OECS
countries is rather high, indicated by a Gini coefficient around 0.45 but slightly higher in Antigua and Barbuda at 0.52.
TABLE 6. HEALTHCARE FINANCING OECS COUNTRIES (LATEST YEAR AVAILABLE)
Antigua Dominica Grenada St. Kitts St. St. Vincent
and and Nevis Lucia and the
Barbuda Grenadines
Total expenditure on health as % of GDP 4.6 6.2 7.0 6.0 6.8 4.9
External resources on health as % of total expenditure on health 0.0 0.5 0.0 0.0 0.0 0.0
General government expenditure on health as % of total 69.1 62.5 48.9 57.9 58.8 61.3
expenditure on health
General government expenditure on health as % of General 11.0 8.2 8.0 8.0 10.8 7.0
government expenditure
Out-of-pocket expenditure as % of private expenditure on health 87.2 84.2 97.4 94.4 94.6 100.0
Total expenditure on health per capita at purchasing power parity 964.0 584.0 619.0 959.0 677.0 457.0
(National Currency Units per US$)
General government expenditure on health per capita at 666.0 365.0 303.0 555.0 398.0 280.0
purchasing power parity (National Currency Units per US$)
Data source: WHO. Latest year availableTHE GROWING BURDEN OF NON-COMMUNICABLE DISEASES IN THE EASTERN CARIBBEAN 24
NCDs account for more than 70 percent of years of life lost in the OECS countries. The global average for years of life lost is less than 50
percent and the low- and middle-income countries average in the Americas is roughly 60 percent. The total disease and injury burden is
estimated to be between 9,000 and 25,000 disability-adjusted life-year (160–200 per 1,000 people) in OECS countries (Figure 11). Grenada
and St. Vincent and the Grenadines suffer from the highest burden of disease attributable to all causes while St. Lucia and Dominica are
among the lowest. Neuropsychiatric conditions become the leading cause of disease burden in all six countries, ranging from as low as 23.2
percent in Dominica to as high as 30.4 percent in St. Lucia. The next largest category of burden of disease is cardiovascular disease (15 to 20
percent) and malignant neoplasms (7 to 14 percent), similar to estimates globally and for low- and middle-income countries of the Americas.
FIGURE 11. DISTRIBUTION OF DISABILITY ADJUSTED LIFE-YEARS BY NCDS AND OECS COUNTRIES,
2004 (% IN TOTAL DISABILITY-ADJUSTED LIFE-YEARS, AGE ADJUSTED)
90%
80% Oral conditions
70% Congenital anomalies
60%
Musculoskeletal diseases
50%
40% Skin diseases
30% Genitourinary diseases
20% Digestive diseases
10%
0% Respiratory diseases
Cardiovascular diseases
Sense organ diseases
Neuropsychiatric conditions
Endocrine disorders
Diabetes mellitus
Other neoplasms
Malignant neoplasms
Data source: (WHO 2008)
The predominance of NCDs in the OECS countries that have been identified in this chapter indicate an urgent need to fully understand the risk factors
directly responsible for causing them; these are therefore considered in the next chapter.THE EMERGENCE AND PREDOMINANCE OF NCDS 25
THE GROWING BURDEN OF NON-COMMUNICABLE DISEASES IN THE EASTERN CARIBBEAN                              26

III. RISK FACTORS                                             Key Messages
CONTRIBUTING TO
THE BURDEN OF                                            1.   There is ample evidence in the region of high levels
                                                              of the four main preventable behavioral risk factors
DISEASE                                                       that lead to NCDs: unhealthy diet, physical inactivity,
                                                              smoking, and harmful use of alcohol.

                                                         2.   Overweight or obesity and physical inactivity levels
The most common high-risk factors that                        are higher among women than men in the OECS
                                                              countries.
contribute to NCDs are few and highly
                                                         3.   Limited data on tobacco use and alcohol consumption
preventable. This chapter evaluates the                       in the OECS countries indicate a disturbing trend of
                                                              tobacco and alcohol use among youth.
relative burden from these behavioral
factors in the OECS countries, namely
tobacco use, physical inactivity, alcohol
abuse, and unhealthy diet.
RISK FACTORS CONTRIBUTING TO THE BURDEN OF DISEASE 27
This report assesses the four most common preventable behavioral risk factors (tobacco use, physical inactivity, alcohol abuse, and
unhealthy diet) for NCDs in the six OECS countries. The WHO estimates that by 2020 the number of people dying annually from tobacco use
will increase to 7.5 million and account for 10 percent of all deaths. Smoking prevalence is the highest in low- and middle-income countries.
People who are insufficiently physically active have a 20 to 30 percent increased risk of mortality from all causes. Approximately 2.3 million
people die each year from the harmful use of alcohol that accounts for about 3.8 percent of all deaths in the world. Unhealthy diet is rising
quickly in lower-resourced settings; data suggest that since the 1980s fat intake has been rising rapidly in low-middle-income countries.
Unhealthy diet and physical inactivity contribute to the epidemic of overweight people and obesity in the OECS, which in turn causes various
NCDs.
Over 84 percent of the total global burden of disease occurs in low- and middle-income countries and on their poorer populations,
reflecting the underlying socio-economic determinants of NCDs (WHO 2010). In 2009, the major four risk factors together accounted for
over three-quarters of ischemic heart diseases – the leading cause of death worldwide. If the risk factors were reduced, global life expectancy
could go up by almost 5 years (WHO 2009).
OBESITY
Overweight people and obesity are steadily increasing in all OECS countries; women are affected more than men and there is a rising trend
of obesity in children. WHO and FAO data confirm that there has been a change in the nutritional profile with a shift from undernourishment
to being overweight and obesity among children in all six OECS countries. In the last decade, Dominica has had the highest obesity prevalence
in both gender groups in the region. About 38.4 percent of males and 65.3 percent of females are estimated to be obese by 2015. Obesity is
also high among females in St. Lucia – it is estimated that by 2015 almost 60 percent of them will be obese. The male group in St. Lucia has
the lowest obesity rates in the region although this has been increasing since the 2002 baseline. Antigua and Barbuda and St. Kitts and Nevis
have seen similar trends and levels of obesity in both gender groups over the period 2002–15 (WHO, Global Database on BMI n.d.). It has
also been reported that preschool rates of obesity in the Caribbean region are as high as in the United States (Gardner 2009). Diabetes and
hypertension associated with obesity are among the leading causes of morbidity and mortality in almost all countries in the region
Figure 12 and 13 present OECS country-data on overweight and obesity levels respectively, using the WHO international classification
that sets the principal cut-off points for being overweight and obese at a BMI (kg/m²) of ≥ 25.00 and ≥30.00 respectively and WHO projections
for 2015 are included (WHO, Global Database on BMI n.d.). These statistics cover the adult population of 30 years and older. Dominica has
the highest prevalence of overweight people in both gender groups 3. St. Lucia comes second in the region overall, with the highest prevalence
of overweight females. The prevalence of overweight men in St. Lucia is the lowest in the region, however, giving St. Lucia the widest gender
gap. St. Vincent and the Grenadines shows relatively stable overweight levels during the study period (2002–15), averaging 56.6 percent of
men and 64.1 percent of women in the overweight category. St. Kitts and Nevis shows the second highest prevalence of overweight males
after Dominica. In 2002, the lowest overweight figures for males were in St. Lucia (44.7 percent) while for females the lowest figures were
found in St. Vincent and the Grenadines (61.2 percent). It is estimated that by 2015 St. Vincent and the Grenadines will have the lowest
prevalence of overweight people in both gender groups.
3 Data based on the STEPwise approach to surveillance chronic non communicable diseases risk factor surveys, 2007–2009 provides lower obesity rates for
Dominica, i.e. 9 for males and 33 for females in a sample of 1,059 householdsTHE GROWING BURDEN OF NON-COMMUNICABLE DISEASES IN THE EASTERN CARIBBEAN 28
BOX 1: OBESITY
Obesity is the “disease in which excess body fat has accumulated to such an extent that it adversely affects the health”. However, the
amount of excess fat and its distribution within the body as well as the health consequences vary substantially among obese individuals.
The WHO classified the Body Mass Index (BMI) as a simple index of weight-for-height commonly used to classify underweight, overweight
and obesity in adults. It is defined as the weight in kilograms divided by the square of the height in meters (kg/m²)4.
The International Classification of adult underweight, overweight and obesity according to BMI
Classification BMI(kg/m2)
Principal cut-off points Additional cut-off point
UnderweightRISK FACTORS CONTRIBUTING TO THE BURDEN OF DISEASE 29
FIGURE 12. PREVALENCE OF OVERWEIGHT PEOPLE IN THE OECS COUNTRIES
Adult (30-100 y.o.) overweight (BMI ≥ 25 kg/m²) prevalence rate
100
Prevalence (%)
80
60
40
20
0
Males Females Males Females Males Females Males Females
2002 2002 2005 2005 2010 2010 2015 2015
Antigua and Barbuda Dominica Grenada
St. Lucia St. Kitts and Nevis St. Vincent and Grenadines
Source: (WHO, Global Database on BMI n.d.)
FIGURE 13. PREVALENCE OF OBESITY IN THE OECS COUNTRIES
Adult (30-100 y.o.) obesity (BMI ≥ 30 kg/m²) prevalence rate
70
60
50
Prevalence (%)
40
30
20
10
0
Males Females Males Females Males Females Males Females
2002 2002 2005 2005 2010 2010 2015 2015
Antigua and Barbuda Dominica Grenada
St. Lucia St. Kitts and Nevis St. Vincent and Grenadines
Source: (WHO, Global Database on BMI n.d.).
Obesity is one of the important risk factors for hypertension that together with diabetes are placing the increasing demand for services
and financial burden on the health systems of the OECS countries. The majority of the studies considers the increasing trend of diabetes
to be a direct result of the increasing prevalence of obesity and overweight following the population’s unhealthy diets and lack of physical
activity. Poor dietary habits also affect the healthy weight of children. Socio-economic factors are another contributor: surveys reveal that
the risk factors in people of higher socio-economic status diminish with time but they remain high in those of lower socio-economic status.
With modernization, the establishment of a cash economy, and the abandonment of traditional food sources, the least expensive foods are
usually highly refined and high in calories; one should therefore remember that there is a correlation between the preference for unhealthy
foods and affordability (Madrigal 2006).THE GROWING BURDEN OF NON-COMMUNICABLE DISEASES IN THE EASTERN CARIBBEAN 30
PHYSICAL INACTIVITY
Physical inactivity levels are high across the region, particularly among females. Growing urbanization and sedentary lifestyles give
rise to the problem of physical inactivity. Physical inactivity is the fourth leading risk factor of global mortality accounting for 6 percent of
deaths. Other three leading risk factors are hypertension (13 percent), tobacco use (9 percent), and high blood glucose (also 6 percent). The
number of people who are physically inactive, as well as the degrees of inactivity, are on the increase. WHO estimates that physical inactivity
is the principal cause of approximately 21–25 percent of breast and colon cancers, 27 percent of diabetes, and approximately 30 percent of
ischemic heart disease. It is proven that regular physical activity reduces the risk of coronary heart disease and stroke, diabetes, hypertension,
colon cancer, breast cancer, and depression. Physical activity is also a key feature of weight control. Some key WHO recommendations on
physical activity are provided in the Appendix 1 to the report (WHO, Global Recommendations on Physical Activity for Health 2010).
The populations of the OECS countries are insufficiently active physically across all age groups. In 2007, 25.5 percent of people in
Dominica (14.9 percent of males and 36.2 percent of females) were identified as being insufficiently physically active5, whereas in St. Kitts
and Nevis the rates were 40.6 percent (32.2 percent and 49 percent respectively (WHO 2010).
Figures 14 and 15 provide figures on the levels of physical activity in St. Lucia and St. Vincent and the Grenadines of adolescents between
13 and 15 years of age. The data for St. Lucia shows relatively high physical inactivity among students between 13 and 15 years of age in
2006. On average, adolescents spent 79.5 percent of their time insufficiently active, 55.1 percent spent 3 or more hours per day sitting and
73.6 percent used means of transport other than walking or biking (WHO risk factors database n.d.). In St. Kitts and Nevis, 32.2 percent of
males and 49 percent of females were reported insufficiently active in 2008. The 2007 survey among 13-15 year old students in St. Vincent
and the Grenadines identified that they had spent about 85.1 percent of their time being inadequately active (or inactive), 40.3 percent of
their time sitting for 3 or more hours and 63.3 percent of time being inactive in transport (WHO, Global Status Report on Non-Communicable
Diseases 2008).
FIGURE 14. ST. LUCIA – PREVALENCE OF PHYSICAL INACTIVITY AMONG THE 13–15 AGE GROUP IN
2006
90
77.4 81.1 76.6
80
70 69.8
60
56.5 54
Percent
50
40
30
20
10
0
leisure time, inadequately active leisure time, other,
transport, other, not walk or bike
(including inactive), occasion spent 3 or more hours sitting
Males Females Males Females Males Females
2006 2006 2006 2006 2006 2006
Source: (WHO risk factors database n.d.)
5 WHO crude adjusted estimatesYou can also read