The GALAH survey: accreted stars also inhabit the Spite plateau
←
→
Page content transcription
If your browser does not render page correctly, please read the page content below
MNRAS 507, 43–54 (2021)                                                                                         https://doi.org/10.1093/mnras/stab2012
Advance Access publication 2021 July 15

The GALAH survey: accreted stars also inhabit the Spite plateau
Jeffrey D. Simpson ,1,2‹ Sarah L. Martell ,1,2 Sven Buder ,2,3 Joss Bland-Hawthorn ,2,4
Andrew R. Casey ,2,5 Gayandhi M. De Silva,6,7 Valentina D’Orazi,8 Ken C. Freeman,2,3
Michael Hayden,2,4 Janez Kos,9 Geraint F. Lewis ,4 Karin Lind,10 Katharine J. Schlesinger,3
Sanjib Sharma ,2,4 Dennis Stello,1,2,4 Daniel B. Zucker,2,7,11 Tomaž Zwitter ,9 Martin Asplund,12
Gary Da Costa ,2,3 Klemen Čotar,9 Thor Tepper-Garcı́a,2,4,13 Jonathan Horner ,14
Thomas Nordlander ,2,3 Yuan-Sen Ting,3,15,16,17 and Rosemary F. G. Wyse 18
(The GALAH Collaboration)

                                                                                                                                                         Downloaded from https://academic.oup.com/mnras/article/507/1/43/6321839 by guest on 30 November 2021
Affiliations are listed at the end of the paper

Accepted 2021 July 5. Received 2021 July 4; in original form 2021 May 23

ABSTRACT
The European Space Agency (ESA) Gaia mission has enabled the remarkable discovery that a large fraction of the stars
near the solar neighbourhood are debris from a single in-falling system, the so-called Gaia-Sausage-Enceladus (GSE). This
discovery provides astronomers for the first time with a large cohort of easily observable, unevolved stars that formed in a
single extragalactic environment. Here we use these stars to investigate the ‘Spite plateau’ – the near-constant lithium abundance
observed in unevolved metal-poor stars across a wide range of metallicities (−3 < [Fe/H] < −1). Our aim is to test whether
individual galaxies could have different Spite plateaus – e.g. the interstellar medium could be more depleted in lithium in a
lower galactic mass system due to it having a smaller reservoir of gas. We identified 93 GSE dwarf stars observed and analysed
by the GALactic Archaeology with HERMES (GALAH) survey as part of its Data Release 3 (DR3). Orbital actions were used
to select samples of GSE stars, and comparison samples of halo and disc stars. We find that the GSE stars show the same
lithium abundance as other likely accreted stars and in situ Milky Way stars. Formation environment leaves no imprint on lithium
abundances. This result fits within the growing consensus that the Spite plateau, and more generally the ‘cosmological lithium
problem’ – the observed discrepancy between the amount of lithium in warm, metal-poor dwarf stars in our Galaxy, and the
amount of lithium predicted to have been produced by big bang nucleosynthesis – is the result of lithium depletion processes
within stars.
Key words: stars: abundances – Galaxy: evolution – Galaxy: halo.

                                                                                  There has long been tension between the BBN-predicted primor-
1 I N T RO D U C T I O N
                                                                               dial abundance of 7 Li and the abundance measured in warm, metal-
7
  Li is one of the four stable nuclides (along with 2 H, 3 He, and 4 He)       poor dwarf stars of our Galaxy. These stars have thin convective
that are predicted by big bang nucleosynthesis (BBN) to have been              layers, and models predict they formed from gas that had a (near-)
synthesized during the first minutes of the Universe (a theory first           primordial Li abundance, and they will retain this formation Li abun-
proposed by Alpher, Bethe & Gamow 1948, see recent reviews of                  dance in their photosphere (Deliyannis, Demarque & Kawaler 1990).
BBN from Cyburt et al. 2016; Fields et al. 2020). In the standard              As first identified by Spite & Spite (1982a,b), and subsequently
model of BBN, the amounts of these primordial abundances formed                confirmed (e.g. Bonifacio & Molaro 1997; Ryan, Norris & Beers
are strongly dependent on the baryon-to-photon ratio, which can be             1999; Asplund et al. 2006; Meléndez et al. 2010; Sbordone et al.
estimated from the cosmic microwave background. Observations in                2010), across a large range of metallicity (−3 < [Fe/H] < −1) these
astrophysical environments have measured abundances that are in                stars do have a near-constant Li abundance creating the so-called
agreement with BBN predictions (Fields et al. 2020), i.e. 2 H from             ‘Spite plateau’. But, the Spite plateau abundance is 3–4 times lower
quasar spectra (e.g. Cooke, Pettini & Steidel 2018), 4 He from metal-          than 7 Li abundance predicted by BBN. This discrepancy is known as
poor extragalactic H II regions (e.g. Aver, Olive & Skillman 2015),            the ‘cosmological lithium problem’ (see the review by Fields 2011).
7
  Li in low-metallicity gas in the Small Magellanic Cloud (Howk                   The concordance of the predictions from BBN and the observed
et al. 2012) – though the latter is dependent on the chemical evolution        abundances for the 2 H, 3 He, and 4 He nuclides means that it is not
model.                                                                         BBN at fault. There is a growing consensus that the Li depletion
                                                                               in these stars is from extra mixing below the convection zone due
                                                                               to rotation (e.g. Deliyannis et al. 1990; Pinsonneault, Deliyannis &
   E-mail: jeffrey.simpson@unsw.edu.au                                        Demarque 1992), diffusion and turbulent mixing (e.g. Michaud &


C 2021 The Author(s)

Published by Oxford University Press on behalf of Royal Astronomical Society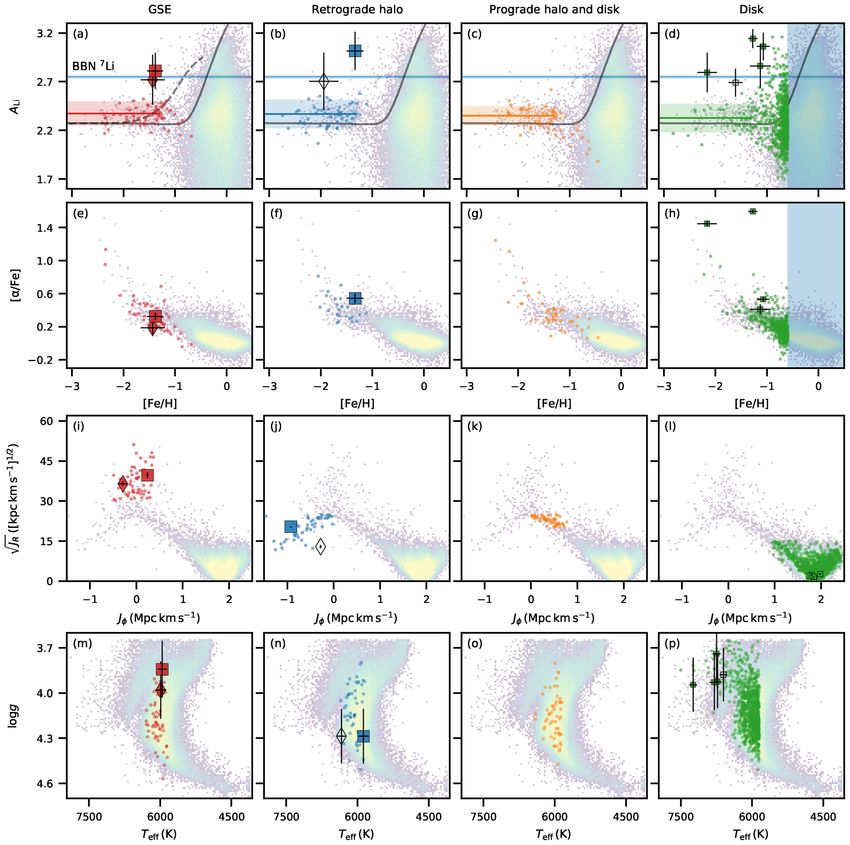
44       J. D. Simpson et al.
Charbonneau 1991; Richard 2012), and internal gravity waves (e.g.                2019; Naidu et al. 2020). Gaia-Sausage-Enceladus (GSE) presents
Charbonnel & Talon 2005).                                                        the exciting prospect of a large number of main-sequence stars from a
   In this work, we investigate an alternative hypothesis to explain the         single dwarf galaxy that can be readily observed with current ground-
Spite plateau: that observable metal-poor dwarf stars simply did not             based telescopes. These stars have a relatively unique kinematic
form with a near-primordial lithium abundance. The Spite plateau                 signature – eccentric orbits with low angular momenta – making
could be the result of pre-processing of interstellar medium through             them easy to distinguish from other halo stars. For moderately metal-
previous generations of stars, as proposed by e.g. Piau et al. (2006).           poor members ([Fe/H] ≥ −1.3) they can also be chemically tagged
This raises the question that we wish to answer: Does the stellar                as coming from the GSE due to their low [α/Fe] compared to in situ
formation environment affect the Spite plateau?                                  stars (Nissen & Schuster 2010; Helmi et al. 2018; Monty et al.
   Unfortunately, it is not practical to measure the lithium abun-               2020).
dance of dwarf stars in external galaxies with the current suite of                 Previous studies have looked at lithium in the GSE stars. Nissen &
telescopes.1 Fortunately, it is thought that a sizeable fraction of the          Schuster (2012) measured the lithium abundances of 25 stars in their
Galactic halo stars were accreted (e.g. Ibata, Gilmore & Irwin 1994;             low-α halo sequence – which we now know to be GSE – finding

                                                                                                                                                          Downloaded from https://academic.oup.com/mnras/article/507/1/43/6321839 by guest on 30 November 2021
Helmi et al. 1999; Ibata et al. 2004; Abadi et al. 2010; Starkenburg             no significant systematic difference in the lithium abundances of
et al. 2017, and reviews by Bland-Hawthorn & Gerhard 2016; Helmi                 high- and low-α stars. Molaro, Cescutti & Fu (2020) and Cescutti,
2020), with the accepted paradigm for the growth of galaxies like                Molaro & Fu (2020) both looked at lithium in 39 GSE stars using
our Milky Way featuring the hierarchical mergers of large galaxies               abundances from literature compilations. They found that the Spite
with smaller dwarf galaxies (e.g. Searle & Zinn 1978; White & Frenk              plateau in GSE to be the same as in the rest of the Milky Way.
1991; Cole et al. 2002; Venn et al. 2004; Oser et al. 2010). These                  In this work, we expand upon those results, presenting the lithium
dwarf galaxies are completely disrupted and are mixed throughout                 abundance of 93 GSE dwarf stars serendipitously observed and
the Galactic halo.                                                               homogeneously analysed as part of the Third Data Release (Buder
   Until recently, globular clusters provided the only dwarf stars               et al. 2021) of the GALactic Archaeology with HERMES survey
that could be easily identifiable as being born ex situ that are                 (GALAH; De Silva et al. 2015). GALAH is a massive spectroscopic
observationally accessible. For instance, dwarf stars in ω Cen show              survey of the local Galactic volume, and we explore whether the
lithium abundances consistent with field stars (Monaco et al. 2018).             lithium abundances of GSE stars are consistent with the abundances
Using models of diffusion to estimate their initial abundances,                  of other Galactic populations with likely in situ and ex situ origins.
Mucciarelli et al. (2014) observed giant stars in M54, finding                   We test the hypothesis that the Spite plateau is not the result of
the Galactic Spite plateau value. We do note two complications                   galactic chemical evolution.
with globular clusters: first, the question of which globulars are                  This work is structured as follows. Section 2 describes the
accreted and which formed in situ is an active area of research                  observation, reduction, and analysis. Section 3 considers how lithium
(e.g. Forbes & Bridges 2010; Massari, Koppelman & Helmi 2019;                    abundances change with stellar properties. Section 4 explains how
Horta et al. 2020; Keller et al. 2020); and secondly, the observa-               the GSE stars were selected. Section 5 compares and contrasts the
tions that the first and second generations of stars have the same               Spite plateau for various subsamples of Milky Way stars. Section 6
lithium abundances, despite the latter stars forming from material               comments on a handful of very Li-rich metal-poor stars. Section 7
processed through the former (see discussion in the review by Gratton            summarizes the paper.
2020).
   Now, thanks to the combination of deep photometric surveys and
the data contained in the Second Data Release of the European Space
                                                                                 2 O B S E RVAT I O N , R E D U C T I O N , A N D
Agency (ESA) Gaia mission (Gaia Collaboration et al. 2016, 2018),
                                                                                 A N A LY S I S
it has been shown that the halo of the Galaxy contains spatial and
kinematic substructure – the identifiable remnants of past accretion             The spectroscopic data used in this work come from the 588 571
events (Ibata et al. 2018; Malhan, Ibata & Martin 2018; Yan et al.               stars of the Data Release 3 (DR3) of the GALAH survey (Buder
2018; Barbá et al. 2019; Myeong et al. 2019; Borsato, Martell &                 et al. 2021) – the combination of GALAH survey (De Silva et al.
Simpson 2020; Naidu et al. 2020; Yuan et al. 2020, and see the review            2015; Martell et al. 2017; Buder et al. 2018), the K2-HERMES
by Helmi 2020). Some stars of the >50 known ‘stellar streams’ (see               survey (Wittenmyer et al. 2018; Sharma et al. 2019), and the TESS-
Mateu, Read & Kawata 2018, and references therein) have been                     HERMES survey (Sharma et al. 2018). All observations used the
spectroscopically observed (e.g. Ibata, Malhan & Martin 2019; Li,                HERMES spectrograph (Sheinis et al. 2015) and the 2-degree Field
Wang & Milone 2019; Ji et al. 2020; Li et al. 2020; Simpson et al.               (2dF) fibre positioning system (Lewis et al. 2002) at the 3.9-m Anglo-
2020). For the S2 stream, the likely result of a disrupted dwarf galaxy,         Australian Telescope. HERMES records ∼1000 Å of the optical
Aguado et al. (2021) measured the lithium abundance for a handful                spectrum at a spectral resolution of R ≈ 28 000 across four non-
of dwarf stars and found the lithium behaviour to be like that of the            contiguous sections, which includes the neutral Li resonance lines at
rest of the halo.                                                                6708 Å. The spectra were reduced with a custom IRAF pipeline (Kos
   On a larger scale, a significant proportion of the halo stars near            et al. 2017).
the Sun appear to have been accreted from a single dwarf galaxy                     All stellar parameter and abundance values in this work are
(e.g. Nissen & Schuster 2010; Belokurov et al. 2018; Haywood                     from Buder et al. (2021), with the lithium abundance for each star
et al. 2018; Helmi et al. 2018; Myeong et al. 2018a,b; Fattahi et al.            determined from synthesis of the 6708 Å Li line and includes non-
                                                                                 local thermodynamic equilibrium (LTE) corrections. In this work,
                                                                                 we use the form ALi = log [nLi /nH ] + 12, where nLi and nH are
1 In the future it will be possible, e.g. GMT-Consortium Large Earth Finder      the number densities of lithium and hydrogen, respectively. On this
(G-CLEF) on the Giant Magellan Telescope will be able to acquire in 1.5 h R      scale, the BBN prediction is ALi = 2.75 ± 0.02 (Pitrou et al. 2018).
≈ 23 000 spectra of signal-to-noise ratio ∼10 for the brightest turn-off stars   Examples of HERMES spectra of dwarf stars for the region around
in the Large Magellanic Cloud.                                                   6708 Å are shown in Fig. 1. Qualitatively, these spectra confirm the

MNRAS 507, 43–54 (2021)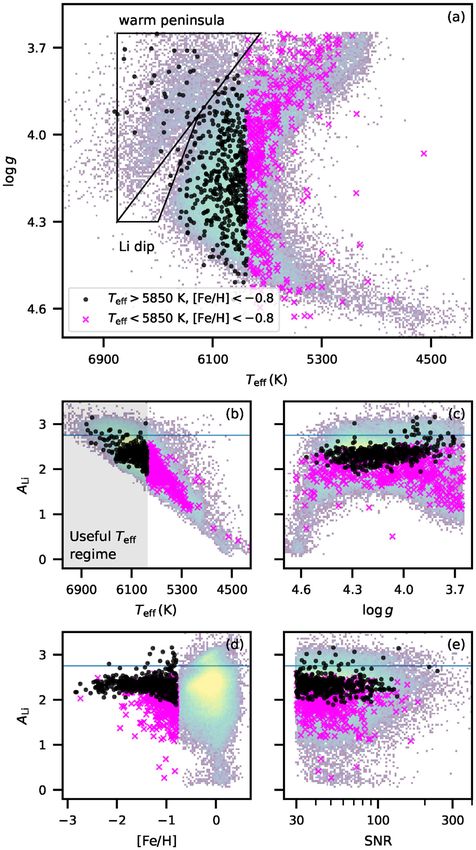
Extragalactic lithium problem                   45
                                                                                       The Galactic orbital properties of each star are taken from
                                                                                    Buder et al. (2021). Briefly, this used GALPY (Bovy 2015) with
                                                                                    values from GALAH DR3 and Gaia EDR3, MCMILLAN2017 po-
                                                                                    tential (McMillan 2017) and the values RGC = 8.21 kpc and
                                                                                    vcircular = 233.1 km s−1 (Gravity Collaboration et al. 2019). It set
                                                                                    (U , V , W ) = (11.1, 15.17, 7.25) km s−1 in keeping with Reid &
                                                                                    Brunthaler (2004) and Schönrich, Binney & Dehnen (2010). Dis-
                                                                                    tances are primarily from the GALAH DR3 age and mass value-
                                                                                    added catalogue, which mostly incorporated distances found by the
                                                                                    Bayesian Stellar Parameters estimator (BSTEP; described in Sharma
                                                                                    et al. 2018).

                                                                                    3 E F F E C T S O F S T E L L A R P RO P E RT I E S O N

                                                                                                                                                               Downloaded from https://academic.oup.com/mnras/article/507/1/43/6321839 by guest on 30 November 2021
                                                                                    L I T H I U M A B U N DA N C E S
                                                                                    Lithium is a fragile element in stars. Along with Be and B (see
                                                                                    the review of Randich & Magrini 2021) it is easily destroyed in
                                                                                    stellar interiors at a relatively low temperature (2.6 × 10⁶ K for
                                                                                    Li; Gamow & Landau 1933; Salpeter 1955). This destruction is
                                                                                    observed in the Sun: the solar photospheric lithium abundance is
                                                                                    ALi = 1.05 ± 0.01, while the meteoritic lithium abundance is
                                                                                    3.26 ± 0.05 (Asplund et al. 2009). Li burning will occur in stars
                                                                                    whenever there is the ability to transport surface material to the
                                                                                    hotter interior. There are various stellar atmospheric processes – the
                                                                                    convective zone, atomic diffusion (e.g. Michaud & Charbonneau
                                                                                    1991; Richard 2012), rotation-induced mixing (e.g. Deliyannis et al.
                                                                                    1990; Pinsonneault et al. 1992), and internal gravity waves (e.g.
                                                                                    Charbonnel & Talon 2005) – competing to both drive and inhibit this
                                                                                    mixing. The dominant mechanism depends on the mass, metallicity,
                                                                                    and evolutionary stage of the star. For this work it is necessary
                                                                                    to identify stars that are the least affected by Li depletion, and
                                                                                    therefore their current Li abundance is most representative of their
                                                                                    birth abundance.
                                                                                       Fig. 2 shows the 86 320 dwarf stars from our sample with
                                                                                    reliable lithium abundance (e.g. ) in the Teff –log g plane, and their
                                                                                    ALi with respect to Teff , log g, [Fe/H], and signal-to-noise in the
Figure 1. Pseudo-continuum normalized HERMES spectra for the Li 6708 Å              HERMES spectra. The coolest stars, with the highest and lowest
region (shaded blue band). In each panel there are up to 10 randomly                log g in the sample, likely experienced a large amount of surface
chosen stars in a narrow [Fe/H] range (as indicated on each panel) from             lithium depletion and form ‘tails’ of low ALi in Fig. 2(c). The
a representative region of the Teff –log g space for dwarf stars (5975 < Teff       hottest stars retain most of their formation lithium because they
< 6175 K and 4.0 < log g < 4.4). The purple shaded band is the Fe 6718 Å            have thin convective zones and are nearly unaffected by either
line seen to weaken with decreasing metallicity. There is little variation in the   rotation-induced mixing or diffusion. Seen in Fig. 2(a) as the ‘warm
strength of the lithium line in a given metallicity bin, qualitatively confirming   peninsula’, these stars also form the overdensity of roughly solar
the presence of the Spite plateau.                                                  metallicity stars with ALi ∼ 3 in Fig. 2(d). Meanwhile for stars in
                                                                                    the range 6400 < Teff < 6850 K, rotation-induced mixing is the
existence of the Spite plateau – i.e. at a given [Fe/H] and Teff there is           dominant mechanism, causing severe lithium destruction and the so-
little variation in the strength of the lithium line.                               called ‘lithium dip’ (a feature first observed in open clusters; e.g.
    We apply data quality selections to identify a sample of dwarf                  Wallerstein, Herbig & Conti 1965; Boesgaard et al. 2016). This Li
stars (defined as surface gravity log g > 3.65 and absolute G                       dip manifests as the region of the Teff –log g diagram lacking in almost
magnitude >1.5) with reliable stellar parameters and abundances.                    any stars with reliable lithium measurements. The Li dip and ‘warm
For each star we require: (i) GALAH DR3 flag flag sp = 0 and                        peninsula’ are explored in detail using GALAH data by Gao et al.
flag fe h = 0 (no problems noted in the input data, reduction,                      (2020).
analysis, or iron abundance determination); (ii) a five-parameter solu-                For investigating the Spite plateau, as has been done previously
tion from Gaia Early Data Release 3 (EDR3; Gaia Collaboration et al.                in the literature (e.g. Meléndez et al. 2010), we want to identify a
2021) to allow for orbital calculations; (iii) the red camera spectrum              stellar parameter selection that includes only those stars hot enough
(which contains the Li line) signal-to-noise ratio >30 pixel−1 . These              to inhibit significant Li depletion, whilst simultaneously maximizing
selections identify the set of 197 921 dwarf stars that we consider for             our sample size of metal-poor stars. Experimentation identified a
the remainder of this work. When we are considering the abundance                   temperature cut-off of Teff > 5850 K as the best compromise between
of element x, we also require that the GALAH flag flag x fe = 0                     selecting those stars least affected by Li depletion, and retaining
(no problems noted in the abundance determination). For instance,                   a large sample of stars. In Fig. 2, we highlight stars with [Fe/H]
of the 197 921 dwarf stars, 86 320 dwarf stars with reliable lithium                < −0.8 (i.e. the metallicity range of halo stars): black dots for
abundances.                                                                         stars with Teff > 5850 K, and fuchsia crosses for stars below this

                                                                                                                              MNRAS 507, 43–54 (2021)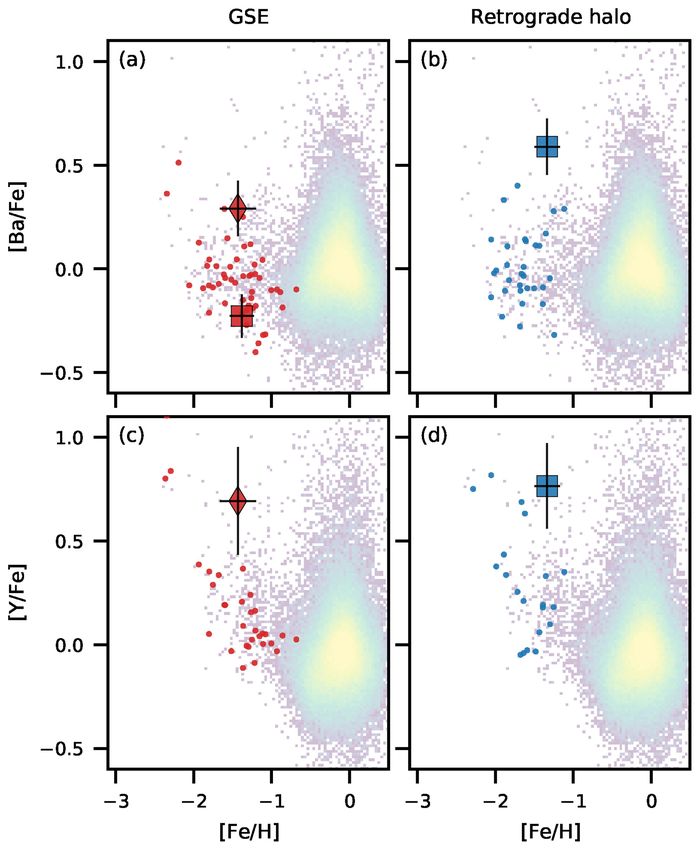
46       J. D. Simpson et al.

                                                                                                                                                                    Downloaded from https://academic.oup.com/mnras/article/507/1/43/6321839 by guest on 30 November 2021
                                                                                  Figure 3. The √  cumulative metallicity distribution functions (CDFs) for bins
                                                                                  of stars in Jφ – JR action space. Panel (a) shows√the log-density number
                                                                                  distribution of all GALAH DR3 dwarf stars in Jφ – JR action space, along
                                                                                  with the location of the bins used for each CDF. Panels (b) and (c) show,
                                                                                  respectively, the CDF for the retrograde (odd-numbered bins; Jφ < 0) and
                                                                                  prograde (even-numbered bins; Jφ > 0). The vertical dashed lines in panels
                                                                                  (b) and (c) mark the median metallicity of the combination of all stars in bins
                                                                                  1 and 2 ([Fe/H] = −1.37). The horizontal line is for the 50th percentile of the
                                                                                  CDF. The CDF for bins 1 and 2 (red on all panels) is the most consistent of
                                                                                  all the pairings of prograde and retrograde bins; these bins form our selection
                                                                                  of GSE stars.
Figure 2. The distribution of the 86 320 GALAH stars with reliable lithium
abundances (i.e. flag li fe = 0) in (a) Teff –log g; and ALi versus (b) Teff ,
                                                                                  4 GAIA- S AU S AG E - E N C E L A D U S M E M B E R
(c) log g, (d) [Fe/H], and (e) signal-to-noise ratio (SNR). The horizontal
blue line is the big bang nucleosynthesis (BBN) lithium abundance (ALi =
                                                                                  SELECTION
2.75 ± 0.02; Pitrou et al. 2018). Highlighted are all stars with [Fe/H] < −0.8,   One of the major discoveries facilitated by Gaia is that about
with black dots for stars with Teff > 5850 K, and fuchsia crosses for stars       half of the metal-poor stars in the local halo appear to have been
with Teff < 5850 K. The hotter stars are our selection of metal-poor stars that
                                                                                  accreted from single dwarf galaxy called Gaia-Sausage-Enceladus
are least affected by lithium depletion on the main sequence. The cooler stars
                                                                                  (GSE; Belokurov et al. 2018; Haywood et al. 2018; Helmi et al.
might otherwise have been thought to form part of the Spite plateau, but can
be seen to have much lower lithium abundances. As this figure only shows          2018; Myeong et al. 2018b). Here, we identify likely accreted GSE
stars with reliable lithium abundances, the morphology of the Teff –log g plane   stars using the same method as Feuillet et al. (2020), who cleanly
shows two interesting features, highlighted with triangular regions in panel      selected GSE members as those with Galactic orbits that had angular
(a): the ‘warm peninsula’ of Li-rich dwarf stars, and the ‘Li dip’ where there    momentum Jφ ∼ 0 and large radial action JR .
is a dearth of stars with lithium measurements.                                      Fig. 3 is similar to fig. 5 from Feuillet et al. (2020),
                                                                                                                                            √ but for
                                                                                  our sample of 197 921 GALAH DR3 dwarfs. The Jφ – JR space
                                                                                  is divided into pairs√of prograde (Jφ > 0) and retrograde (Jφ < 0)
temperature. There are a handful of hotter metal-poor stars that fall             bins
                                                                                  √ for a range of −1JR1/2 . As Feuillet et al. (2020) noted, stars with
on to the Li-rich ‘warm peninsula’ – the stars least affected by any                 JR > 30 (kpc km s ) (i.e. our bins 1 and 2, which will form our
Li depletion. However, as we will see in Section 5, none of these                 GSE selection) have similar cumulative metallicity density function
stars are found in our halo samples. Of the 86 320 dwarf stars with               (CDF) for both the prograde and retrograde bins – consistent with
reliable Li abundances in our data set, 53 761 have Teff > 5850 K.                them having
                                                                                          √     a single origin. Meanwhile, in all bins other than 1
For the 992 dwarf stars with metallicity [Fe/H] < −0.8, 485 dwarf                 and 2 ( JR < 30 (kpc km s−1 )1/2 ), each pairing of the prograde and
stars have Teff > 5850 K.                                                         retrograde bins shows different CDFs. All of the prograde bins are

MNRAS 507, 43–54 (2021)
Extragalactic lithium problem 47
more metal rich than bins 1 and 2, due to the formers’ inclusion of with reliable parameters, of which 59 (62 per cent) have a reliable
more disc-like (and therefore more metal rich) stars. The combined ALi , but only 16 (17 per cent) have [α/Fe], 10 (11 per cent) have
sample of stars from bins 1 and 2 has a median metallicity of [Fe/H] = [Mg/Fe], 10 (11 per cent) have [Mn/Fe], and none have [Al/Fe].
−1.37, which is marked with dashed vertical lines in Figs 3(b) It is still useful to consider the abundance for the metal-rich end
and (c). This is more metal poor than the median metallicity of of the GSE selection. Fig. 5 shows a comparison of the abundance
[Fe/H] = −1.17 found by Feuillet et al. (2020) for the same kinematic distributions of ALi , [α/Fe], [Mg/Fe], and [Na/Fe] for GSE (left-hand
selection, but their sample was giants with photometric metallicity column) and the stars from the retrograde halo sample (right-hand
estimates. column). α-elements like Mg and the odd-Z elements like Na have
We combine bins 1 and 2 to be the selection of GSE stars and well-known ‘knee’ in the Tinsley–Wallerstein diagram (Buder et al.
highlight those stars in a variety of observational spaces in Fig. 4. 2021) when Type Ia supernova (SN Ia) began to dominate Type II
Three additional groups of stars are identified for comparison to our supernova (SN II) and decrease the abundance of some light elements
GSE sample, and these regions are indicated in Fig. 4(a). The details in the interstellar medium (e.g. Kobayashi, Karakas & Lugaro 2020).
of these selections are as follows: For the Milky Way this is at [Fe/H] ∼ −1, while lower galactic mass
√
Downloaded from https://academic.oup.com/mnras/article/507/1/43/6321839 by guest on 30 November 2021
systems have their knee at a lower metallicity (Venn et al. 2004).
(i) 93 GSE stars: (−0.5 < Jφ < 0.5) Mpc km s−1 and JR >
−1 1/2
We confirm this previously observed feature of GSE (Helmi et al.
30 (kpc km s ) ;
2018; Monty et al. 2020). We find only two GSE stars (marked with
√ (ii) 102 retrograde−1orbiting halo stars: Jφ < 0 Mpc km s−1 and
1/2
black crosses in Figs 4 and 5) that have [α/Fe] values clearly more
JR < 25 (kpc km s ) ;
consistent with the α-rich disc.
(iii) 208 prograde orbiting stars that will be a mixture of halo and
There is one further possible contaminant star. This star, marked
dynamically thick disc stars: (0 < Jφ < 1) Mpc km s−1 and 20 <
√ with open black circle in Fig. 4, has a location on Teff –log g diagrams
JR < 25 (kpc km s−1 )1/2 ;
and CMD (Figs 4b and h, respectively) that makes the star too young
(iv) 196 619 disc stars, which √ are highly likely to have formed
and/or massive to belong to GSE. Briefly, there are three possible
in situ: Jφ > 0.9 Mpc km s−1 and JR < 15 (kpc km s−1 )1/2 .
explanations: (1) it has relatively large errors in its orbital parameters,
Different authors have used different selections for identifying so it could simply be the result of unreliable measurements; (2) it is
members of GSE. The JR –Jφ selection used in this work has much a young in situ Milky Way star that has ended up in a halo orbits by
overlap with these other selections, but has the advantage of having some dynamical process (Famaey et al. 2005; Bensby et al. 2007;
less contamination from non-GSE stars. Here we comment on the Williams et al. 2011; Casey et al. 2014); (3) it is a blue straggler (BS)
similarities and differences between the various selections used in star. BS stars are main-sequence-like stars that stand out in roughly
other works. coeval populations because they are significantly more massive than
the normal main-sequence turn-off mass of the population (Bailyn
(i) Belokurov et al. (2018) used the v R versus v φ plane to identify 1995). Many globular clusters have a population of BS, and the
their ‘Sausage’ of stars at v φ ∼ 0 km s−1 . Their selection includes leading mechanisms invoked to explain their presence are binary
stars at all v R , rather than our selection that is limited to |v R | > mergers and/or stellar collisions. Identifying them in the field is
∼200 km s−1 (Fig. 4e). Having a lower limit in JR for GSE would much more difficult because you are no longer considering a ‘closed
result in stars with smaller |v R | being included, while maintaining box’ environment, but estimates suggest the fraction of the nearby
the range of v φ . halo BS is of the order of 20 per cent (Casagrande 2020).
(ii) Koppelman, Helmi & Veljanoski (2018) and Helmi et al. Overall, there appears to be little obvious contamination of non-
(2018) identified their GSE stars as a ‘plume’ of stars in the Jφ – GSE stars into our sample. Neither the possible BS stars nor the α-rich
energy space (Fig. 4c) and in the Toomre diagram (Fig. 4f), which stars affect the analysis of the Spite plateau as they, by chance, lack
is where our GSE selection stars can also be found. The region used reliable lithium abundances.
by Helmi et al. (2018) was more retrograde and includes
√ stars that
are found on the ‘arm’ of stars that extend to low JR and negative
Jφ region of Fig. 4(a) that we have defined as being the ‘retrograde 5 T H E L I T H I U M P L AT E AU A N D E N R I C H M E N T
halo’. IN GSE
(iii) Myeong et al. (2019) selected their GSE sample using the Using the Teff selection from Section 3 and the dynamical selections
action space map (Fig. 4d). Their selection translates to a narrower from Section 4, we now compare the properties of the Spite plateau
range of angular momentum (|Jφ | ≤ 0.1 Mpc km s−1 ), but like Be- for subpopulations of the Milky Way (the selected stars are listed in
lokurov et al. (2018), to a lower value of JR than we have used. Table 1). As discussed in Section 1, the aim of this work is to explore
(iv) Our selection of stars has identified stars along a narrow the lithium abundances of GSE stars and compare them to the rest of
sequence in the colour–magnitude diagram (CMD; Fig. 4b) that is the Milky Way halo (a mixture of accreted and in situ stars) and the
consistent with the blue sequence found by Haywood et al. (2018) Milky Way disc stars (likely in situ formation), to see if there is any
and others. difference that could be the result of formation environment.
Fig. 6 compares the four populations defined in Section 4: GSE
(first column), the retrograde halo (second column), the prograde
4.1 Possible contamination of the sample
halo (third column), and the disc (fourth column). The top row
In this subsection, we consider if there is any contamination of our shows the ALi distribution with [Fe/H],
√ with other rows showing
selection of GSE stars with non-member stars. for context the [Fe/H]–[α/Fe], Jφ – JR , and Teff –log g distributions
We have not used abundance information as a chemical tag of GSE of the stars. For each population we only highlight the stars with Teff
stars (e.g. Mg, Mn, and Al as used by Das, Hawkins & Jofré 2020), as > 5850 K (Section 3); additionally for the rightmost column, the
this would limit us to only the metal-rich stars, due to the limitations panels showing the disc stars, only those stars with [Fe/H] < −0.6
of HERMES spectra for metal-poor stars. In the metallicity range are shown for visual clarity (this metallicity was chosen as it is the
−2.5 < [Fe/H] < −2.0, there are 95 dwarf stars in GALAH DR3 observed metallicity ceiling of the other three samples). The purple
MNRAS 507, 43–54 (2021)48 J. D. Simpson et al.
Downloaded from https://academic.oup.com/mnras/article/507/1/43/6321839 by guest on 30 November 2021
Figure
√ 4. Distributions of all GALAH dwarfs in a variety of dynamical, orbital, and stellar parameter spaces that have been used to identify GSE stars: (a) the
Jφ – JR action-angle space; (b) the colour–(absolute) magnitude diagram (CMD); (c) Jφ and orbital energy; (d) Jφ and (JZ − JR ) normalized by Jtot (= JZ +
JR + |Jφ |); (e) the Galactocentric velocity components v r and v φ ; (f) the Toomre diagram; (g) orbital eccentricity and the largest distance travelled out of the
Galactic plane zmax ; and (h) Teff –log g. In panel (a) the selections used to identify the various dynamical subsamples are shown, and the stars within the GSE
box are highlighted in red in all panels, except for three GSE stars that are highlighted in black. These latter stars are either much hotter than all other stars
(possibly blue straggler stars; black open circle symbols); or are α-rich stars (see Fig. 5; black crosses).
MNRAS 507, 43–54 (2021)Extragalactic lithium problem 49
Galactic lithium evolution (Bensby & Lind 2018), and not self-
depletion or self-enrichment of lithium in these stars. A bootstrap
method was used to estimate the mean and standard deviation for
each population. For each sample of stars, we resampled the ALi
values with replacement 1000 times. For each resampled set of values
we found the mean and the standard deviation, and then found the
mean and the standard deviation of these 1000 values. In the top
row of Fig. 6 the coloured horizontal line is the mean of the 1000
mean values, and the shaded region indicates the average of the 1000
standard deviations.
For all 251 GALAH dwarf stars with Teff > 5850 K, [Fe/H] <
−1.3, and measured lithium abundance, we find the Spite plateau
has a mean of ALi = 2.35 ± 0.01 and a spread of σALi = 0.12 ± 0.01.
Downloaded from https://academic.oup.com/mnras/article/507/1/43/6321839 by guest on 30 November 2021
For the four subsets of stars:
(i) 37 GSE stars: ALi = 2.37 ± 0.02, σALi = 0.12 ± 0.02;
(ii) 45 retrograde halo stars: ALi = 2.37 ± 0.02, σALi = 0.15 ±
0.03;
(iii) 34 prograde halo stars: ALi = 2.35 ± 0.02, σALi = 0.10 ±
0.01;
(iv) 40 disc stars: ALi = 2.33 ± 0.02, σALi = 0.14 ± 0.02.
The metallicity range for which GALAH provides reliable metallic-
ities is [Fe/H] > ∼−3, and we confirm (as has previously been seen;
e.g. Rebolo, Molaro & Beckman 1988; Meléndez et al. 2010) that
the Spite plateau is basically flat with metallicity for stars within this
metallicity regime. The four subsamples of stars show essentially
identical mean ALi abundances.
To summarize, we do not find any evidence to support the
hypothesis that the formation environment affects the Spite plateau.
This result is not overly surprising. While, it was previously difficult
to identify stars in the Milky Way that truly formed in another
galaxy, there was a consensus that a large fraction of the halo was
accreted during the hierarchal mergers. So the prior literature on the
Spite plateau (e.g. Pinsonneault et al. 1992, 1999; Ryan et al. 1999;
Figure 5. Abundance distributions for ALi , [α/Fe], [Mg/Fe], and [Na/Fe] for Meléndez & Ramı́rez 2004; Bonifacio et al. 2007) will have certainly
the GSE stars (left-hand column; red dots with error bars) and retrograde halo
contained some mixture of in situ and ex situ stars. If there was some
sample (right-hand column; blue dots with error bars), compared to the full
sample of dwarf stars used in this work (background log-density distribution).
large difference in the formation lithium abundance of stars that was
The black symbols are the same as in Fig. 4, indicating dynamically selected driven by their host galaxy, then this should have been obvious as a
GSE stars that are either α-rich (crosses) or much hotter than all other GSE large scatter in the Spite plateau – something that is not seen at the
stars (unfilled circles). The blue horizontal lines in panels (a) and (b) indicate metallicities considered in this work.
the BBN prediction for ALi (ALi = 2.75 ± 0.02; Pitrou et al. 2018). For the
other elements, comparing the GSE sample to the retrograde halo sample,
for stars with [Fe/H] > ∼ − 1, the GSE stars are generally all lower in
6 M E TA L - P O O R S TA R S A B OV E T H E S P I T E
abundance, while the retrograde halo stars have abundances more consistent P L AT E AU
with the α-rich disc. In Fig. 6, we have highlighted with purple squares those metal-poor
stars in each population that show ALi near or above the BBN lithium
square symbols further highlight stars within each sample that have abundance. Most of these stars are found in the disc sample, and all of
ALi > 2.65 – stars that are near or above the BBN lithium abundance; the Li-rich disc dwarfs are found on the warm peninsula (Fig. 6p). As
these stars will be discussed in Section 6. discussed in Gao et al. (2020), metal-poor stars with these properties
As could already be clearly seen in Figs 5(a) and (b), GALAH could be stars that have truly retained the BBN abundance.
DR3 confirms the result from Molaro et al. (2020) and Cescutti For the halo and GSE samples, there are four metal-poor stars that
et al. (2020) – GSE shows broadly the same Spite plateau lithium sit well above the Spite plateau. Unlike the hot (Teff > 6500 K) stars
abundance as other stars in the Milky Way halo. Fig. 6 shows this of the disc mentioned above, these stars are cooler and so should
result even more clearly with the sample limited to stars with Teff > sit on the Spite plateau. Such Li-rich stars have been observed in
5850 K: GSE stars, and the retrograde halo stars, are confined to a globular clusters (Koch, Lind & Rich 2011; Monaco et al. 2012)
small region of ALi . The prograde halo and the disc sample show a and in the field (Bonifacio & Molaro 1997; Asplund et al. 2006).
larger range of ALi , but if we look at only the stars with [Fe/H] < Within the framework for the Spite plateau proposed by Fu et al.
−1.3, these stars are constant ALi with [Fe/H]. (2015) – lithium depletion by the stars, followed by accretion from
To quantify the Spite plateau ALi abundance, we consider only the interstellar medium – such lithium-rich stars could also be the
stars with [Fe/H] < −1.3, because stars above this metallicity in result of an increase of the accretion process.
the prograde halo and disc samples begin to show a divergence They could be the result of mass transfer from an asymptotic
from the Spite plateau. This divergence is likely the signature of giant branch (AGB) companion. The GALAH flag sp includes
MNRAS 507, 43–54 (2021)50 J. D. Simpson et al.
Table 1. Stellar parameters and lithium abundances for those stars identified as belonging the Spite plateau in GALAH DR3. Here we
show only the four stars from the GSE and retrograde halo samples that appear to be lithium enrichment (Fig. 6). The full table is available
as supplementary material.
star id sobject id dr3 source id Teff log g [Fe/H] ALi Population
08295313+1621105 160110002601062 658743190301110144 5988 3.98 −1.43 2.72 GES
13433203−3940090 190223003301120 6113351720646486528 5956 3.84 −1.38 2.81 GES
03355522−6833454 131116000501386 4667364088963367808 5874 4.29 −1.33 3.02 Retrograde halo
15123917−1944545 170507008301377 6256414985329648384 6338 4.29 −1.94 2.70 Retrograde halo
bits to signify stars that could be binaries – either because they & Bland-Hawthorn 2002). Within the Milky Way we have the ability
sit on the equal-mass binary sequence, or are found colocated with to measure the properties and abundances of millions of individual
other binaries in the t-distributed stochastic neighbour embedding stars to great precision, something that is only possible for some of
Downloaded from https://academic.oup.com/mnras/article/507/1/43/6321839 by guest on 30 November 2021
(t-SNE) projections. However, all the stars considered in this work the most luminous stars in nearby galaxies.
have flag sp == 0, so were not flagged as possible binaries. One The Gaia revolution has shown the Milky Way contains a plethora
of the stars does have a large v broad , indicating it has broad spectral of spatial and kinematic substructure (see the review by Helmi 2020),
lines – this could be a possible signature of binarity. If these stars confirming the model of hierarchical galaxy formation. One of the
were the product of mass transfer from an AGB companion, then dominant features is GSE, postulated to be the accretion remnant of a
this might manifest in the s-process abundances, which are shown dwarf galaxy with a mass similar to the present-day Large Magellanic
for these stars in Fig. 7. Interpretation of neutron-capture element Cloud. It provides a large sample of identifiable ex situ formed stars,
abundances in GALAH at low metallicity should be treated with readily observable with moderate-sized telescopes. Every Galactic
caution as there is a strong metallicity-dependent detection limit. For stellar survey with a simple selection that includes halo stars will
the very lithium-rich retrograde halo star (blue square), it is clearly have a large sample of GSE stars.
Ba and Y enhanced – though there are also several ‘lithium-normal’ In this work, we have used results from GALAH DR3 to investigate
stars of similar s-process abundances. Conversely, the most lithium- the lithium abundance of ∼100 GSE stars. In particular we are
rich GSE star has low Ba and undetected Y. interested in whether the formation environment of stars could be part
Alternatively, it could represent lithium enrichment of the interstel- of the solution to the cosmological lithium problem – the observed
lar medium from which the stars formed. Models and observations discrepancy between the primordial amount of lithium predicted to
of the Milky Way have its overall ALi increasing at around [Fe/H] ∼ have been formed by BBN and the amount of lithium observed in
−0.8 (Bensby & Lind 2018; Cescutti & Molaro 2019). This increase warm, metal-poor stars (Fields 2011).
is driven by carbon–oxygen classical novae that produce 7 Be that then The large data set of GALAH makes it possible to carefully
decays to 7 Li (Grisoni et al. 2019; Starrfield et al. 2020). Cescutti et al. consider the effects of stellar parameters on the observed lithium
(2020) and Molaro et al. (2020) both investigated evidence for lithium abundance of stars (Section 3). The lithium abundance of a star cannot
enrichment in GSE, with their models predicting the enrichment of be considered in isolation from the observed stellar parameters, as
lithium would occur at [Fe/H] ∼ −1.2, a lower metallicity than in standard models of stellar evolution do not successfully predict
the Milky Way. Fig. 6 shows an exemplar Galactic lithium evolution the observed trends between the lithium abundance of a star and
model from Cescutti & Molaro (2019) as the solid black curve, its Teff , log g, and [Fe/H]. As shown in Fig. 2, there are features
and Fig. 6(a) also has a lithium enrichment model for GSE from such as the lithium-dip region and the warm peninsula, which were
Cescutti et al. (2020) as the dashed curve. These novae have similar studied in detail with the same data by Gao et al. (2020). For
progenitors (white dwarfs in binaries) as SNe Ia, Cescutti et al. (2020) the purposes of studying the Spite plateau here we require stars
assume a similar time delay of ∼1 Gyr before the onset of novae as to have Teff > 5850 K, because this is the region of parameter
typically assumed for SNe Ia. Thus an upturn in lithium abundance space that contains stars least affected by main-sequence lithium
should occur at around the same time (i.e. [Fe/H]) as the downturn depletion.
in [α/Fe]. We clearly see this downturn in [α/Fe] (Fig. 5c), but there To identify stars from the GSE we used orbital angular momenta
is very much a lack of lithium-rich GES stars (Fig. 6a). There are and integrals of motion. Fig. 4 shows that GSE stars are found to have
only two GSE stars with enhanced lithium at lower metallicities, but large JR and Jφ ≈ 0 Mpc km s−1 . Kinematic substructure cannot be
they both at [Fe/H] < −1, lower than the metallicity predicted by identified as accreted solely from its position in dynamical space.
Cescutti et al. (2020) for the Li enrichment. Both can be seen to have Jean-Baptiste et al. (2017) showed with high-resolution, dissipation-
orbital actions consistent with GSE, and one definitely has a low α less N-body simulations that in various dynamical parameter spaces
abundance, so there is nothing to rule out their GSE membership. there is considerable overlap between the in situ and the accreted
GES is not the only accretion contributor to the halo of the Milky populations. Figs 3 and 5 show that our GSE selection does appear
Way. So, there would be a variety of formation galaxy masses that to be relatively free from contamination by obvious in situ stars –
have contributed. We might therefore expect to find many metal-poor the metallicity CDF is very similar for the prograde and retrograde
stars above the Spite plateau, but there are just four in our sample of populations of stars with JR > 30 (kpc km s−1 )1/2 ; and our GSE stars
251 stars. with [Fe/H] > −1 show low α-element abundances as expected for
stars that formed in a low galactic mass system.
7 S U M M A RY The main conclusion of this work is that the formation environment
of a warm, metal-poor halo star does not play a role in its main-
One of the main aims of Galactic archaeology, and in particular the sequence lithium abundance. There is no obvious difference in the
GALAH survey, is to link the observations of the Milky Way to those lithium abundance, or its scatter, for metal-poor (−3 < [Fe/H] <
of other galaxies – the concept of ‘near-field cosmology’ (Freeman −1.3) stars from the GSE compared to stars from the halo or disc. In
MNRAS 507, 43–54 (2021)Extragalactic lithium problem 51
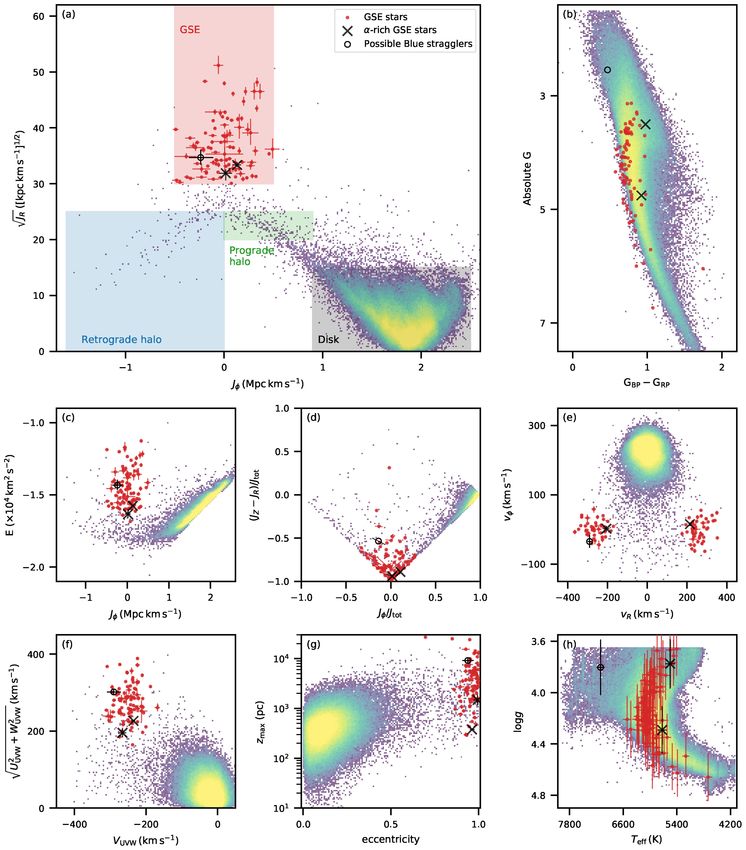
Figure 6. The (top row) ALi –[Fe/H], (second row) [α/Fe]–[Fe/H], Jφ –JR (third row), and (bottom row) Teff –log g distributions for the four dynamically selected Downloaded from https://academic.oup.com/mnras/article/507/1/43/6321839 by guest on 30 November 2021
populations of stars – GSE (first column), retrograde halo (second column), prograde halo (third column), and disc (fourth column). The background distribution
on all panels is all dwarf stars in GALAH with reliable lithium abundances. For each group the stars that meet the Teff –age criteria (Section 3 and Fig. 2) are
highlighted. For visual clarity, the disc sample has been truncated to only show stars with [Fe/H] < −0.6. In the top row, the coloured horizontal line and shaded
region indicate the average and standard deviation of stars with [Fe/H] < −1.3, i.e. the Spite plateau for that population. Highlighted with black-edged squares
or diamond symbols (filled for stars with a reliable [α/Fe]; different symbols on the GSE and retrograde halo are simply to help the reader distinguish the two
stars) are those stars from each group that have ALi > 2.65, i.e. they have lithium abundances near or above the BBN ALi amount (ALi = 2.75 ± 0.02; Pitrou et al.
2018). These stars are of interest for the accreted samples (GSE and the retrograde halo) as they could represent possible lithium enrichment in their formation
environments. The solid black line is a thin disc evolutionary model from Cescutti & Molaro (2019), and the dashed black line is an evolutionary model for GSE
from Cescutti et al. (2020).
particular, stars from the retrograde halo – which represent a stellar This work used the motivation of the model proposed by Piau et al.
population that is likely to be either accreted or formed in the ancient (2006) that the Spite plateau is simply the result of the first generation
proto-Galaxy – are indistinguishable from the GSE stars. This fits of stars of a galaxy efficiently depleting lithium. We extended this
with the framework that sees the Spite plateau as the consequence of to a more general idea that, like α-element abundances, different
a lithium depletion by stars themselves. galaxies would leave a different imprint on the lithium abundances.
MNRAS 507, 43–54 (2021)52 J. D. Simpson et al.
for astronomy; MATPLOTLIB (v3.3.3; Hunter 2007; Caswell et al.
2020); SCIPY (v1.6.0; Virtanen et al. 2020); and H5PY (v3.1.0).
This work has made use of data from the European Space Agency
(ESA) mission Gaia (https://www.cosmos.esa.int/gaia), processed
by the Gaia Data Processing and Analysis Consortium (DPAC, https:
//www.cosmos.esa.int/web/gaia/dpac/consortium). Funding for the
DPAC has been provided by national institutions, in particular the
institutions participating in the Gaia Multilateral Agreement.
Parts of this research were conducted by the Australian Research
Council Centre of Excellence for All Sky Astrophysics in 3 Dimen-
sions (ASTRO 3D), through project number CE170100013. JDS,
SLM, and DBZ acknowledge the support of the Australian Research
Council through Discovery Project grant DP180101791. SLM and
Downloaded from https://academic.oup.com/mnras/article/507/1/43/6321839 by guest on 30 November 2021
JDS are supported by the UNSW Scientia Fellowship program. KL
acknowledges funds from the European Research Council (ERC)
under the European Union’s Horizon 2020 Framework Programme
(grant agreement no. 852977). Y-ST is grateful to be supported by
the NASA Hubble Fellowship grant HST-HF2-51425.001 awarded
by the Space Telescope Science Institute. ARC is supported in part by
the Australian Research Council through a Discovery Early Career
Researcher Award (DE190100656).
DATA AVA I L A B I L I T Y
The data underlying this paper are available in the AAO Data Central.
The GALAH DR3 catalogue, several value-added catalogues, and
all HERMES spectra of the sources are available for download via
Figure 7. The s-process abundances of the lithium-rich halo dwarf stars the Data Central service at datacentral.org.au. The accompanying
found in GALAH. The symbols are the same as in Fig. 6. The lack of stars in documentation can be found at docs.datacentral.org.au/galah, and a
the lower left-hand quadrant of the panels is related to detection limitations full description of the data release is given in Buder et al. (2021).
of HERMES spectra. There does not appear to be any correlation between
lithium and s-process enrichment. Two of the stars with high Li abundances
have high s-process abundances, but two have either normal-to-low or no REFERENCES
measurable s-process abundances.
Abadi M. G., Navarro J. F., Fardal M., Babul A., Steinmetz M., 2010,
It should be noted that this proposed scenario has been rejected (e.g. MNRAS, 407, 435
Aguado D. S. et al., 2021, MNRAS, 500, 889
Prantzos 2010, 2012) on the basis as it requires processing over two-
Alpher R. A., Bethe H., Gamow G., 1948, Phys. Rev., 73, 803
thirds of all baryonic matter in very short-lived stars prior to any of Asplund M., Lambert D. L., Nissen P. E., Primas F., Smith V. V., 2006, ApJ,
the present-day halo stars formed, including at [Fe/H] < −3. Such 644, 229
massive star formation would produce large amounts of metals when Asplund M., Grevesse N., Sauval A. J., Scott P., 2009, ARA&A, 47, 481
exploding as super- and hypernovae and thus raise the metallicities Astropy Collaboration et al., 2018, AJ, 156, 123
to well above those of the halo stars. Aver E., Olive K. A., Skillman E. D., 2015, J. Cosmol. Astropart. Phys., 07,
The other notable result from that there are four stars in the halo 011
or GSE with lithium abundances near or above the BBN value. A Bailyn C. D., 1995, ARA&A, 33, 133
handful of such stars have been seen before (Bonifacio & Molaro Barbá R. H., Minniti D., Geisler D., Alonso-Garcı́a J., Hempel M., Monachesi
1997; Asplund et al. 2006; Koch et al. 2011; Monaco et al. 2012). It A., Arias J. I., Gómez F. A., 2019, ApJ, 870, L24
Belokurov V., Erkal D., Evans N. W., Koposov S. E., Deason A. J., 2018,
is possible that they are the consequence of post-formation accretion,
MNRAS, 478, 611
from either a companion, or the interstellar medium from which they Bensby T., Lind K., 2018, A&A, 615, A151
formed. Bensby T., Oey M. S., Feltzing S., Gustafsson B., 2007, ApJ, 655, L89
Bland-Hawthorn J., Gerhard O., 2016, ARA&A, 54, 529
Boesgaard A. M., Lum M. G., Deliyannis C. P., King J. R., Pinsonneault M.
AC K N OW L E D G E M E N T S
H., Somers G., 2016, ApJ, 830, 49
The GALAH survey is based on observations made at the Anglo- Bonifacio P., Molaro P., 1997, MNRAS, 285, 847
Australian Telescope, under programmes A/2013B/13, A/2014A/25, Bonifacio P. et al., 2007, A&A, 462, 851
A/2015A/19, and A/2017A/18. We acknowledge the traditional Borsato N. W., Martell S. L., Simpson J. D., 2020, MNRAS, 492, 1370
Bovy J., 2015, ApJS, 216, 29
owners of the land on which the AAT stands, the Gamilaraay people,
Buder S. et al., 2018, MNRAS, 478, 4513
and pay our respects to elders past, present, and emerging. This
Buder S. et al., 2021, MNRAS, 506, 150
paper includes data that have been provided by AAO Data Central Casagrande L., 2020, ApJ, 896, 26
(datacentral.org.au). Casey A. R. et al., 2014, MNRAS, 443, 828
The following software and programming languages made this Caswell T. A. et al., 2020, matplotlib/matplotlib v3.1.3 (Version v3.1.3).
research possible: PYTHON (v3.9.1); ASTROPY (v4.2; Astropy Collab- Zenodo, Available at: http://doi.org/10.5281/zenodo.3633844
oration et al. 2018), a community-developed core PYTHON package Cescutti G., Molaro P., 2019, MNRAS, 482, 4372
MNRAS 507, 43–54 (2021)Extragalactic lithium problem 53
Cescutti G., Molaro P., Fu X., 2020, Mem. Soc. Astron. Ital., 91, 153 Monaco L., Villanova S., Bonifacio P., Caffau E., Geisler D., Marconi G.,
Charbonnel C., Talon S., 2005, EAS Publ. Ser., 17, 167 Momany Y., Ludwig H.-G., 2012, A&A, 539, A157
Cole S., Lacey C. G., Baugh C. M., Frenk C. S., 2002, MNRAS, 319, 168 Monaco L., Villanova S., Carraro G., Mucciarelli A., Moni Bidin C., 2018,
Cooke R. J., Pettini M., Steidel C. C., 2018, ApJ, 855, 102 A&A, 616, A181
Cyburt R. H., Fields B. D., Olive K. A., Yeh T.-H., 2016, Rev. Mod. Phys., Monty S., Venn K. A., Lane J. M. M., Lokhorst D., Yong D., 2020, MNRAS,
88, 015004 497, 1236
Das P., Hawkins K., Jofré P., 2020, MNRAS, 493, 5195 Mucciarelli A., Salaris M., Bonifacio P., Monaco L., Villanova S., 2014,
Deliyannis C. P., Demarque P., Kawaler S. D., 1990, ApJS, 73, 21 MNRAS, 444, 1812
De Silva G. M. et al., 2015, MNRAS, 449, 2604 Myeong G. C., Evans N. W., Belokurov V., Sanders J. L., Koposov S. E.,
Famaey B., Jorissen A., Luri X., Mayor M., Udry S., Dejonghe H., Turon C., 2018a, ApJ, 856, L26
2005, A&A, 430, 165 Myeong G. C., Evans N. W., Belokurov V., Sanders J. L., Koposov S. E.,
Fattahi A. et al., 2019, MNRAS, 484, 4471 2018b, ApJ, 863, L28
Feuillet D. K., Feltzing S., Sahlholdt C. L., Casagrande L., 2020, MNRAS, Myeong G. C., Vasiliev E., Iorio G., Evans N. W., Belokurov V., 2019,
497, 109 MNRAS, 488, 1235
Fields B. D., 2011, Annu. Rev. Nucl. Part. Sci., 61, 47 Naidu R. P., Conroy C., Bonaca A., Johnson B. D., Ting Y.-S., Caldwell N.,
Downloaded from https://academic.oup.com/mnras/article/507/1/43/6321839 by guest on 30 November 2021
Fields B. D., Olive K. A., Yeh T.-H., Young C., 2020, J. Cosmol. Astropart. Zaritsky D., Cargile P. A., 2020, ApJ, 901, 48
Phys., 03, 010 Nissen P. E., Schuster W. J., 2010, A&A, 511, L10
Forbes D. A., Bridges T., 2010, MNRAS, 404, 1203 Nissen P. E., Schuster W. J., 2012, A&A, 543, A28
Freeman K., Bland-Hawthorn J., 2002, ARA&A, 40, 487 Oser L., Ostriker J. P., Naab T., Johansson P. H., Burkert A., 2010, ApJ, 725,
Fu X., Bressan A., Molaro P., Marigo P., 2015, MNRAS, 452, 3256 2312
Gaia Collaboration et al., 2016, A&A, 595, A1 Piau L., Beers T. C., Balsara D. S., Sivarani T., Truran J. W., Ferguson J. W.,
Gaia Collaboration et al., 2018, A&A, 616, A10 2006, ApJ, 653, 300
Gaia Collaboration et al., 2021, A&A, 649, A1 Pinsonneault M. H., Deliyannis C. P., Demarque P., 1992, ApJS, 78, 179
Gamow G., Landau L., 1933, Nature, 132, 567 Pinsonneault M. H., Walker T. P., Steigman G., Narayanan V. K., 1999, ApJ,
Gao X. et al., 2020, MNRAS, 497, L30 527, 180
Gratton R., 2020, in Bragaglia A., Davies M. B., Sills A., Vesperini E., eds, Pitrou C., Coc A., Uzan J.-P., Vangioni E., 2018, Phys. Rep., 754, 1
Proc. IAU Symp. Vol. 351, Star Clusters: From the Milky Way to the Prantzos N., 2010, PoS, NIC-IX, 254
Early Universe. Cambridge Univ. Press, Cambridge, p. 241 Prantzos N., 2012, A&A, 542, A67
Gravity Collaboration et al., 2019, A&A, 625, L10 Randich S., Magrini L., 2021, Frontiers Astron. Space Sci., 8, 616201
Grisoni V., Matteucci F., Romano D., Fu X., 2019, MNRAS, 489, 3539 Rebolo R., Molaro P., Beckman J. E., 1988, A&A, 192, 192
Haywood M., Di Matteo P., Lehnert M. D., Snaith O., Khoperskov S., Gómez Reid M. J., Brunthaler A., 2004, ApJ, 616, 872
A., 2018, ApJ, 863, 113 Richard O., 2012, Mem. Soc. Astron. Ital. Suppl., 22, 211
Helmi A., 2020, ARA&A, 58, 205 Ryan S. G., Norris J. E., Beers T. C., 1999, ApJ, 523, 654
Helmi A., White S. D. M., de Zeeuw P. T., Zhao H., 1999, Nature, 402, 53 Salpeter E. E., 1955, Phys. Rev., 97, 1237
Helmi A., Babusiaux C., Koppelman H. H., Massari D., Veljanoski J., Brown Sbordone L. et al., 2010, A&A, 522, A26
A. G. A., 2018, Nature, 563, 85 Schönrich R., Binney J., Dehnen W., 2010, MNRAS, 403, 1829
Horta D. et al., 2020, MNRAS, 493, 3363 Searle L., Zinn R., 1978, ApJ, 225, 357
Howk J. C., Lehner N., Fields B. D., Mathews G. J., 2012, Nature, 489, 121 Sharma S. et al., 2018, MNRAS, 473, 2004
Hunter J. D., 2007, Comput. Sci. Eng., 9, 90 Sharma S. et al., 2019, MNRAS, 490, 5335
Ibata R. A., Gilmore G., Irwin M. J., 1994, Nature, 370, 194 Sheinis A. et al., 2015, J. Astron. Telesc. Instrum. Syst., 1, 035002
Ibata R., Chapman S., Ferguson A. M. N., Irwin M., Lewis G., McConnachie Simpson J. D. et al., 2020, MNRAS, 491, 3374
A., 2004, MNRAS, 351, 117 Spite F., Spite M., 1982a, A&A, 115, 357
Ibata R. A., Malhan K., Martin N. F., Starkenburg E., 2018, ApJ, 865, 85 Spite M., Spite F., 1982b, Nature, 297, 483
Ibata R. A., Malhan K., Martin N. F., 2019, ApJ, 872, 152 Starkenburg E., Oman K. A., Navarro J. F., Crain R. A., Fattahi A., Frenk C.
Jean-Baptiste I., Di Matteo P., Haywood M., Gómez A., Montuori M., Combes S., Sawala T., Schaye J., 2017, MNRAS, 465, 2212
F., Semelin B., 2017, A&A, 604, A106 Starrfield S., Bose M., Iliadis C., Hix W. R., Woodward C. E., Wagner R. M.,
Ji A. P. et al., 2020, AJ, 160, 181 2020, ApJ, 895, 70
Keller B. W., Kruijssen J. M. D., Pfeffer J., Reina-Campos M., Bastian N., Venn K. A., Irwin M., Shetrone M. D., Tout C. A., Hill V., Tolstoy E., 2004,
Trujillo-Gomez S., Hughes M. E., Crain R. A., 2020, MNRAS, 495, AJ, 128, 1177
4248 Virtanen P. et al., 2020, Nat. Methods, 17, 261
Kobayashi C., Karakas A. I., Lugaro M., 2020, ApJ, 900, 179 Wallerstein G., Herbig G. H., Conti P. S., 1965, ApJ, 141, 610
Koch A., Lind K., Rich R. M., 2011, ApJ, 738, L29 White S. D. M., Frenk C. S., 1991, ApJ, 379, 52
Koppelman H., Helmi A., Veljanoski J., 2018, ApJ, 860, L11 Williams M. E. K. et al., 2011, ApJ, 728, 102
Kos J. et al., 2017, MNRAS, 464, 1259 Wittenmyer R. A. et al., 2018, AJ, 155, 84
Lewis I. J. et al., 2002, MNRAS, 333, 279 Yan H.-L. et al., 2018, Nat. Astron., 2, 790
Li C., Wang Y., Milone A. P., 2019, ApJ, 884, 17 Yuan Z. et al., 2020, ApJ, 891, 39
Li C., Wang Y., Tang B., Milone A. P., Yang Y., Ji X., 2020, ApJ, 893, 17
McMillan P. J., 2017, MNRAS, 465, 76
Malhan K., Ibata R. A., Martin N. F., 2018, MNRAS, 481, 3442 S U P P O RT I N G I N F O R M AT I O N
Martell S. L. et al., 2017, MNRAS, 465, 3203 Supplementary data are available at MNRAS online.
Massari D., Koppelman H. H., Helmi A., 2019, A&A, 630, L4
Mateu C., Read J. I., Kawata D., 2018, MNRAS, 474, 4112
Table 1. Stellar parameters and lithium abundances for those stars
Meléndez J., Ramı́rez I., 2004, ApJ, 615, L33
identified as belonging the Spite plateau in GALAH DR3.
Meléndez J., Casagrande L., Ramı́rez I., Asplund M., Schuster W. J., 2010,
A&A, 515, L3
Michaud G., Charbonneau P., 1991, Space Sci. Rev., 57, 1 Please note: Oxford University Press is not responsible for the content
Molaro P., Cescutti G., Fu X., 2020, MNRAS, 496, 2902 or functionality of any supporting materials supplied by the authors.
MNRAS 507, 43–54 (2021)You can also read