THE COMING GOLDEN AGE OF NEW EUROPE - MUNICH PERSONAL REPEC ARCHIVE MARCIN, PIATKOWSKI
←
→
Page content transcription
If your browser does not render page correctly, please read the page content below
Munich Personal RePEc Archive

The Coming Golden Age of New Europe

Marcin, Piatkowski

Kozminski University, Warsaw, Poland

1 October 2009

Online at https://mpra.ub.uni-muenchen.de/19523/
MPRA Paper No. 19523, posted 25 Dec 2009 10:28 UTC

The Coming Golden Age of New Europe

           Report No. 26

       by Marcin Piatkowski

           October 2009
       1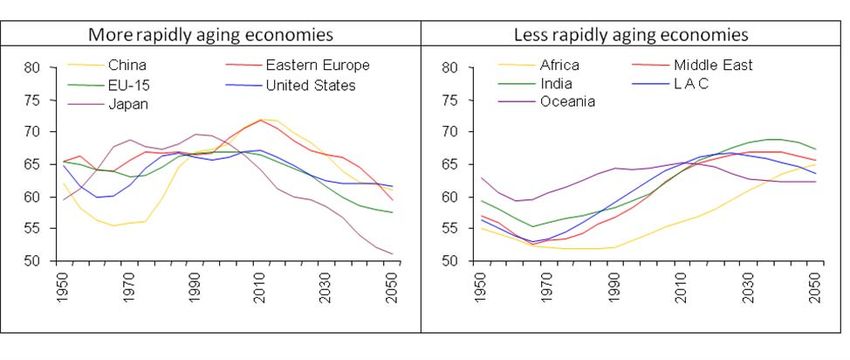
The Coming Golden Age of New Europe
A publication by the Center for European Policy Analysis (CEPA)

October 2009

By Marcin Piatkowski

Marcin Piatkowski, Ph.D. is an Assistant Professor of Economics at TIGER, Kozminski
University in Warsaw.

Center for European Policy Analysis
1155 15th Street, NW
Suite 550
Washington, DC 20005
Tel: (202) 551-9200
Fax: (202) 296-3880
E-mail: info@cepa.org
www.cepa.org

© 2009 by the Center for European Policy Analysis, Washington, D.C. All rights reserved.
No part of this publication may be used or reproduced in any manner whatsoever without
permission in writing from the Center for European Policy Analysis, except in the case of
brief quotations embodied in news articles, critical articles, or reviews. The views expressed
in the publication are those of the author(s) and do not necessarily reflect the views of the
staff, officers or board members of CEPA.

ISBN: 978-0-9825117-5-6

                                              2
Executive Summary
New Europe has never had it so good. Its income, quality of life and level of happiness
have never been closer to that of the developed countries in Western Europe. With its
per capita income at an all-time high and the quality of life almost indistinguishable
from developed countries, the region is well on its way to achieving a higher level of
per capita income than most emerging market countries. New Europe’s true Golden
Age shimmers on the horizon.
Already a significant global player with a combined GDP about the same size as that of
Brazil and Russia, New Europe not only has stronger economic fundamentals, but is
also less vulnerable than other emerging markets to political, social and economic Black
Swans, catastrophic events that could wipe out much of its economic progress.
The Golden Age, however, will not arrive without an assist from policymakers. The
economic crisis has shown that the current growth model based on growing
consumption fueled by imported savings has been largely undermined. New models
are needed to lessen reliance on domestic consumption in favor of higher exports and
stepped-up productivity. To this end, New Europe should enhance incentives for
saving, introduce counter-cyclical fiscal policies and increase spending on human
capital and innovation. It should also increase labor participation, open borders to
immigration and strengthen financial sector supervision. Finally, New Europe should
adopt the euro as quickly as possible, at a competitive exchange rate, diversify exports
and promote further European Union (EU) integration and enlargement. The crisis
provides a good opportunity to implement needed change.
3“Once you start thinking about economic growth, it is hard to think about anything else.”
Robert Lucas, Jr. 1988
Introduction
New Europe, comprising ten postsocialist new EU member states1, already a significant
global economic player with a combined GDP about the same as that of Brazil and
Russia, is likely to be one of this century’s fastest growing regions in the world.
Unshackled from communism only two decades ago and safeguarded by NATO from
military threats, which have undermined its development for hundreds of years, the
region has never before been better positioned to increase its per capita income and
expand global importance. Thanks to low income inequality and adoption of the
European way of life, emphasizing cultural and social development almost as much as
an economic one, the quality of life and level of happiness are likely to improve as well.
Given that New Europe’s level of per capita income today relative to Western Europe is
at its highest level since 1500 and that it has extraordinary growth prospects, the 21st
Century Golden Age is inevitable.
This prediction may sound bold when the region has entered its deepest crisis since the
beginning of its transition. GDP growth in New Europe will be negative this year; next
year will not be much better. But the underlying long-term strengths of the region—
with political, ethnic and religious stability, educated population, low income
inequalities, inflow of EU money, rule of law, adoption of the euro and further
integration with Western Europe—will not be undermined because of the crisis.
The ongoing integration within the EU in particular will continue to benefit the region
due to higher investment, increased trade and enhanced labor mobility. EU integration
will also increasingly narrow the margin for bad policymaking, which in the long run
can offset even the most advantageous economic fundamentals and lead to economic
reversals undermining decades of progress. The last decade has shown that the
institutional straitjacket and EU-supervised rule of law made even the most populist
governments in the Central and Eastern Europe (CEE) region largely impotent.
The same cannot be said about most other emerging markets economies, where---if the
last 40 years are any indication--the next 40 years should see a fair share of political,
social and economic turbulence, including wars, political coups, ethnic violence and
terrorism. These events could substantially wipe out economic progress. The
probability of political and economic reversals, equivalent to rare but catastrophic
1Bulgaria, Czech Republic, Estonia, Hungary, Latvia, Lithuania, Poland, Romania, Slovak Republic and
Slovenia. The name of New Europe is used here instead of Eastern Europe, because the latter is not
geographically correct (most new EU member states are located in Central Europe) and because it has
negative connotations.
4economic crises, is far from zero. The current crisis provides a classic example of an
unexpected, large and disastrous event that is likely to compromise economic progress
achieved in recent years.
Despite strong fundamentals, New Europe’s development needs to be supported by
good economic policymaking, which is an indispensable ingredient of long-term
growth. As argued by Lin (2009), in the long-term the quality of economic policymaking
is more important than geographical location, natural endowments or even the quality
of institutions, particularly as the latter is dependent on policymaking.2
The crisis revealed that New Europe’s current development model based on an
excessive reliance on foreign capital flows, foreign owned banking systems and
undiversified exports, mostly to other countries in the EU, has been largely
undermined. New kinds of policymaking and models, based on creative combinations
of the best characteristics of the New European and Asian growth models will be
needed to reach parity with more developed countries.
This paper is organized as follows: chapter II documents New Europe’s increase of GDP
per capita to its highest level relative to Western Europe since 1500. Chapter III
discusses the impact of the global crisis on New Europe’s economies. Chapter IV takes a
long-term perspective and argues that by 2050 New Europe is likely to have grown
more than most emerging market economies and will have achieved per capita income
practically equal to that in Western Europe. Chapter V provides conclusions and
recommendations.
The last 2000 years
Maddison (2003) provides data on long-term per capita levels between 1500 and 1998.
Table 1 shows that Eastern Europe, which includes Albania, Bulgaria, former
Czechoslovakia, Poland, Romania and countries of former Yugoslavia, achieved the
highest level of per capita income of around 60 percent of Western Europe’s per capita
income in 1500. Since then, the level of per capita income in Eastern Europe relative to
Western Europe has been declining, reaching its lowest level of 30 percent in 1998.3
2 Lin (2009) adds that economic policymaking is in turn often a function of prevailing economic, social
and cultural ideas, although these can also change in longer time horizons.
3 Of course, historical comparisons of levels of income have large margins of error. Yet, they still provide
a useful picture of levels of development, confirmed by anecdotal evidence collected in the large
literature on the subject.
5Table 1. Per capita GDP in Eastern Europe 1500-1998, Western Europe = 100
1500 1600 1700 1820 1870 1913 1950 1973 1998
Western Europe 100 100 100 100 100 100 100 100 100
Eastern Europe 60 58 55 52 44 44 46 43 30
Former Soviet Union 65 62 60 56 48 43 62 53 22
USA 52 45 51 102 124 153 208 145 153
Latin America 54 49 52 54 35 44 56 39 32
China 78 67 59 49 27 16 10 7 17
India 71 62 54 43 27 19 13 7 10
Japan 65 58 56 54 37 40 42 99 114
Other Asia 73 63 55 46 31 23 20 18 21
Africa 52 45 39 34 22 17 19 12 8
Notes: Eastern Europe (EE) includes Albania, Bulgaria, Czechoslovakia, Poland, Romania and former
Yugoslavia.
Source: author’s calculations based on Maddison (2003)
Since the beginning of 1990’s, however, after long centuries of deconvergence, Eastern
Europe’s income, as measured for ten postsocialist new EU member states, has
experienced a huge reversal. In 2008, per capita income in New Europe relative to
Western Europe achieved roughly the same level as in 1500, the highest in more than
500 years (Figure 1).4 Assuming that between year 0 and 1000, the relative income per
capita was not higher, last year New Europe achieved the highest absolute and relative
level of material well-being in its history.5
4 Maddison and Eurostat data are not fully comparable because of the different sample of countries and
different PPS measures. However, while exact levels of income would be different according to both
measures, the trends would still be similar.
5 Because of lack of data, Maddison (2003) assumes that the level of per capita income in Eastern and
Western Europe in year 0 and 1000 was the same. However, taking into account lower population
density, lower trade and generally a lower level of social and political development, it seems reasonable
to assume that New Europe’s level of income was significantly lower than in Western Europe.
6Figure 1: Per capita GDP in New Europe, 1500-2008, Western Europe = 100
65
60
55
50
45
40
35
30
1500 1600 1700 1820 1870 1913 1950 1973 1997 2008
Source: Maddison (2003) for 1500-1973 and Eurostat data for
EU-10 relative to EU-15 for 1997-2008.
Note: EE in Maddison includes Albania, Bulgaria, Czechoslovakia, Hungary, Poland, Romania,
and Yugoslavia. Maddison data are in 1990 international $, while Eurostat in PPS. Both
unweighted averages.
The reversal in growth, particularly since 1997, was of truly historical proportions. New
European countries have never been catching up so quickly with Western Europe and
never all of them at the same time (Figure 2). The weighted average of New Europe’s
per capita GDP increased from 40 percent in 1999 to 52 percent in 2008. The income
convergence is likely to continue during 2009-2010, although not for the Baltic States,
whose relative income level, because of the crisis, will decline substantially.
7Figure 2: Per capita GDP in New Europe 1997-2010, EU-15 = 100, PPS
90
80
Bulgaria
70 Czech Republic
Estonia
60 Latvia
Lithuania
50 Hungary
Poland
40
Romania
Slovenia
30
Slovakia
20
1997 1998 1999 2000 2001 2002 2003 2004 2005 2006 2007 2008 2009 2010
Source: Eurostat and European Commission spring 2009 projections for 2009-2010.
Such explosive convergence during the last decade was largely due to the positive
effects of EU integration, culminating in two waves of eastern enlargement in 2004 and
2007. According to the report of the European Commission (2009) analyzing the
economic effects of EU enlargement after five years, New European countries’ annual
growth rate between 2000 and 2008 accelerated by a significant 1.75 percentage points.
Similarly, Cihak and Fonteyne (2009) assess that EU accession has increased New
Europe’s growth by one percentage point a year.
New Europe has also performed impressively relative to the emerging markets in East
Asia and Latin America. Average per capita income ratio in New Europe relative to the
U.S. increased from 29 percent in 1995 to 41 percent in 2007, or 12 percentage points.
East Asian income has increased by only seven percentage points, while that of Latin
America has hardly grown at all, although there were large differences in economic
performance among individual countries (Figure 3).
8Figure 3: Per capita GDP in New Europe, East Asia and Latin America relative to the
U.S., 1995-2007, PPS
Source: Fabrizio et al. (2009) based on IMF data.
However, growth in per capita GDP does not fully depict improvements. New
Europeans today enjoy historically unparalleled quality of life, which lags behind
Western Europe much less than what differences in income levels would suggest.
Thanks to the Internet, open borders and flattening of the world’s economy, New
Europeans today enjoy the fruits of global technological, cultural and social
development almost as much as Western Europeans.
The level of happiness in New Europe is also at an all time high, rising from historical
lows in the last years of socialism (Layard, 2003, Eurofund, 2009). The United Nations
Development Programme’s (UNDP) Human Development Index, combining per capita
GDP, educational achievement and life expectancy is also at a historical high. It is also
much higher than what the level of income alone would suggest. Kolodko’s (2010)
“Integrated Index of Welfare,” comprising such factors as GDP, education, availability
of free time and the quality of natural environment, would also be at its peak. The
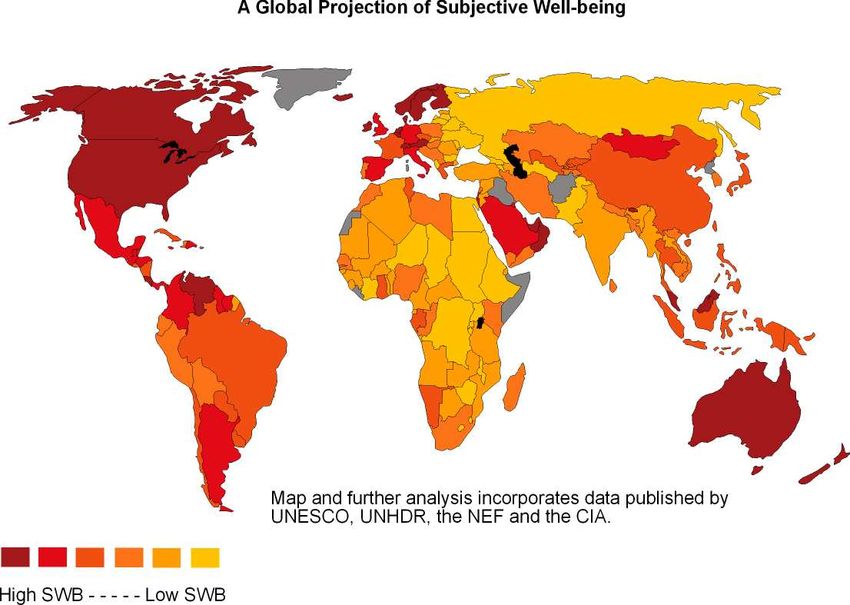
Leicester University map of world’s subjective well-being suggests that New Europeans
as a whole are quite satisfied relative to other regions of the world, including Latin
America and Asia (Figure 4).
9Figure 4: Global projection of subjective well-being (SWB), 2006
Source: White (2007)
The Crisis
The imported global crisis has hit New Europe hard, and the magnitude was largely
unexpected. 6 This year most economies of the region will shrink for the first time since
the beginning of transition: by the end of the year, Baltic economies’ GDP will be more
than 10 percent smaller; Poland’s GDP, the region’s star performer, will grow by only 1
percent. In 2010, growth in most countries in the region will be only slightly positive,
although the most recent data point to some upside potential; Baltic States’ GDP is
projected to continue to shrink (Table 2). Despite lower growth rates, however, the
convergence process for most of these countries will continue, because Western
European countries are expected to grow even slower. Countries like Poland, which are
doing relatively well during the crisis, will---paradoxically--converge with Western
Europe even faster than before the crisis.
6In mid-2008 the IMF, European Commission and the World Bank still projected positive growth rates in
most countries in the region for 2009.
10Table 2. GDP growth in New Europe and the euro zone, 2002-2010
2002-2006 2007 2008 2009 2010
Bulgaria 5,7 6,2 6,0 -1,6 -0,1
Czech Rep. 4,6 6,0 3,2 -2,7 0,3
Estonia 8,4 6,3 -3,6 -10,3 -0,8
Latvia 9,0 10,0 -4,6 -13,1 -3,2
Lithuania 8,0 8,9 3,0 -11,0 -4,7
Hungary 4,3 1,1 0,5 -6,3 -0,3
Poland 4,1 6,6 4,9 -1,4 0,8
Romania 6,2 6,2 7,1 -4,0 0,8
Slovenia 4,3 6,8 3,5 -3,4 0,7
Slovakia 5,9 10,4 6,4 -2,6 0,7
Euro zone 1,7 2,7 0,8 -4,0 -0,1
Source: European Commission, including April projections for 2009-2010.
Baltic States in particular are vulnerable to the imported crisis because they have
allowed an unprecedented increase in external imbalances and build-up of large
speculative bubbles in real estate markets. Until recently, current account deficits in
Baltic States exceeded 20 percent of GDP; the deficits were only marginally smaller in
Bulgaria and Romania. Only Poland, the Czech Republic, Hungary, Slovakia and
Slovenia reported deficits below 10 percent of GDP, a threshold usually indicating the
danger zone. All New European countries had wider external imbalances than most
other emerging markets, especially Eastern Asia (Cihak, Fonteyne 2009). Real estate
bubbles were also unprecedented – during 2004-2007 real estate prices in Riga more
than tripled, exceeding levels in some Western European capitals, despite the level of
per capita income at only half the EU-15 average (Global Property Guide, 2009).7
Such large external imbalances and asset bubbles resulted mainly from a supercharged
increase in credit. Figure 5 shows that in all countries of the region the share of credit in
GDP has multiplied several times in the past decade, with Latvia’s credit ratio
increasing by almost ten times.
7 Since the peak in mid-2007, real estate prices in Latvia, Riga have more than halved.
11Figure 5: Total bank credit to the non-financial private sector in New Europe,
1997-2008
120
1997 2004 2008
100
80
60
40
20
0
BG CZ EE HU LV LT PL RO SK SI
Note: 2008 data as of October.
Source: Keereman et al. (2009) based on the IMF.
Such rapid downturn was fueled by foreign currency lending from Western European
banks, which control more than 60 percent of the region’s banking sector assets, as
opposed to only 30 percent in the old EU member states and around 20 percent in the
rest of the world (Cihak and Fonteyne, 2009). The banking sector in Estonia, Latvia,
Lithuania and Slovakia is totally foreign-owned. During 2004-2008, the share of foreign
financing in GDP in most countries of the region has more than doubled; in Latvia, the
share of foreign financing in GDP increased from 18 percent in 2004 to 70 percent only
four years later (Keereman et al, 2009).
The crisis seems to have segmented New European countries into three groups: the first
includes Poland, the Czech Republic and Slovenia, which have grown slower than the
rest but are now less affected by the crisis; the second group includes the Baltic States
which have grown at almost Chinese rates in the recent past but are now suffering; and
the third group, including Slovakia, Romania and Bulgaria, which are somewhere in the
middle.
12Figure 6: Convergence in New Europe and the rest of the world,
2003-2007
Source: Cihak and Fonteyne (2009).
The strong impact of the global crisis on New Europe will surely have implications for
development in subsequent decades. The current development model based on rapid
credit growth, wide external imbalances, real estate and stock market bubbles and
foreign-owned banking sectors seems to have largely failed. Reliance on exports to euro
zone, global speculative capital and industrial monocultures, especially in the
automotive industry, has also been called into question. New development models will
be needed to ensure continued convergence in the future.
The next 40 years
One thing is certain: the crisis will end.8 When it does, there are reasons to believe that
rapid growth in New Europe will resume, although probably at a lower rate than
8 New Europe is already adjusting to the new world of dried-up foreign financing through—as should be
expected—a sharp correction in external imbalances. This is being achieved through currency
depreciations and/or drops in domestic demand. Latvia’s current account deficit improved from -25
percent of GDP in mid- 2007 to -13 percent in Q4 2008. Bulgaria’s CA deficit decreased from -27 percent of
GDP in Q2 2008 to below -20 percent of GDP in Q1 2009. Countries with floating exchange rates –
13before. Catching up is likely to continue, with countries in New Europe growing at a
rate of at least one percent higher than in Western Europe. As a result, by 2050 most
countries of New Europe will have achieved per capita incomes close or equal to that in
Western Europe.
There are a number of long-term growth projections for New Europe.
PriceWaterhouseCoopers (PWC, 2008) provides projections of GDP growth until 2050
for 30 economies accounting for 85 percent of the world economy, including Poland,
which we can use as the proxy for New Europe. According to these projections, based
on an extrapolation of historical trends in capital investment, anticipated changes in the
quality and size of the labor force, and assumed productivity growth rates, Poland’s per
capita GDP will grow by 2.7 percent a year until 2050. It appears substantial, but is
much below the growth rates for all other emerging markets and only 0.8 percent
higher than the G-7 average (Table 3). PriceWaterhouseCoopers explains that Poland’s
low projected per capita growth rate reflects less favorable demographics and a rapidly
aging population over the period.
Table 3. Projected real growth rates in selected emerging markets, 2007-50
GDP per capita at
GDP in US$ Population PPPs
Vietnam 9,8 0,8 6,0
India 8,5 0,8 5,0
Nigeria 8,0 1,6 4,4
Phillippines 7,2 1,1 4,1
Egypt 7,1 1,1 3,9
Bangladesh 7,0 1,1 3,9
China 6,8 0,1 4,6
Indonesia 6,7 0,6 3,9
Pakistan 6,4 1,4 3,5
E7 average 6,4 0,5 4,0
Malaysia 5,8 1,0 3,3
Thailand 5,7 0,1 3,5
Iran 5,2 0,8 3,0
Brazil 5,2 0,7 3,1
Turkey 5,1 0,7 3,4
Argentina 4,9 0,6 3,0
South Africa 4,8 0,3 3,3
Saudi Arabia 4,8 1,4 2,7
Mexico 4,7 0,5 3,2
Russia 4,3 -0,6 3,2
Poland 3,4 -0,5 2,7
G7 average 2,0 0,3 1,9
Source: PWC (2008).
Romania, Poland, Czech Republic and Hungary – witnessed substantial decreases in the value of their
currency, improving export competitiveness.
14Growth projections for most emerging markets are quite optimistic. For instance, the
projected growth in per capita GDP for Nigeria and Argentina of 4.4 percent and 3.0
percent a year, respectively, seems high given the two countries’ projected fast
population growth, chronic political instability and history of sub-par growth. On the
whole, PWC projections seem to be either too pessimistic for Poland (and—by proxy—
for New Europe) or too optimistic for other countries, perhaps because they do not take
into account political risks discussed later in this section.
Carone et al. (2006) long-term GDP growth and labor productivity projections for EU-25
are only slightly more optimistic than those of PWC. 9 They project that EU-10 per
capita GDP (excludes Bulgaria and Romania, but includes Malta and Cyprus) during
2004-2050 would grow at 2.6 percent a year, one percentage point above EU-15 (Table
4).
Table 4: Projected GDP per capita growth rates of EU-25, 2004-2050
Source: Carone et al. (2006)
Interestingly, Carone et al. (2006) project that owing to less favorable demographic
projections and slower productivity growth rates, New Europe’s convergence with EU-
15 would decelerate in 2031-2040 and then reverse during 2041-2050. As a result, in 2050
9In the production function approach, “projected productivity is the outcome of an extrapolation of
recent trends; of an assessment of the medium-run effects of demographics on capital deepening; and of
some long-run convergence assumptions regarding TFP (i.e. a return to the long-term historical average
for the period 1970-2005).” (Carone et al. 2006).
15EU-10 per capita GDP will reach 78 percent of EU-15 level (Table 5), down from 82
percent in 2040.
Table 5: Projected per capita GDP levels of New Europe relative to EU-15, 2004—2050
Source: Carone et al. (2006)
Poncet (2006) provides another source of long-term growth projections including a
number of New European economies. By 2050, Poland, Czech Republic, Hungary and
Romania are expected to grow at an annual rate of 1.5-1.8 percent.10 This is much below
projected growth rates for most other emerging markets. For instance, Malaysia, the
Philippines and Pakistan are expected to grow at a rate exceeding five percent a year.
Surprisingly, even some developed countries such as the U.K., Canada, Netherlands
and Sweden, are projected to grow faster than New European economies.
Poncet also provides estimates of growth until 2020: Poland would grow at 2.4 percent and the Czech
10
Republic at 2.5 percent a year.
16Table 6: Projections of real GDP growth and per capita GDP at current US$ in 2050
GDP per capita 2050 (in US$) GDP growth (%)
Philippines 21665 6,1
Malaysia 53902 5,5
Pakistan 2373 5,0
China 22177 4,6
Thailand 31115 4,6
India 4417 4,5
Indonesia 6616 4,5
South Korea 147897 4,1
Bangladesh 1163 3,4
Singapore 129479 3,3
Iran 3572 3,0
Ireland 76113 2,9
USA 93323 2,8
Peru 3759 2,7
Egypt 2285 2,6
Netherlands 57013 2,3
UK 57970 2,1
Finland 63570 2,1
Sweden 67111 2,0
Turkey 4747 1,9
Colombia 1830 1,9
Poland 14684 1,8
Argentina 7407 1,8
Greece 35732 1,8
Romania 8241 1,8
Chile 5803 1,8
Germany 48537 1,7
Mexico 5860 1,7
Portugal 25667 1,7
Czech Rep. 15978 1,7
France 39701 1,6
Spain 32324 1,6
South Africa 5629 1,6
Japan 88747 1,5
Hungary 15479 1,5
Source: Poncet (2006)
Goldman Sachs, an investment bank which evaluated Brazil, Russia, India and China
(BRICs) in its 2003 report (Wilson and Purushothaman, 2003), in 2007 expanded its
analysis beyond BRICs to include “N-11,” the next 11 countries with significant growth
potential. Strangely, no New European countries were included (Goldman Sachs,
2007).11 Poland was used only as a yardstick for comparison, which in 2050 would have
11Deutsche Bank projections (Bergheim, 2005) for 34 world economies until 2020 do not include any
countries from New Europe, either.
17a smaller economy than that of Egypt, the Philippines, Vietnam and Bangladesh. This
implies a substantially lower projected growth for Poland in future decades, given that
Poland’s GDP is today three times as big as that of Bangladesh.12 A year later, however,
Goldman Sachs has become more optimistic about New Europe, projecting that by 2030
New Europe should grow by at least two percentage points per year faster than EU-15
(Zsoldos and Zadornova, 2008). By 2050, New Europe’s level of income would only be
10-15 percent lower than in EU-15, with some New European countries being among
the wealthiest in the whole EU (Figure 7).
Figure 7: Per capita income in New Europe and EU-15 in 2050, in 2007 US$
Source: Zsoldos and Zadornova (2008)
Rapacki and Prochniak (2009) are more optimistic on the time needed for New Europe
to converge with Western Europe. If, in the future, New Europe’s growth rates were
equal to the 1997-2010 average, all New European countries would fully converge with
the EU-15 within the next 30 years; that is, by 2038 in the case of the poorest Bulgaria
(Table 7). Even with less optimistic growth assumptions, New Europe is likely to be
close to the EU-15 level of per capita income by 2050.
12According to the IMF, as of the end of 2008 Poland’s GDP in PPP amounted to $669 billion, while that
of Egypt, the Philippines, Vietnam and Bangladesh amounted to only $447, $320, $240 and $227 billion,
respectively.
18Table 7: Possible scenarios of closing the income gap between
New Europe and EU-15
Average annual
GDP per capita GDP growth Expected time in
(PPP, % of EU- (1997-2008 and years to catch-up Year of reaching
15 average in forecast for with the EU-15 the EU-15
Country 2008) 2009-10) average average
Bulgaria 35,6 5,1 30 2038
Czech Rep. 73,9 3,2 19 2027
Estonia 61 6,2 11 2019
Hungary 56,4 3,6 28 2036
Latvia 50,4 6,8 14 2022
Lithuania 55,6 6,2 13 2021
Poland 50,1 4,3 26 2034
Romania 38,5 6,2 20 2028
Slovakia 64 5,1 13 2021
Slovenia 82,4 4,1 8 2016
EU-15 100 1,6 n.a. n.a.
Source: Rapacki and Prochniak (2009)
By 2050, New Europe is likely to have reached the Western level of income, as well as
grown faster than most other emerging markets, the rather pessimistic projections cited
above notwithstanding. There are a number of reasons why this is likely to be the case.
1. Institutions are stronger in New Europe than in most emerging markets.13 Table 8
shows that the quality of New Europe’s institutions, reflected in three rankings done
by the World Bank, Heritage Foundation and Transparency International, is much
higher than in other emerging markets. Table 8 also shows that the quality of
institutions in New Europe has been improving faster than elsewhere, mostly thanks
to EU integration. This trend is likely to continue until New Europe’s quality of
institutions reaches Western European levels.
13See North (1993) and Kolodko (2000) for arguments on why high-quality institutions are indispensable
for fast long-term growth.
19Table 8: Quality of institutions in New Europe and other emerging markets
Other emerging
New Europe markets
Rank in Ease of Doing Business 2006 44,4 65,3
(World Bank) 2009 42,8 68,3
Index of Economic Freedom 1999 60,6 64,5
(Heritage Foundation) 2008 66,9 63,7
Corruption Perception Index 1999 4,3 4,4
(Transparency International) 2007 5,0 4,4
Note: Ease of Doing Business: the lower, the more favorable. Index of Economic Freedem (from 0 to 100):
the higher, the better; Corruption Perception Index (between 0 and 10): the higher, the less corruption.
“Other emerging markets:” 16 countries with an income level similar to that in New Europe: Argentina,
Botswana, Chile, Costa Rica, Croatia, Lebanon, Malaysia, Mauritius, Mexico, Oman, Panama, Palau,
South Africa, Turkey, Uruguay and Venezuela.
Source: Keereman et al. (2009) based on World Bank, Heritage Foundation
and Transparency International.
2. The quantity and quality of education in New Europe is higher than in most
emerging markets and even in some developed countries. Both quantity and quality
of education have been improving at an extraordinary rate in the last 20 years. In
2008, the tertiary scholarization ratio, measuring the proportion of young adults
aged 18-24 enrolled in tertiary education, reached almost 50 percent in New Europe.
This was only slightly below the old EU member average of 60 percent, but above
Latin American and Chinese ratio of only 30 percent and 20 percent, respectively.
The quality of education in New Europe is also high: According to the latest 2006
Organization for Economic Co-operation and Development (OECD) (2006) PISA
study, measuring the science, reading and mathematics performance of 15 year olds
in 57 countries around the world, New European countries scored above what
would be suggested by their per capita income. In the ranking on performance in
science, for instance, Estonia was in 5th place, Slovenia in 12th place and the Czech
Republic in 15th place. Other emerging markets scored much lower, with Russia
ranked 35th, Thailand 46th, Mexico 49th and Brazil 52nd. Results for reading and
mathematics performance exhibited similar patterns. In the ranking on the
combined PISA scores, Estonia, Slovenia, Czech Republic and Poland scored higher
than the EU-15 average. Hungary, Latvia and Slovakia were also better than the
United States (Figure 8).
20Figure 8: The quality of education in New Europe relative to the OECD average
Source: Zsoldos and Zadornova (2008) based on OECD.
3. New Europe is poised to receive hundreds of billions of euros in EU funding.
Until 2013, New Europe is likely to receive almost 200 billion euros; hundreds of
billions of euros are likely to flow in decades to come. The majority of these funds,
representing almost two percent of New Europe’s annual GDP, will be invested in
high-return infrastructure, human capital, innovation and Information and
Communication Technologies (ICT). Rosenberg and Serhiej (2007) estimate that
inflows of EU funds are likely to accelerate GDP growth in New Europe by up to
one percentage point a year. Allard et al. (2008) argue that EU funds financing
public investment will increase New Europe’s per capita GDP relative to the EU-15
by a sizeable five percentage points by early 2020. Varga and Veld (2009) reach
similar results. Most other emerging markets have no comparable source of
financing.
4. All countries in New Europe are set to adopt the euro within the next decade,
likely the world’s future premier reserve currency, accelerating growth per capita
and increasing macroeconomic stability. According to Schadler et al. (2006) and the
National Bank of Poland (2009), owing to higher trade and investment, lower risk
premia and the elimination of currency exchange costs, adoption of the euro would
increase GDP growth in Poland by between 0.3 and 0.7 percentage points annually.
Other countries in New Europe would benefit to a similar extent by adopting the
euro. Most other emerging markets have no comparable option.
215. New Europe’s productivity growth is mostly based on intangible investment.
Schadler et al. (2006) argue that unlike many other emerging markets, particularly in
Asia, during the last decade productivity growth in New Europe has been mainly
based on improvements in factor productivity (TFP), reflecting higher human
capital, better business organization, and more qualified management, rather than
the easier-to-achieve fixed capital investment, which also eventually runs into
diminishing returns, slowing productivity growth.
6. New Europe is inherently more stable than most emerging markets. New Europe
is likely to continue to grow faster than most emerging markets because of political,
social and ethnic stability, which substantially limits the risk of disastrous political
upheavals, social, ethnic and religious tensions and sustained periods of bad
policymaking. Social stability in New Europe is stronger than in practically all other
emerging markets, mostly due to much lower income inequality than elsewhere. The
Gini coefficient, one of the main predictors of social stability, hovers around 30 in
New Europe, while it exceeds 40 in Brazil, Russia, China, Thailand, Malaysia and in
many other emerging markets (WIDER, 2008).14 Unlike most emerging market
countries, New Europe is also ethnically and religiously homogenous. Political
stability in New Europe is particularly strong relative to most emerging markets,
and the countries are solid democracies, which are increasingly entrenched thanks
to the ongoing institutional and political integration within the EU.15 The same
cannot be said about most emerging markets, where democratic systems are either
non-existent, like in China; not stable, like in Brazil; or not well entrenched like in
Russia, Thailand or Malaysia.16
7. EU membership limits the scope for growth-damaging populist economic
policies. There is very little that New European countries can do without breaching
some of the many EU rules. It is practically impossible for EU member states to, for
instance, undermine the independence of the central bank, discriminate against
imports from other member states or provide undue advantage to local business
interests. The rule of law is also firmly established, as any breaches would be
invalidated by the European Court of Justice, whose decisions are legally binding in
member countries. Strong domestic institutions, particularly independent central
14 According to the World Bank (2006) “inequality of opportunity, both within and among nations,
sustains extreme deprivation, results in wasted human potential and often weakens prospects for overall
prosperity and economic growth.”
15 Barro (1996) finds that democracy has only a weak effect on growth. The positive effect decreases with
rising income. However, Sen (2000) argues that democracy is crucial to ensure long-term economic
stability, reduction of poverty and improved quality of life.
16 Thailand, for instance, long believed to have achieved a mature democracy, has been recently roiled by
widespread public protests and even experienced a short military dictatorship.
22banks, complement the institutional framework. The last decade showed that even
mildly populist governments such as those of Poland’s Kaczynski or Slovakia’s Fico
have become largely impotent.
The impact of the EU institutional and political straitjacket seems to be recognized by
the financial markets--until the eruption of the global crisis, the cost of debt for New
European countries was almost 100 bps points lower than suggested by standard
macroeconomic fundamentals (Luengnaruemitchai and Schadler 2007). During the
crisis this “EU halo effect” disappeared, but is likely to re-appear when the situation
stabilizes.
Practically all other emerging markets have no institutions similar to that of the EU to
restrain them from bad policymaking, as their domestic institutions are often too weak
and not sufficiently entrenched. Emerging markets are also inherently politically,
socially and ethnically much less stable than New Europe, increasing the risk of
political upheavals leading to populist economic policies, as evidenced in countries like
Brazil, Russia and India. They are likely to reoccur, particularly during the post-crisis
period of slower economic growth, which will expose deeply ingrained social, political
and religious fissures.17
Growth projections for emerging markets ignore such political and social risks.18
Instead, projections are based on extrapolating the most recent past into the future. But
the future is not likely to reflect the recent past because the Golden Decade of global
growth will not be repeated any time soon. This will increase risks to political, social,
economic and military stability, to which emerging markets are much more vulnerable
than New Europe, even though from today’s perspective such risks seem to be remote.
Even military conflicts cannot be excluded.19
17 Friedman (2006) argues that economic stagnation undermines such values as opportunity, tolerance,
generosity and democracy, leading to political and social instability. It could be surmised that economic
stagnation will be particularly dangerous for countries with weaker institutions and more pronounced
social, ethnic and religious problems.
18 PWC explicitly ignores “the possibility of major adverse shocks (e.g. political revolutions, natural
disasters or military conflicts) that could throw countries off their equilibrium growth paths for longer
periods of time, but which are inherently impossible to predict” (PWC 2008, p. 23).
19 As argued by the Harvard historian Niall Ferguson (2009), military conflicts, even on a large scale, are
quite likely in the future. Emmott (2009) argues that Asia will be particularly vulnerable to military
conflicts, given the growing rivalry between Japan, China and India. Even Latin America is not immune
to the risks of military conflicts, as reflected in the ongoing tensions between Venezuela and Colombia,
arising from a long history of military authoritarianism, political populism and intermittent coup d’états.
23The promising growth prospects notwithstanding,20 New Europe has a number of
weaknesses which could slow the speed of future convergence.
1. Productivity growth in New Europe may slow. This is mostly because, as argued
by Van Ark and Piatkowski (2009), the easy post-transformation reserves have been
almost completely exhausted. Productivity growth in the future, particularly as New
Europe’s level of productivity approaches the world’s technological frontier, will
have to increasingly rely not only on imported global know-how, but also on
domestic innovation, a feat much harder to achieve, particularly given New
Europe’s low level of innovation. New Europe is virtually non-existent in the
rankings of international patent applications (World Intellectual Property
Organization, 2009).21 It also scores low in the Global Innovation Scoreboard 2008,
the most comprehensive assessment of innovation performance of EU-27 and other
major R&D spenders in the world (Figure 9).22 New Europe’s rankings have
worsened since 1995.23
20 To the long list of New Europe’s strengths one could also add that New Europe’s economies are well
diversified, with no single country dependent on, for instance, exports of raw materials. New Europe is
therefore better insulated than others from exogenous shocks stemming from such variables as the price
of oil. New Europe will also benefit from further EU enlargement, which will possibly encompass the
Balkans, Belarus, Ukraine, Moldova and Turkey.
21 Interestingly, in 2008, for the first time a Chinese company, Huawei, topped the list of patent
applications with 1737 applications (a 20 percent increase over the previous year).
22 Argentina, Australia, Brazil, Canada, China, Hong Kong, India, Israel, Japan, New Zealand, Korea,
Mexico, Russia, Singapore, South Africa and the United States. The GIS 2008 methodology includes nine
indicators of innovation and technological capabilities, grouped in three main dimensions: Firm Activities
and Outputs, Human Resources and Infrastructures and Absorptive Capacity. Nine indicators include
patents per population (three-year average), business R&D (BERD) as a percentage of GDP, S&T tertiary
enrollment ratio, labor force with tertiary education (percentage total labor force), R&D personnel per
population, scientific articles per population, ICT expenditures per capita, Infrastructures and Broadband
penetration per population, public R&D (HERD + GERD) as a percentage of GDP.
23 See Radzikowski and Rybinski (2007) for a pessimistic view on New Europe’s ability to generate
innovations and develop intellectual capital.
24Figure 9: Global Innovation Performance, 2005
Source: Global Innovation Scoreboard 2008
2. New Europe’s population is aging much faster than most emerging markets as a
result of lower birth rates and a negative demographic cycle (Figure 10).24 Rapid
population aging is likely to negatively impact productivity growth and public
finances (The Economist, 2009). However, Carone et al. (2006) argue that while labor
productivity of individuals aged 55 and older is likely to decline, the effect on
productivity would be limited. The negative impact of aging on public finances is
mitigated by the effect of pension reforms introduced in most New European
countries, which shifted the burden from defined benefit, pay as you go (PAYG)
24The World Bank (2008) calculates there will be 18 percent fewer Bulgarians in 2025 than there were in
2000. The number of Hungarians is forecast to fall by 13 percent over the same period, while the Czech
Republic, Poland and Slovakia can expect population shrinkage of 3-5 percent. In many of the new
member states, one in five people will be over 65 by 2025 and the median age will approach 50.
25systems, to a defined contribution, private-pension funds-based system.25 However,
the negative impact of aging is exacerbated by low labor employment ratios in New
Europe, which are below the EU-15 average of 67 percent in 2007 (Poland and
Hungary had an employment ratio of only 57 percent).
Figure 10: Population aging until 2050 according to the United
Nations
Source: Rybinski et al. (2008) based on the UN.
3. New Europe’s competitiveness is not improving as rapidly as elsewhere. In the
World Economic Forum’s (WEF) Global Competitiveness Index 2008-2009, the best
New European economies—Estonia and the Czech Republic—are ranked only in
32nd and 33rd place. Poland, the region’s largest economy, is ranked 53rd. Rankings
for almost all countries in the region have worsened relative to the previous year.26
25 The European Commission projects that owing to the implemented pension reforms, public spending
on pensions in Poland in 2050 will decrease by 5.9 percent of GDP, while for EU-15 it will increase by 2.3
percent of GDP on average. However, projected spending on pensions in New European countries that
have not yet implemented full pension reforms the Czech Republic, Slovenia and Hungary— will be even
higher than in Western Europe.
26 However, the predictive power of such rankings is quite disappointing. Despite the comprehensiveness
of the Global Competitiveness Index —it aggregates more than 150 institutional, social, political and
economic factors believed to influence competitiveness and long-term growth—Vartia and Nikinmaa
(2006) provide statistical evidence that high rankings are not good predictors of future growth rates. They
find that correlation between the 1996 competitiveness rankings and average annual GDP growth rates
per capita during 1995-2003 is close to zero. Hawkins (2006) agrees, arguing that the WEF Index merely
provides useful comparative information about economic conditions and business perceptions across
economies. Other rankings’ predictive power, such as the World Bank’s Ease of Doing Business Index or
the Heritage Foundation’s Index of Economic Freedom, is likewise low.
264. It is not clear whether New Europe has any advantage in less tangible growth
factors, such as culture, ideas or beliefs, which are notoriously hard to measure. A
number of studies suggest that stronger civic participation, emblematic of
democracy, increases the public sector’s efficiency and promotes faster growth as
policymakers are held accountable for how they spend public money (see, for
instance, Casiraghi et al. 2009). This would favor New Europe, where democracy is
more deeply ingrained than in other emerging markets. However, other studies
emphasize the importance of trust and of a dense network of associations for growth
(Putnam 1993, Fukuyama 1996), seemingly favoring East Asia over New Europe,
where the level of public trust and density of social networks is low (EBRD 2007).
New Europe also seems to be disadvantaged by a relative paucity of strategic
thinking, which to a large extent is due to the inherent features of a democracy,
which usually favors short-term results over long-term ones. Such weakness,
however, can be mitigated by the implementation of strategies developed for the
whole European Union, such as the Lisbon Agenda.
Conclusions and Recommendations
New Europe has never had it so good. Income, quality of life and level of happiness
have never been closer to that of developed countries in Western Europe since at least
1500. Despite the crisis, New Europe will continue to grow faster than Western Europe
for decades to come. By 2050, New Europe’s level of per capita income is likely to match
that of Western Europe, the highest relative income level ever recorded in the history of
the region. Moreover, the overall quality of life is likely to be indistinguishable from
that in Western Europe. This is likely to herald the beginning of a new Golden Age for
New Europe.
By 2050, New Europe, already a significant global player with a combined GDP about
the same size as that of Brazil and Russia, is also likely to achieve a higher level of per
capita income than most emerging market countries. While emerging market economies
may grow faster for some time, they are nonetheless much more vulnerable than New
Europe to political, social and economic Black Swans, catastrophic events which could
wipe out much of the economic progress.
Such catastrophic events are likely as the world will increasingly face three trends,
which in the past have almost always led to wars and economic retardation: (i) the rise
of new powers upsetting the world’s balance of power; (ii) ongoing depletion of world’s
resources, particularly water and oil; and (iii) growing emancipation of the world’s
poor, who will increasingly demand a louder voice in global affairs and a bigger share
of the world’s economic pie. As argued by Kolodko (2010) in his theory of coincidental
growth, most dramatic events in economic history occur during a rare combination of
circumstances which produce a perfect economic storm. New Europe, safely ensconced
27in the legal framework of the European Union, insulated from global financial
speculation by the euro and defended by its NATO allies, will be much less exposed to
these rising dangers than most emerging markets. New Europe may grow slower in the
next 40 years, but nonetheless achieve more.
The Golden Age, however, will not arrive without help from policymakers. The crisis
showed that the current New European growth model based on domestic consumption
fueled by imported savings, large FDI inflows, especially into non-export oriented
markets such as financial services or real estate, and high imports supported by
appreciating real exchange rates, has been undermined. In the post-crisis world inflows
of foreign financing are likely to substantially diminish. The new model should
combine the best characteristics of the New European model, i.e., openness to trade,
high quality of human capital and advanced institutional framework, with those of the
East Asian model, particularly higher savings rates, controlled exchange rate
appreciation and diversified exports. The crisis provides a good opportunity to
implement needed change.
To ensure fast long-term growth, apart from the standard recommendations of
maintaining macroeconomic stability, improving public administration and enhancing
public infrastructure, New European policymakers should consider the following
policy prescriptions:
1. Increase domestic savings to raise investments, lessen reliance on imported savings
and bring current accounts under control. Tighten fiscal policy to increase public
savings and allow taxes to go up as well as down to strengthen public finances. Tax
incentives for investment in non-productive assets such as real estate should be
removed. To increase tax revenues, New Europe should consider coordinating
personal and corporate taxation through, for instance, introduction of a minimum
regional tax rate.27 The EU’s Stability and Growth Pact, which has not worked well,
should be complemented with strong domestic fiscal frameworks to ensure that
countries conduct anti-cyclical policies, i.e., they build fiscal surpluses during good
times to be spent during bad times. Introduction of independent fiscal watchdogs,
modeled on the American Congressional Budget Office or the Swedish Fiscal Policy
Council, would be helpful. Incentives for private savings should also be
strengthened, including through pension reforms.
2. Re-emphasize labor productivity growth to offset negative effects from lower
inflows of foreign financing. As argued by van Ark and Piatkowski (2009), since the
easy post-transition productivity growth reserves have been largely exhausted, to
27Piatkowski (2009) argues that introduction of a minimum corporate tax rate of 15 percent in the Central
and Eastern European region, still much lower than in Western Europe, would likely limit tax
competition and thus safeguard tax revenues without negatively affecting FDI. See also Piatkowski and
Jarmuzek (2008) for a similar discussion.
28ensure fast productivity growth in the future, New Europe will need to further
enhance the quality of education, increase innovation and improve infrastructure.
With labor productivity already exceeding half of the Western European level, New
Europe needs not only to enhance absorption of imported technology, but also
increasingly rely on domestic innovation. Inflows of Foreign Direct Investment
(FDI), an important contributor to enhancing productivity, should continue to be
attracted, but be directed more towards export-oriented rather than non-tradable
sectors such as retail and wholesale trade, real estate and financial services. On the
EU level, New Europe should continue to support full opening of the EU’s labor and
service markets to increase EU-wide competition and enhance incentives for
innovation.
3. Strengthen financial sector supervision and lessen reliance on foreign banks. The
crisis has shown that the fragmentation of the EU’s financial sector’s supervision
first contributed to and then worsened the crisis. It is in New Europe’s interest to
support creation of a single pan-European financial sector supervisory body to
equilibrate interests of the owners of capital from Western Europe with its recipients
in Central and Eastern Europe. As argued by Akerlof and Shiller (2009),
strengthened financial supervision would also help mitigate excesses and
irrationality of financial markets. New Europe should also strive to lessen its
reliance on foreign banks. One of the lessons of the crisis is that—as opposed to what
often has been said by apologists of globalization--capital does have nationality,
with foreign banks favoring lending in mother countries during the crisis rather
than in New European subsidiaries. To increase control over credit growth, improve
the banking sector’s stability and conduct anti-cyclical lending policy, foreign banks
operating in New Europe should be complemented with local private and public
banks, similar to PKO BP in Poland or OTP in Hungary.
4. Diversify exports away from European Union markets, which now represent more
than 80 percent of New European exports, towards fast-growing markets in Asia,
Latin America and Africa. This would help insulate New Europe from local
exogenous shocks and increase resilience towards changing European business
cycles. Diversification could be achieved through an expanded use of export credit
guarantees, partnership agreements with other world regions to promote access to
local markets and support for FDI inflows from other emerging market countries.
5. Adopt the euro as quickly as possible, at a competitive exchange rate. Adopting
the euro is a unique opportunity available only to New Europe, which would
accelerate growth and reduce vulnerabilities. The crisis has shown that the benefits
of a sovereign monetary policy are largely illusory, as the presumed monetary
independence is undermined by the need to defend currencies against speculative
attacks and attract sufficient foreign financing for the public and private sector.
Floating exchange rates have proved beneficial, helping to absorb external shocks,
29but have also been a source of macroeconomic instability by weakening public,
corporate and household balance sheets. Choosing a competitive exchange rate is
particularly important to ensure that it doesn’t slow growth and undermine
competitiveness, such as was the case in Portugal before and Slovakia now. As
argued by Rodrik (2008), weak currencies have been one of the driving engines of
growth in East Asia for decades, offsetting weaknesses inhibiting growth. Like in
East Asia, New Europe should ensure that the pace of real exchange rate
appreciation of their currencies, before and after the euro adoption, doesn’t outstrip
the pace of improvement in price competitiveness. Western Europe should help
New Europe adopt the euro as quickly as possible by being more flexible on the
euro entry criteria, which in the current form do not encourage growth (Piatkowski,
2008). Together, the whole EU should strive to strengthen the euro so that one day it
replaces the U.S. dollar as the premier global reserve currency (Piatkowski and
Rybinski, 2009).
6. Increase labor participation and open borders to immigration to slow population
aging, increase the development of skills and improve productivity. New Europe
should increase the effective retirement age for both men and women to closer to 70
years by eliminating early retirement schemes, increasing statutory retirement ages
and enhancing incentives for lifelong employment. Retirement age should be linked
to rising life expectancy. Tax and legal barriers to employment should be lowered.
Telework and outsourcing should be actively promoted, including through tax
subsidies, particularly for the elderly. On immigration, New Europe should fully
open borders to immigration, particularly in the neighboring countries of Eastern
Europe, with immigrants offered a road to citizenship, subject to language and legal
employment tests. Immigration would bring similar economic benefits to those
enjoyed in Western European countries attracting New European labor (Kahanec
and Zimmermann, 2009). In the rising global strategic competition for human
resources, New Europe should not remain passive. Large immigration is inevitable
and it is better to manage it now to ensure the greatest benefits.
7. Promote further integration and enlargement of the EU. New Europe has a unique
opportunity to be a part of the historically unprecedented and amazingly successful
integration of the European continent, which most other regions of the world will
try to emulate. New Europe has much to gain in an economic, social and political
sense by more deeply integrating itself with Western Europe, the second largest
economy in the world. New Europe can bring itself to bear on global affairs only
through the European Union, and it would also be in its interest if the Union was
enlarged to include the remaining countries in the Balkans, Eastern Europe and
Turkey. Further EU enlargement would expand the zone of economic prosperity
and political stability, providing new economic opportunities and mitigating
political risks. The crisis should provide a new sense of common purpose for all
Europeans and a unifying theme that we are all in this together.
308. Support enhanced global cooperation and multilateralism. The crisis has shown
that New Europe, still on the periphery, is exposed to shocks imported from abroad
more than developed countries in the center of the global economy. To mitigate the
negative effects of the peripheral status, such as a high risk of sudden capital stops,
New Europe should support strengthening of global financial institutions, starting
with the IMF and the World Bank. The former has had a particularly positive
contribution to lessening the impact of the current crisis in New Europe by
providing financial support in the region when private markets shut down. New
Europe, however, should also support regional financial initiatives, complementing
the Bretton Woods institutions, such as the Asian Chiang Mai Initiative or the
European Commission’s Balance of Payments Facility. The more sources of crisis
financing, the better. It is also in the interest of New Europe to support new
multilateral forums such as G-20, where peripheral countries can finally have their
say in global affairs. Given that its combined GDP rivals that of Russia and Brazil,
the region should strive to have its own representative in G-20. Poland, the star
performer during the last 20 years of transition and the current crisis, with an
economy substantially larger than that of Argentina, Saudi Arabia or South Africa,
would fit the bill well.
31You can also read