TECH@RISK The Domestic Innovation, Technology Deployment, Manufacturing, and Jobs at Risk in Stepping Away from Global Leadership on Clean Cars ...
←
→
Page content transcription
If your browser does not render page correctly, please read the page content below

TECH@RISK
The Domestic Innovation, Technology Deployment,
Manufacturing, and Jobs at Risk in Stepping Away
from Global Leadership on Clean Cars
The BlueGreen Alliance unites America’s largest labor unions and its most influential

             environmental organizations to solve today’s environmental challenges in ways that

                          create and maintain quality jobs and build a stronger, fairer economy.

Authors:
Zoe Lipman
Mia Veltri

Analysis:
Dave Cooke, Union of Concerned Scientists
Zoe Lipman, BlueGreen Alliance
Roxanne Johnson, BlueGreen Alliance
Michelle Manson, BlueGreen Alliance

Acknowledgments:
The BlueGreen Alliance would also like to thank Luke Tonachel at the Natural Resources Defense Council and Steve Beers at the United
Autoworkers for their technical review. Thanks to Eric Steen and Abby Harvey at the BlueGreen Alliance for their assistance in editing and
production, and to the BlueGreen Alliance’s partners for their support and review.

Design by Winking Fish. • Cover Photo by Sam VarnHagen/Ford Motor Co.

Errors remain the responsibility of the authors.
CONTENTS
Executive Summary.............................................................................................................................. 3

I. Introduction: A History of Building Cleaner Vehicles and American Jobs.................... 4

II. Vehicle Standards, Manufacturing, and Jobs Today............................................................. 5

     Real-World Deployment....................................................................................................................... 5

III. Proposed Rollback Threatens Industry Gains........................................................................ 6

IV. The Impact of a Rollback on Technology Deployment, Manufacturing, and Jobs...... 9

     Different Models Tell Different Stories........................................................................................10

     What We Found ....................................................................................................................................10

     Detailed Results.....................................................................................................................................11

        Engine Technology..................................................................................................................................... 12

        Transmission Technologies...................................................................................................................... 14

        Hybrid and Electric Vehicle Technologies.......................................................................................... 16

        Accessories and Materials....................................................................................................................... 18

V. Negative Impact on Domestic Innovation and U.S. Competitiveness
     in Key Emerging Technologies...................................................................................................20

VI. Conclusion.......................................................................................................................................22

Appendix A: Methodology...............................................................................................................23

Endnotes................................................................................................................................................24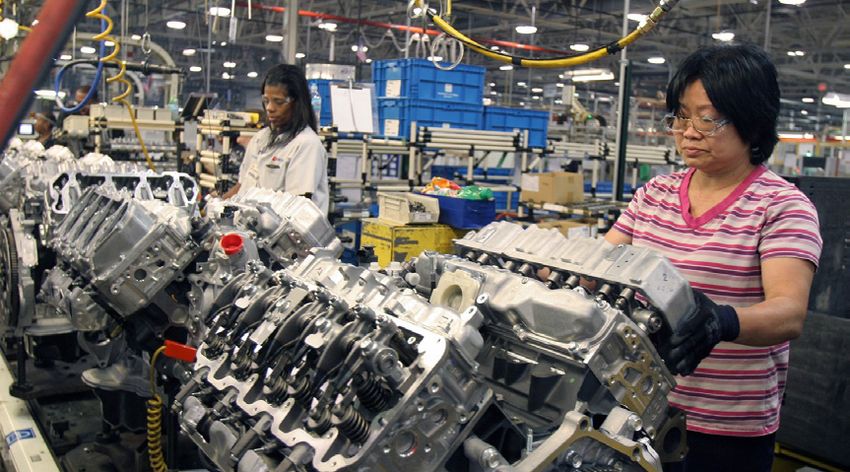
2 Tech@Risk | The Domestic Innovation, Technology Deployment, Manufacturing, and Jobs at Risk in Stepping Away from Global Leadership on Clean CarsPhoto Courtesy of ArcelorMittal
EXECUTIVE SUMMARY
Policy matters.                                                                  The threat appears particularly acute for those that
                                                                                 make the most advanced technologies and materials,
Between 2007 and 2016, the United States’ commitment                             but a rollback threatens jobs and investment across the
to a new generation of fuel economy improvement and                              industry. These immediate impacts understate the longer-
greenhouse gas (GHG) emissions reduction in the massive                          term impact of losing the competitive technology edge to
passenger vehicle sector helped transform manufacturing                          other nations. Stepping back from leadership on efficiency
in America. Automakers didn’t just rebuild from a recession,                     and emissions reductions in the global vehicle sector
they rebuilt to produce vehicles that were far cleaner,                          means both U.S. jobs lost making the advanced engines,
more efficient, and more globally competitive, while                             transmissions, components, and materials that consumers
simultaneously maintaining the performance, safety, and                          count on to deliver fuel savings in popular SUVs, cars, and
design innovation that customers demand. Doing so spurred                        trucks today, and jobs and business opportunities lost in
more rapid retooling of automaker facilities and required                        building the domestic supply chain in emerging and electric
enhanced purchase of advanced technology from thousands                          vehicle technology for today and tomorrow. Our analysis
of suppliers. In past research and reports the BlueGreen                         finds between 89,000 and 202,000 of tomorrow’s jobs
Alliance has identified the suppliers of this technology                         would be lost or foregone as a result of the rollback.
across the nation.

Since 2017, however, the                     Our analysis vividly illustrates that—regardless
administration has proposed—and
is expected shortly to finalize—
                                             of the modeling approach used—flatlining the
standards that dramatically reduce           standards in 2020 significantly slows adoption of
requirements for continued
efficiency improvements in
                                             advanced technologies in almost every vehicle
passenger cars, SUVs, and trucks             subsystem and cuts demand for products made
and undermine states’ ability
to spur additional demand
                                             by hundreds of manufacturers and hundreds of
for advanced vehicles. The                   thousands of workers all across the country.
administration’s own analysis of
their proposal finds that halting
the advance of standards at 2020 levels would cut demand       At a time when nations worldwide are moving aggressively
for advanced clean and efficient automotive technology,        to capture the jobs and economic benefits of rapidly
components, and materials by approximately $30 billion a       changing vehicle technology, the U.S. too must use all
year and result in 60,000 fewer jobs in the auto industry.     the tools at its disposal to lead in technology innovation,
                                                               investment, manufacturing, and good job creation.
In this report, we unpack these topline statistics and look in
detail at the impact of less stringent standards on demand     To secure jobs and manufacturing growth in the highly
for clean vehicle technologies and the companies that          competitive global automotive industry the U.S. will
build them. We look both at today’s vehicle technology         need to complement strong vehicle standards with smart
manufacturing jobs that may be impacted if standards are       trade, tax, and manufacturing policies. But making policy
weakened, and estimate the impact on future jobs and           decisions now that actively disincentivize innovation and
job growth in the industry. Our analysis vividly illustrates   investment in advanced vehicle technology in America—
that—regardless of the modeling approach used—flatlining       such as choosing to rollback industry leading clean
the standards in 2020 dramatically slows adoption of           vehicle standards—puts the United States at a profound
advanced technologies in almost every vehicle subsystem        disadvantage and will cost manufacturing and jobs today
and cuts demand for products made by hundreds of               and tomorrow.
manufacturers and hundreds of thousands of workers all
across the country.                                            It is not yet too late to take a smarter path.

     The Domestic Innovation, Technology Deployment, Manufacturing, and Jobs at Risk in Stepping Away from Global Leadership on Clean Cars | Tech@Risk   3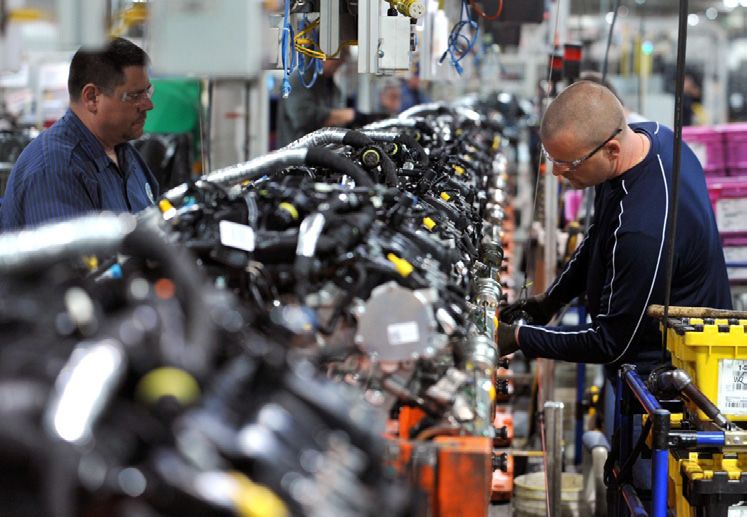
TECH@RISK

I.        INTRODUCTION: A HISTORY OF BUILDING
          CLEANER VEHICLES AND AMERICAN JOBS
In 2007, the passage of a major bipartisan                 that these investments would be made in the                    their commitment to pursuing global
energy bill—the Energy Independence                        United States. Workers in the automotive                       technology leadership.6 Degradation
and Security Act of 2007 (EISA)—set in                     sector continue to be impacted by incentives                   of standards here in the United States
motion a new generation of fuel economy                    embedded in trade policy, for example,                         would create a disadvantage for U.S.
rulemaking, and was the first significant                  that have encouraged offshoring and other                      companies in a rapidly advancing global
forward movement on vehicle efficiency                     declines in manufacturing over the past                        marketplace. Unfortunately, exactly
in the United States since the 1970’s oil                  several decades. Recent reinvestment in the                    at this time of economic challenge, the
crisis. In accordance with EISA, federal                   United States to meet leading standards and                    administration has proposed to step away
rulemakings in 2010 and 2012 put                           build a new generation of more fuel-efficient                  from policy leadership. This puts American
in place a schedule for fuel economy                       vehicles has demonstrated progress in the                      competitiveness, manufacturing, and jobs
improvement through 2025 and codified a                    opposite direction.                                            at risk.
groundbreaking approach, often referred
to as the “One National Program,” under                    A strong, certain, and globally leading                        Over the past decade the industry has
which the U.S. Environmental Protection                    regulatory framework has ensured the                           invested towards an anticipated strong,
Agency (EPA), U.S. Department of                           market certainty needed for long-term                          increasing vehicle GHG and fuel economy
Transportation (DOT), and the California                   investment in advanced vehicle technology                      trajectory through 2025. This report
Air Resources Board (which had also set                    manufacturing in the United States. This                       looks in detail at the potential impacts of
standards for 2009-2016), develop and                      framework—alongside loan and tax support                       a rollback on the advanced automotive
promulgate coordinated standards across                    to facilitate manufacturing investments—                       supply chain.
their separate regulatory obligations.1 This               has underpinned a revival in domestic
process was designed to ensure long-                       automotive innovation and a significant                        In the sections that follow, we briefly
term certainty, consistency, and clarity                   recovery in automotive manufacturing                           review the mechanics of how clean vehicle
for the industry. It enabled automakers                    and jobs. The industry’s profitability                         standards work to increase jobs and the
and suppliers to develop and build a                       and competitiveness globally have also                         footprint of the clean vehicle manufacturing
single fleet that meets federal vehicle fuel               been transformed.3 As of 2018, jobs                            supply chain in the United States today.
economy and GHG rules—and state vehicle                    brought back in motor vehicle and parts                        Using two different approaches to
emission standards—at once. Under these                    manufacturing accounted for more than                          predicting how automakers would achieve
policies, the nation has seen a decade of                  35 percent of all net manufacturing sector                     the previously promulgated 2025 fuel
dramatic improvement in vehicle efficiency,                jobs restored since the recession.4 The auto                   economy and GHG goals, we then analyze
emissions reductions, and oil and consumer                 industry has added more than 730,000                           and discuss the impacts of a rollback on
cost savings.2                                             direct jobs since mid-2009, nearly 340,000                     demand for specific technologies, and
                                                           of these in manufacturing. This represents                     how that would affect the companies and
In addition, the drafters of EISA also                     54 percent growth since the recession low                      workers who make them.
included explicit measures to help promote                 point in 2009.5
domestic manufacturing of cleaner and
more fuel-efficient vehicles and technology.               However, the challenges to U.S. leadership
They recognized that a new generation                      in vehicle technology and manufacturing
of stronger standards would spur a new                     are by no means over. China and the
generation of innovation and investment                    European Union (EU) have set ambitious
in both technology and manufacturing, but                  goals to meet even stronger fuel economy
that—given a simultaneous crisis in U.S.                   and GHG standards over the next decade.
manufacturing—there was no guarantee                       China and others have demonstrated

 4      Tech@Risk | The Domestic Innovation, Technology Deployment, Manufacturing, and Jobs at Risk in Stepping Away from Global Leadership on Clean Cars
II.             VEHICLE STANDARDS, MANUFACTURING,
                AND JOBS TODAY
Since 2010, there have been numerous                     to which those investments in technology                       Today, the United States is a global leader in
studies predicting the impact of increasing              and manufacturing are made in the United                       engineering and manufacturing advanced
fuel economy and GHG standards on                        States. In either case, job growth is still                    vehicle technologies. Strong long-term
jobs and manufacturing. These economic                   significant—especially within the industry.7                   fuel economy and GHG standards have
models consistently find that the standards                                                                             spurred innovation and job growth and
are expected to increase jobs through                    The most recent study of this nature                           strengthened the manufacturing sector
two mechanisms. First, when consumers                    looking just at the latest round of standards                  as a whole. Domestic motor vehicle and
and businesses drive more fuel-efficient                 from 2017-2025 found the existing                              parts manufacturing is the nation’s largest
vehicles, they save significant fuel and                 standards would create 100,000 more jobs                       manufacturing sector, directly employing 1
money, which they spend throughout the                   in 2025 and 250,000 more jobs in 2035                          million workers today9, with employment at
economy. This boost in consumer spending                 throughout the economy.8                                       auto suppliers up 19 percent since 2012.10
increases jobs throughout the economy.                                                                                  In 2017, a BlueGreen Alliance and NRDC
                                                                                                                        study found 288,000 American workers—
Second, the standards spur investment
                                                         Real-World Deployment                                          in 1,200 factories and engineering
in new and added innovative technology                   In addition, since 2011, a number of                           facilities in 48 states—building the specific
within the auto industry. Added or enhanced              researchers have tracked the real-world                        technologies that improve vehicle fuel
technology on every vehicle means added                  deployment and manufacturing of clean                          efficiency.11 These facilities are producing
labor hours—and thus more jobs—to                        vehicle technology, and have seen the                          some of the world’s most innovative
develop and build that technology. Whether               innovation, investment, manufacturing, and                     automotive technologies for an ever more
standards increase U.S. manufacturing                    job growth predicted in economic models                        competitive global marketplace.
jobs a little or a lot depends on the extent             play out across the industry.

                                  Figure 1: Suppliers Of Fuel-Efficient Vehicle Technology –
                                            More Than 1200 Facilities Nationwide

                                                                                                                                  Engine Technology
                                                                                                                                  Transmission Technologies
                                                                                                                                  Hybrid and Electric
                                                                                                                                  Vehicle Technologies
    Source: BlueGreen Alliance and Natural                                                                                        Accessories and Materials
    Resources Defense Council, Supplying
    Ingenuity II: U.S. Suppliers of Key Clean, Fuel-
    Efficient Vehicle Technology

                       The Domestic Innovation, Technology Deployment, Manufacturing, and Jobs at Risk in Stepping Away from Global Leadership on Clean Cars | Tech@Risk   5
Similarly, the 2018 U.S. Energy and
Employment Report, which directly surveys
automotive industry employers, found
that 23 percent of automotive suppliers
stated that 100 percent of their revenue
came from technology that improves fuel
efficiency.12 This is 6 percent higher than
the previous year’s report.13

The current standards have created market
certainty necessary for both automakers
and suppliers to feel confident in longer-
term investments in emerging technologies.
Many suppliers have already planned for, and

                                                                                                                                                                         Photo Courtesy of Ford Motor Co.
invested in, production and development
of technologies designed for automakers to
meet the standards through 2025.14

Anchoring the growth of the supplier
industry, U.S. automakers have also
invested robustly over the past decade,
both in added vehicle technology and in
their facilities directly. Looking just at                 100 factories since 2008, with a further                       of that investment—$87.6 billion—has been
assembly plants, and automaker-owned                       42 investments at 37 facilities promised                       or is planned to be invested in the United
engine, transmission, and stamping                         or underway through 2020.15 Similarly,                         States.16 While a portion of this investment
facilities, a 2018 BlueGreen Alliance                      according to the Center for Automotive                         is business as usual, much represents added
report found that automakers have                          Research, between 2009 and 2017                                or enhanced investment to meet globally
invested $76 billion in facilities across the              automakers announced $119.5 billion in                         leading standards.
country, completing 258 investments at                     investments in North America. Two-thirds

III.                 PROPOSED ROLLBACK
                     THREATENS INDUSTRY GAINS
In August of 2018, the EPA and the National                jobs.17 Figures 2a and 2b show the                             In addition, the proposal threatens to
Highway Traffic Safety Administration                      agencies’ analysis of the impacts of the                       dissolve the partnership between the
(NHTSA) released a notice of proposed                      rollback (of both the NHTSA–administered                       federal and state agencies, throwing
rulemaking (NPRM) to significantly relax                   fuel economy standards, and the EPA-                           coordination, certainty, and U.S. technology
the car and truck efficiency and emission                  administered vehicle GHG standards,                            leadership under the One National Program
standards. In the proposed rule—entitled                   respectively) on technology spending and                       into disarray.
“The Safer Affordable Fuel-Efficient Vehicles              labor hours in every year.
Rule for Model Years 2021-2026 Passenger                                                                                  NHTSA’s jobs analysis uses a similar
Cars and Light Trucks”—the agencies put                    Unfortunately, these estimates                                 approach to that used by economic
forward varying options for the rollback of                significantly underestimate the likely                         modelers looking at direct impacts to the
the current standards, with the preferred                  negative impacts of the proposed rule                          industry. The agencies project significantly
option freezing the standards at 2020 levels.              on jobs and the economy. They do not                           lower spending on technology and translate
                                                           include any jobs lost elsewhere in the                         that into reduced industry revenues.
In the NPRM, the agencies own analysis                     economy as consumers lose gas savings,                         They then associate a number of jobs at
shows the new rule would result in billions                nor do they reflect the other harms to U.S.                    automakers and suppliers with every dollar
less annually in technology investment                     competitiveness and jobs should lagging                        of revenue.
and, as a result, approximately 50,000 to                  standards and uncertainty drive innovation
60,000 fewer American manufacturing                        and investment abroad.

 6      Tech@Risk | The Domestic Innovation, Technology Deployment, Manufacturing, and Jobs at Risk in Stepping Away from Global Leadership on Clean Cars
A number of studies have been undertaken                      released an analysis that found the                          manufacturing, and employment in
confirming the direction of these results.                    proposed—much weaker—rule would                              the United States. We compare the
The Motor & Equipment Manufacturers                           support 60,000 fewer job-years in 2025,                      technologies that would have been
Association (MEMA) contracted with IHS                        and more than 125,000 fewer jobs years                       deployed by automakers under the current
Markit to model the impacts of a regulatory                   in 2035. The Synapse models also indicate                    standards if implemented through 2025
rollback and found, “the agencies’ preferred                  that flat lining of the standards in 2020                    in contrast with their deployment under
alternative 1 of zero percent increases                       will reduce GDP and eliminate many of the                    the agencies’ proposed rule that would
year-on-year through 2026 would result in                     anticipated economic benefits generated                      halt required fuel economy and GHG
a loss of 67,000 direct automotive industry                   under the augural standards.19                               improvement in 2020. We then connect
jobs” with a “full impact” of “500,000                                                                                     these technologies with the American
direct, indirect, and induced jobs by 2025,                   In the following sections, we review the                     manufacturing facilities that build them.
in comparison to the employment levels                        effect of the rollback in more detail and
supported by the augural standards.”18                        examine the specific impacts of weakening
Similarly, in September 2018, Synapse                         the standards on technology deployment,

                                     Figure 2A: Rollback Of
                                                         of Fuel
                                                            Fuel Economy
                                                                 Economy Standards:
                                                                         Standards,
                              Agency Estimate
                                      Impactsof
                                              OnImpacts
                                                  Technology
                                                         on Technology
                                                              Cost And Labor
                                                                       Cost and
                                                                             Hours
                                                                                Labor Hours

                 Spending on Technology (Technology Costs)                                                           Domestic Labor Hours
                     and Beyond MY 2016 (in billions)                                                                 (1000s of Job-Years)
                              Standards                              Change                               Standards                                 Change
                     Baseline          Proposed
                     (Under            (Under
                     current           “preferred
                     “augural”20       option”                             Percentage                                                                          Percentage
                     standrads         freezing                              change in       Baseline (Current      Proposed                                     change in
                     through           standards in        Difference      technology        “augural”              (Preferred         Difference in             domestic
                     2025)             2020)                     in $B       spending        standrads)             option)            job-years               labor hours
       2017          $4 Billion        $2 Billion         –$2 Billion           -41%         1170 (1,170,000) 1170                     0                                0%
       2018          11                5                              -6        -53%         1210                   1200               -10 (-10,000)                   -1%
       2019          16                7                             -10        -58%         1240                   1220               -20                             -1%
       2020          25                10                            -15        -59%         1260                   1240               -30                             -2%
       2021          35                11                            -24        -68%         1290                   1240               -50                             -4%
       2022          40                12                            -28        -70%         1300                   1250               -50                             -4%
       2023          43                12                            -30        -71%         1310                   1250               -60                             -4%
       2024          44                12                            -32        -72%         1310                   1250               -50                             -4%
       2025          46                12                            -34        -73%         1310                   1250               -50                             -4%
       2026          48                13                            -35        -73%         1310                   1260               -60                             -4%
       2027          47                13                            -34        -73%         1310                   1260               -50                             -4%
       2028          47                13                            -34        -72%         1320                   1260               -50
                                                                                                                                       -60                             -4%
       2029          46                13                            -33        -72%         1320                   1260               -60                             -4%
       2030          45                13                            -33        -72%         1320                   1270               -60                             -4%
       Cumulative undiscounted reduction
       in technology spending 2017-2030                             -350 Billion             Industry supports 50–60,000 fewer jobs starting in 2021

       Adapted from NPRM Table VII-5, Federal Register page 43265

                          The Domestic Innovation, Technology Deployment, Manufacturing, and Jobs at Risk in Stepping Away from Global Leadership on Clean Cars | Tech@Risk   7
Figure
Figure2A:
2B:Rollback
RollbackOf
of Fuel
Vehicle
Economy
GHG Standards:
Standards,
Agency Estimate
Impacts On Technology Cost And Laborand
of Impacts on Technology Cost Labor Hours
Hours
Spending on Technology (Technology Costs) Domestic Labor Hours
and
Beyond
Beyond
MYMY2016
2016(in(in
billions)
billions) (1000s of Job-Years)
Standards Change Standards Change
Baseline Proposed
(Under (Under
current
Baseline “preferred
"preferred
“augural”
(Under option”
option" Percentage
Percent Percentage
Percent
standrads
existing freezing change in Baseline (Current Proposed change in
through
standards standards in Difference technology “augural”(Existing
Baseline (Preferred Difference in domestic
2025)2025)
thru 2020) in $B spending standrads)
standards) option) job-years labor hours
2017 $4 Billion
3 $2 Billion
2 –$2 Billion
-1 -41%
-48% 1170 (1,170,000) 1170 0 0%
2018 11
9 5
4 -6 -53%
-61% 1210 1200 -10 (-10,000) -1%
2019 16
15 7
5 -10 -58%
-64% 1240
1230 1220 -20 -1%
2020 25
21 10
7 -15
-14 -59%
-68% 1260 1240
1230 -30
-20 -2%
2021 35
30 11
8 -24
-21 -68%
-71% 1290
1280 1240 -50
-40 -4%
-3%
2022 40
34 12
9 -28
-25 -70%
-74% 1300
1290 1250
1240 -50
-40 -4%
-3%
2023 43
38 12
9 -30
-29 -71%
-76% 1310
1290 1250 -60
-50 -4%
2024 44
40 12
9 -32
-31 -72%
-78% 1310
1290 1250 -50 -4%
2025 46
42 12
9 -34
-33 -73%
-79% 1310
1300 1250 -50 -4%
2026 48
46 13
9 -35
-37 -73%
-80% 1310 1260
1250 -60
-50 -4%
2027 47
48 13
9 -34
-39 -73%
-81% 1310 1260 -50
-60 -4%
2028 47
50 13
9 -34
-40 -72%
-81% 1320 1260 -50
-60 -4%
-5%
2029 46
50 13
9 -33
-41 -72%
-82% 1320 1260 -60 -4%
-5%
2030 45
50 13
9 -33
-40 -72%
-81% 1320
1330 1270
1260 -60 -4%
-5%
Cumulative undiscounted reduction
in technology spending 2017-2030 -350 Billion
-367 Industry supports 50
50–60,000
- 60,000fewer
fewerjobs
jobsstarting
startingin
in2021
2021
Adapted from NPRM Table VII-26,
VII-5, Federal
FederalRegister
Registerpage
page43265
43291
8 Tech@Risk | The Domestic Innovation, Technology Deployment, Manufacturing, and Jobs at Risk in Stepping Away from Global Leadership on Clean CarsIV. THE IMPACT OF A ROLLBACK
ON TECHNOLOGY DEPLOYMENT,
MANUFACTURING, AND JOBS
Achieving higher fuel economy and cutting of technologies to achieve the same result. In order to calculate the impact of a
GHG emissions requires innovation across For example, between 2010 and 2016, Ford rollback on individual technologies, we
a variety of vehicle systems. In fact, there chose to utilize a more efficient engine utilize the same computer models that
are many possible ways for different design and a much lighter aluminum body to the agencies use to assess the feasibility
automakers that make different types of achieve fuel economy improvements in the and cost of proposed vehicle standards.
cars, SUVs, and trucks to meet any given F150 pickup. At the same time, GM chose These models simulate the entire fleet of
fuel economy target. more modest lightweighting, and added new vehicles in America and predict the
mild hybrid assist to the advanced engine in lowest cost technological pathways for
The diagram below (Figure 3) provides its Silverado pickup21. For both automakers every automaker (given their particular
an example of the kinds of technologies the innovations enabled the company to mix of vehicles) to achieve compliance
that could be used by a manufacturer of meet fuel economy targets and provide with fuel economy and GHG standards in
pickup trucks, for example, to improve fuel improvements to vehicle performance. every year. When the estimates for every
economy and cut emissions. To achieve Over the past decade, we’ve seen how vehicle are rolled together, the model
different levels of emissions reduction, a strong and smartly structured standards provides an estimate of how much of each
manufacturer might choose to use just one have encouraged innovation across all fuel efficiency-related technology is used
or several of the technologies. And different types of vehicles and across a wide range of throughout the fleet. The model allows us
manufacturers might use different groups technologies. to see the difference between technologies
Figure 3: Examples of Vehicle Components That Improve
Fuel-Efficiency and Cut Emissions
GASOLINE DIRECT TURBOCHARGING LIGHTWEIGHT HYBRID
INJECTION Global market NEW: 48 V MILD MATERIALS POWERTRAIN
8% of new vehicles in expected to grow HYBRID SYSTEMS High-strength steel: Mitsubishi Electric,
2010, 46% in 2015. 10% per year Delphi, ArcelorMittal, AK Allison
Keihin, Stanadyne, through 2025. Continental Steel; Aluminum Transmission,
Auto OEMs BorgWarner, Bosch Arconic, Novelis GM Components
Carbon fiber: SGL Holdings
Automotive Carbon,
CYLINDER Toray Carbon Fiber
DEACTIVATION
Utilization has
doubled 2010-
2015. Eaton,
Schaeffler Group EV/ PHEV
PROPULSION
Battery systems:
LG Chem, Mahle
START/STOP Behr Electric
COMPONENTS AND ELECTRIC POWER Motors: Magna
SYSTEMS 8+ SPEED STEERING Electronics, Remy
Not used in 2010, in TRANSMISSIONS Nexteer, JTEKT LOW RESISTANCE Electronic
7% of new vehicles in In 2010 companies ROLLING TIRES Controllers: UQM
2015, rapidly were adding 6-8 OTHER ADVANCED Goodyear, Technologies,
expanding use. speed transmissions, TRANSMISSIONS/ Bridgestone, Renesas Wiring:
Johnson Controls, now 8-10 speeds. CVT JATCO, Xtrac, Michelin Leoni, Sumitomo
Maxwell Technologies Aisin, Auto OEMs Auto OEMs Electric
Note: Many additional US manufacturers produce each of these technologies. Indicators of growth are drawn from agency, industry and press reports.
Source: BlueGreen Alliance and Natural Resources Defense Council,
Supplying Ingenuity II: U.S. Suppliers of Key Clean, Fuel-Efficient Vehicle Technology
The Domestic Innovation, Technology Deployment, Manufacturing, and Jobs at Risk in Stepping Away from Global Leadership on Clean Cars | Tech@Risk 9that would be used to meet the current In both cases we look at what technology each major vehicle system, the companies
standards that continue to increase thru would be deployed under the existing which make those technologies in our data,
2025 and by contrast how much more or or “augural” standards as compared to and their location nationwide.
less technology would be used in the case of a rollback scenario where required fuel
the agencies’ preferred alternative in which economy improvements halt in 2020. We Our analysis vividly shows that regardless
standards stop increasing in 2020. then compare those results with our data on of the modeling approach used, flatlining
the manufacturing facilities across America the standards in 2020 significantly slows
that build these technologies. adoption of advanced technologies in
Different Models Tell almost every vehicle subsystem, and cuts
Different Stories In reality, each automaker chooses how demand for products made by hundreds of
they will comply with standards. They manufacturers and hundreds of thousands
The models that the agencies use to create could choose either of these pathways or of workers all across the country.
a picture of the automotive sector rely on still others that were not modeled by the
extensive industry data that automakers agencies. But in either approach, we find Today, approximately 326,000 Americans
report, and decades of research by the a rollback means much less technology work nationwide in the facilities that
agencies, technical experts, and others deployed. manufacture the technologies we review
about advanced technology innovation,
in this report. But these companies and
deployment, and costs in the sector. At the
facilities are not uniform. Many of these
same time, however, the models can reflect What We Found companies have already invested in R&D
very different assumptions about how the
The Volpe model tracks technologies and plant and equipment and have hired or
technology will be deployed. NHTSA uses
critical to fuel economy improvement plan to hire new staff to meet the demand
the “CAFE Compliance and Effects Model”,
in major technology categories. Not all for new technology anticipated under the
known as the “Volpe Model,” to estimate the
technologies’ use increases as standards existing and augural standards. Others had
outcomes of changes to the rule. NHTSA’s
rise, some less advanced technologies (e.g. planned to invest or expand in the near
2018 Volpe modeling for the NPRM has
6-speed automatic transmissions) would be future. Some will face stranded spending
been criticized by many experts for changes
replaced by newer technology (e.g. 8- and or assets should there be major changes to
to approach relative to previous modeling
10- speed transmissions) and thus decline. the existing and augural standards, while
done by NHTSA and EPA to support the
In the case of a rollback, investments in others may not see expected growth. Some
2016 Technical Assessment Report and the
these less advanced technologies continue, of the companies in our data make just one
previous midterm review of the standards.
while investment in the new technology or a few of these technologies, and whether
In order to look at manufacturing and is reduced or halted. Overall, however, demand increases or decreases for specific
jobs impacts under both approaches we in line with industry findings of far lower technologies is likely to have profound
compare the results from two different technology spending, we find significant effects. Others make multiple technologies,
runs of the Volpe model—the one used growth foregone. A rollback means much including some that may increase while
by NHTSA in the current NPRM, and one less technology deployed and less future others decline.
that utilizes assumptions that more closely demand for the companies that build them.
simulate those used by the agencies in 2016 In our analysis we associate each
for the joint draft technical assessment The charts in the following sections show technology, and the degree to which it is
report (TAR).22, 23 Major differences what percentage of the vehicle fleet would anticipated to increase or decline, with the
between the models include the inclusion use key technologies under each deployment manufacturing facilities that make those
or exclusion of state Zero-Emission model if standards increase through 2026, technologies and an estimate of their
Vehicle requirements, assessments of the versus if they are flatlined in 2020. The exposure to changes in demand for fuel
complexity and availability of cylinder charts show impact on key technologies in efficiency related technologies.
deactivation and transmissions, differences
in assumptions around the cost and
effectiveness of these same technologies,
assumptions around whether automakers Our analysis vividly illustrates that—regardless
will increase or decrease the performance of the modeling approach used—flatlining the
of vehicles, and the use of different baseline
vehicle fleets. standards in 2020 significantly slows adoption of
advanced technologies in almost every vehicle
subsystem and cuts demand for products made
by hundreds of manufacturers and hundreds of
thousands of workers all across the country.
10 Tech@Risk | The Domestic Innovation, Technology Deployment, Manufacturing, and Jobs at Risk in Stepping Away from Global Leadership on Clean CarsFigure 4: Estimated Impacts of Fuel Economy Standards and Rollback
by Type of Vehicle Technology
Number Of Future
Number U.S. Vehicle
Of U.S. Technology
Number of Manufacturing Employment Manufacturing Jobs
Companies Facilities At These Projected Future Lost Or Foregone
Potentially Potentially Facilities Job Growth Under Under Weaker
Impacted Impacted Today Existing Standards Standards
Engines and engine components 42 97 149,000 +16,000 to +71,000 -16,000 to -71,000
Transmission technology24 16 32 25,000 0 to -1000 0 to +1000
Hybrid and electric technology 170 213 69,000 +26,000 to +91,000 -26,000 to -91,000
Accessories and mass reduction 85 235 83,000 +41,000 to +48,000 -41,000 to -48,000
TOTAL 326,000 +89,000 to +202,000 -89,000 to -202,000
When we calculate the impact of changes
in demand for the specific technologies
identified on the share of workers at
each type of company likely to be highly
vulnerable to technology shift, we
find between 89,000 and 202,000 of
tomorrow’s jobs lost or foregone as a
result of the rollback.
A summary of our results by major vehicle
technology type are found in Figure 4,
above.
Again, these jobs estimates only reflect
Photo Courtesy of Ford Motor Co.
the nearest-term impacts of loss of future
investment in advanced vehicle technology
due to relaxing vehicle standards. They
do not include impacts that might result
from changes to the competitiveness of
the industry, or to location of production
overall, as technology changes globally.
Detailed Results
Figures 5–8 on the pages that follow When we calculate the impact of changes in
show the impact of changes to the
existing/augural standard on major demand for the specific technologies identified on
vehicle subsystems and technology. the share of workers at each type of company likely
to be highly vulnerable to technology shift, we find
between 89,000 and 202,000 of tomorrow’s jobs
lost or foregone as a result of the rollback.
The Domestic Innovation, Technology Deployment, Manufacturing, and Jobs at Risk in Stepping Away from Global Leadership on Clean Cars | Tech@Risk 11Engine Figure 5a: Engine Technology Deployment in the New Vehicle
Fleet in 2032 Under Existing/Augural Standards That Increase
Technology Through 2025, and Under the Agencies’ “Preferred Option”
As shown in Figure 5a, very few
Freezing Standards at 2020 Levels
engine technologies in any modeling
scenario are required to be deployed NPRM Model
uniformly across the fleet, indicating
Low-friction lubricants (level 1)
that manufacturers have a diverse
assortment of powertrain options to Low-friction lubricants (level 2)
meet any future standards. However, it
is clear when comparing the 2020 and Low-friction lubricants (level 3)
2025 modeling results that there is a
dramatic drop-off in investment in more Variable Valve Timing
expensive and complex technologies.
Variable Valve Lift
For example, 24-bar turbocharged-
Augural
downsized (TDS) engines see a 20-30 Cylinder Deactivation Rollback
percent penetration when meeting the
Difference
2025 standards, but that drops below Advanced Cylinder Deactivation
10 percent when the standards are held
at 2020 levels, with that leading to more Stoichiometric gasoline direct injection
penetration of the less advanced 18-bar
Turbocharged and downsized (18-bar)
TDS engines. There is also a dramatic
drop in stoichiometric gasoline direct Turbocharged and downsized (24-bar)
injection, from near ubiquity when
meeting the 2025 standards (80-90 Cooled exhaust gas recirculation (EGR)
percent) to levels barely above the
Atkinson + Miller Cycle
current fleet penetration if standards
are held at 2020 levels (see Figure 9).
Advanced diesel
-40 -20 0 20 40 60 80 100
TAR Model
Low-friction lubricants (level 1)
Low-friction lubricants (level 2)
Low-friction lubricants (level 3)
Variable Valve Timing
Variable Valve Lift
Existing Standards
Cylinder Deactivation Rollback
Difference
Advanced Cylinder Deactivation
Stoichiometric gasoline direct injection
Turbocharged and downsized (18-bar)
Turbocharged and downsized (24-bar)
Cooled exhaust gas recirculation (EGR)
Atkinson + Miller Cycle
Advanced diesel
-40 -20 0 20 40 60 80 100
12 Tech@Risk | The Domestic Innovation, Technology Deployment, Manufacturing, and Jobs at Risk in Stepping Away from Global Leadership on Clean CarsFigure 5b: Selected Companies Manufacturing Engines and Engine
Technologies in the U.S. and Their Location
Our data shows
42 companies
manufacturing advanced
engine technology at
97 locations in the
United States.
These facilities employ
approximately 149,000
American workers.
Our analysis suggests
that 16,000 to 71,000
future jobs in this sector
could be lost or foregone
should the nation move
away from the ongoing
fuel economy and GHG
increases in the existing/
augural standards.
Achates Power Cooper Standard Ford Motor Company Keihin Schaeffler Group USA
American Axle & Manufacturing Cummins Turbo Technologies General Motors Kia Motors Senior Flexonics
Autocam Corporation Dana Incorporated Hitachi Automotive Systems Magneti Marelli USA Stanadyne
BMW Manufacturing Co Delphi Technologies Americas, Inc. Modine Manufacturing Subaru
Borg Warner Denso Manufacturing Honda of America Nissan North America TE Connectivity
Manufacturing
Borg Warner Morse TEC Eaton Praxair Surface Technologies TI Automotive
Honeywell Transportation
Bosch EFI Automotive PurePower Technologies Toyota Motor Manufacturing
Systems
Continental Automotive FCA (Fiat Chrysler Ricardo Tula Technology
Hyundai Motor Manufacturing
ContiTech Thermopol Automobiles) US LLC Rotomaster Valeo
Volvo Car: U.S. Operations
The companies listed here
may also manufacture other
advanced clean or fuel-efficient
technologies. In addition, our
dataset is not comprehensive.
It is likely that additional
companies and facilities
manufacture these technologies
in the United States.
This analysis is an estimate
of the impact of regulatory
changes on sub-sectors of the
industry. It does not predict
impacts on any specific company
or location.
Photo Courtesy GM by Skip Peterson for DMAX
The Domestic Innovation, Technology Deployment, Manufacturing, and Jobs at Risk in Stepping Away from Global Leadership on Clean Cars | Tech@Risk 13Transmission Figure 6a: Transmission Technology Deployment in the New
Vehicle Fleet in 2032 Under Existing/Augural Standards That
Technologies Increase Through 2025, and Under the Agencies’ “Preferred
As was the case for engines, Figure
Option” Freezing Standards at 2020 Levels
6a shows that there is a broad array
of transmission technologies that can NPRM Model
be deployed to meet future vehicle
standards. And again, what is observed Six-speed automatic transmission (AT)
is that a reduced standard results in
greater penetration of lower-tech Eight-speed AT
Augural
solutions and less deployment of more Rollback
advanced technologies. This is most Nine/ten-speed AT Difference
pronounced in the TAR modeling runs,
which shows less than 10 percent Improved AT internals
penetration of the most common
transmission seen today, a 6-speed Continous variable transmissions (CVT)
automatic, while freezing standards at
2020 levels would see a fleet retaining Advanced CVT
more than 40 percent adoption, similar
to today’s levels. This also holds true Six-speed dual clutch transmission (DCT)
when comparing continuously variable
transmissions, which have seen growth Eight-speed DCT
over the past decade in response to
strong standards. These trends are less Five-speed manual transmission (MT)
pronounced in the NPRM results due
to the pathway approach of the NPRM Six-speed MT
Volpe model that leads the fleet to
adopt transmission technologies with Seven-speed MT
less consideration of individual cost or
effectiveness.25 -30 -20 -10 0 10 20 30 40 50 60 70 80
Overall, shifts in the stringency of the TAR Model
standards result in shifts amongst
transmission technologies often Six-speed automatic transmission (AT)
manufactured by the same companies,
and thus in only modest impacts on Eight-speed AT
employment. Under strong standards
we would expect to see increased Nine/ten-speed AT
labor hours as companies deploy more
advanced transmissions with greater Improved AT internals
content, and deploy more types of
transmissions. Our methodology does Continous variable transmissions (CVT) Existing Standards
not allow us to make this granular
Rollback
a distinction amongst transmission Advanced CVT Difference
technologies, however. If it did, we
might expect to see modest losses Six-speed dual clutch transmission (DCT)
rather than gains under a rollback in this
technology category. Eight-speed DCT
Five-speed manual transmission (MT)
Six-speed MT
Seven-speed MT
-30 -20 -10 0 10 20 30 40 50 60 70 80
14 Tech@Risk | The Domestic Innovation, Technology Deployment, Manufacturing, and Jobs at Risk in Stepping Away from Global Leadership on Clean CarsFigure 6b: Selected Companies Manufacturing Transmissions and
Transmission Technologies in the U.S. and Their Location
Our data shows
16 companies are
manufacturing
transmission technology
at 32 locations in the
United States.
These facilities employ
approximately 25,000
American workers.
Our analysis suggests
that the sector could gain
0 to 1,000 jobs should the
nation move away from
the ongoing fuel economy
and GHG increases in
the existing/augural
standards.
Aisin World Corporation of Ford Motor Company NHK of America Suspension The companies listed here This analysis is an estimate
America Components (NASCO) may also manufacture other of the impact of regulatory
General Motors
advanced clean or fuel-efficient changes on sub-sectors of the
Borg Warner Tremec
Hilite International technologies. In addition, our industry. It does not predict
Dana Incorporated Xtrac dataset is not comprehensive. impacts on any specific company
Honda of America
Efficient Drivetrains Manufacturing ZF It is likely that additional or location.
companies and facilities
Fallbrook Technologies, Inc Hyundai Powertech manufacture these technologies
FCA (Fiat Chrysler Keihin Carolina System in the United States.
Automobiles) US LLC Technology (KCST)
Photo by: Sam VarnHagen/Ford Motor Co.
The Domestic Innovation, Technology Deployment, Manufacturing, and Jobs at Risk in Stepping Away from Global Leadership on Clean Cars | Tech@Risk 15Hybrid and Figure 7a: Hybrid and Electric Vehicle Technology Deployment
in the New Vehicle Fleet in 2032 Under Existing/Augural
Electric Vehicle Standards That Increase Through 2025, and Under the Agencies’
“Preferred Option” Freezing Standards at 2020 Levels
Technologies
The electrified powertrains NPRM Model
technologies identified in Figure 7a
12V stop-start
tend to be more costly compared to
other technology options, and as a 48V mild hybrid
consequence are likely to be one of
the last to be chosen, according to the P2 strong hybrid electric vehicle (HEV)
model’s “effective cost” algorithm.
Therefore, these technologies are some Power split strong HEV
of the most susceptible to changes in
Plug-in HEV (PHEV)
the stringency of the program, which
is borne out in the modeling results in Full battery electric vehicle (BEV) Augural
Figure 7a. This is especially pronounced Rollback
in the NPRM results, for which the Fuel cell electric vehicles Difference
modeling assumes more than half the
Battery management systems
vehicle fleet will need to adopt strong
or mild hybridization in response to the
Lithium Ion batteries (Li-ion)
current standards. In contrast, under
a freeze at 2020 levels, virtually no Advanced batteries (Li-sulfur, metal-air, etc)
mild or strong hybridization would be
EV power electronics - inverters,
required, and levels of start-stop would rectifiers, motor controllers, converters
barely budge above today’s levels. EV power electronics -
However, given the rapid reduction in onboard battery charging systems
battery costs over the past five years, EV Propulsion components -
electric motors and generators
these technologies are expected to
become increasingly affordable. While -40 -30 -20 -10 0 10 20 30 40
the TAR model does not predict that
automakers would utilize nearly as TAR Model
high levels of hybridization to meet
12V stop-start
the standards, stepping away from
standards that drive investment in these 48V mild hybrid
advanced technologies would, in either
case, represent a major step backward P2 strong hybrid electric vehicle (HEV)
in the technologies expected to be
Power split strong HEV
critical to the future of the industry
beyond 2025.
Plug-in HEV (PHEV)
Full battery electric vehicle (BEV) Existing Standards
Rollback
Fuel cell electric vehicles Difference
Battery management systems
Lithium Ion batteries (Li-ion)
Advanced batteries (Li-sulfur, metal-air, etc)
EV power electronics - inverters,
rectifiers, motor controllers, converters
EV power electronics -
onboard battery charging systems
EV Propulsion components -
electric motors and generators
-40 -30 -20 -10 0 10 20 30 40
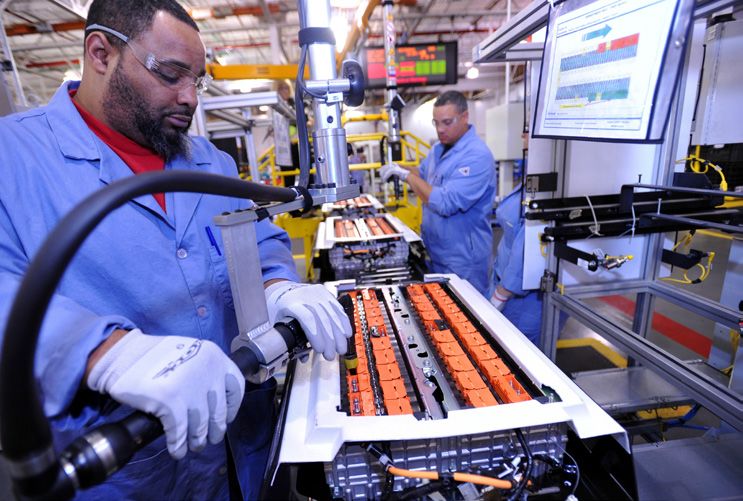
16 Tech@Risk | The Domestic Innovation, Technology Deployment, Manufacturing, and Jobs at Risk in Stepping Away from Global Leadership on Clean CarsFigure 7b: Selected Companies Manufacturing Hybrid and Electric
Technologies in the U.S. and Their Location Our data shows
170 companies
manufacturing hybrid
and electric vehicle
technology at
213 locations in the
United States.
These facilities employ
approximately 69,000
American workers.
Our analysis suggests
that 26,000 to 91,000
future jobs in this sector
could be lost or foregone
should the nation move
away from the ongoing
fuel economy and GHG
increases in the existing/
augural standards.
3M Corporation Coulometrics Honda of America Manufacturing Pellion Technologies Texas Mineral Resources
A123 Systems Coveris Advanced Coatings II VI Marlow Pi Innovo Corporation
AC Propulsion Curtis Instruments Inmatech Planar Energy Texmac
ACTIA US Daikin Innova EV Plug Power TIC Automotive Systems
ADVICS Manufacturing Dana Incorporated Johnson Controls Polaris Industries Toray Fluorofibers
Airbiquity Daramic Johnson Matthey Fuel Cells PolyPlus Battery Company TreadStone Technologies
Albemarle Delco Remy K2 Energy Solutions Powerex Umicore Autocat USA
AllCell Technologies Delphi Technologies Karma Automotive Prayon UQM Technologies
Alta Motors DENSO KEMET Corporation Prieto Battery VIA Motors International
Altair Nanotechnologies Dexmet Corporation Kimball Electronics Group Primet Precision Voltronix
ALTe Dreamweaver International Kongsberg Automotive Proton Onsite Wells Vehicle Electronics
American Lithium Energy DuPont LG Chem Michigan Pyrotek Wildcat Discovery Technologies
Corporation EaglePicher Technologies Linde Group QuantumScape Wolfspeed
Amprius East Penn Manufacturing Livent Corporation RAPA LP XALT Energy
Analog Devices Eaton Cooper Bussman Lucid Motors Renesas Electronics Corporation XG Sciences
Andromeda Interfaces Elegus Technologies Magna Electronics Rinehart Motion Systems ZAF Energy Systems
Applied Nanotech EnerG2 MAHLE Behr Rivian Automotive Zero Motorcycles
Arcimoto Enevate Mainstream Engineering Robert Bosch Battery Systems LLC ZF
Ardica Technologies Entek Materion Tech Materials Romeo Systems ZincFive
Atomized Products Group Evans Capacitor Company Maxim Integrated Products Sakti3
Axion Power International Federal-Mogul Systems Protection MaxPower Samsung SDI The companies listed here
BASF Ford Motor Company Maxwell Technologies SBE Electronics may also manufacture other
BASF Catalysts Forge Nano Mercedes-Benz US International Seeo advanced clean or fuel-efficient
BASF Toda America Freudenberg NOK (MBUSI) Sendyne Corporation technologies. In addition, our
Bender Midtronics dataset is not comprehensive.
Fujitsu Electronics America Sensata Technologies
It is likely that additional
Bettergy G&S Titanium Mitsubishi Electric Sevcon companies and facilities
Borg Warner General Motors Myers Motors Showa Denko Carbon manufacture these technologies
Bosch GeneSiC Semiconductor NEI Corporation Silatronix in the United States.
Brammo Gentherm NetGain Motors SiNode Systems
Cadenza Innovation GKN Driveline Nissan North America Sion Power Corporation This analysis is an estimate
Café Electric Glatfelter Nitto Automotive Solid Power of the impact of regulatory
Caleb Technology Corporation Gotion NOHMs Technologies SolidEnergy Systems changes on sub-sectors of the
California Lithium Battery Novarials industry. It does not predict
Green Gears Soltex
impacts on any specific company
CAMX Power GS Yuasa Nuvera Fuel Cells Solvay or location.
Celgard Hemlock Semiconductor Group NXP Semiconductor Soulbrain
Chargetek Henkel Electronics Materials Oak-Mitsui Sumitomo Electric
Chasm Advanced Materials Hitachi Automotive Systems Optodot TE Connectivity
Continental Automotive Americas Panasonic Tesla Motors
CoorsTek Fluorochemicals Hollingsworth and Vose Paraclete Energy
The Domestic Innovation, Technology Deployment, Manufacturing, and Jobs at Risk in Stepping Away from Global Leadership on Clean Cars | Tech@Risk 17Accessories Figure 8a: Accessory and Materials Technology Deployment
in the New Vehicle Fleet in 2032 Under Existing/Augural
and Materials Standards That Increase Through 2025, and Under the Agencies’
Technologies that reduce vehicle and
“Preferred Option” Freezing Standards at 2020 Levels
accessory load are at the other end
of the spectrum from electrification. NPRM Model
Many of these represent some of the
most cost-effective means to improve Electric Power Steering
efficiency and are strongly adopted
under all scenarios. However, the Electrification of accessories and
most advanced technologies in this high-efficiency alternator
space could see large reductions in
deployment as a result of a freeze Low-Drag Brakes
at 2020 levels, including next-
generation materials development for
Secondary Axle Disconnect
lightweighting and rolling resistance
reduction, as well as advanced
aerodynamics. Aerodynamic drag reduction
It is important to note that the Volpe
model does not project usage of Lower Rolling Resistance Tires Augural
specific lightweight materials, but Rollback
rather the share of vehicles achieving Difference
Lightweighting*: High-strength Steel
increasing levels of mass reduction—up
to 20 percent mass reduction of the
vehicle body. We have assumed that Lightweighting: Aluminum
increasingly high levels of lightweighting
require the use—at least in part—of high Lightweighting: Carbon Fiber
strength lightweight steel, aluminum,
and carbon fiber, respectively, in -100 -75 -50 -25 0 25 50 75 100
line with National Academy of
Sciences assumptions with respect to TAR Model
effectiveness and cost.26 This data does
not project the exact share or intensity
Electric Power Steering
of use of different materials within what
are now and will continue to be multi-
Electrification of accessories and
material vehicles. high-efficiency alternator
Low-Drag Brakes
Secondary Axle Disconnect
Aerodynamic drag reduction
Existing Standards
Lower Rolling Resistance Tires
Rollback
Difference
Lightweighting: High-strength Steel
Lightweighting: Aluminum
Lightweighting: Carbon Fiber
-100 -75 -50 -25 0 25 50 75 100
*See discussion at left on allocation of lightweight materials to mass reduction categories.
18 Tech@Risk | The Domestic Innovation, Technology Deployment, Manufacturing, and Jobs at Risk in Stepping Away from Global Leadership on Clean CarsFigure 8b: Selected Companies Manufacturing Efficient Accessories
and Mass-Reduction Technologies in the U.S. and Their Location Our data shows
85 companies
manufacturing fuel-
efficient accessories
and advanced materials
at 235 locations in the
United States.
These facilities employ
approximately 83,000
American workers.
Our analysis suggests
that 41,000 to 48,000
future jobs in this sector
could be lost or foregone
should the nation move
away from the ongoing
fuel economy and GHG
increases in the existing/
augural standards.
3M Corporation Bridgestone Americas Hitachi SRG Global The companies listed here
A. Schulman Buehler Motor Hitachi Metals America Stahl Specialty may also manufacture other
advanced clean or fuel-
Accuride Corporation Constellium JTEKT North America Steel Dynamics efficient technologies. In
ADVICS Manufacturing Continental Kyosan DENSO Manufacturing Sumitomo Rubber USA addition, our dataset is not
Aisin Drivetrain Continental Structural Plastics, Lear Corporation Superior Essex comprehensive. It is likely
Inc. that additional companies and
AK Steel Materia Superior Graphite facilities manufacture these
Akebono Brake Corporation Continental Tire Michelin North America Superior Industries technologies in the United
Alcoa Cooper Tire and Rubber Modine Manufacturing TE Connectivity States.
Company
Aleris Rolled Products Nemak ThermoAnalytics
Corvac Composites This analysis is an estimate
American Axle and Neuman Aluminum Impact Topre America of the impact of regulatory
Manufacturing Covestro Extrusioin Toray Carbon Fibers changes on sub-sectors of the
American Showa Cytec Carbon Fibers New Process Steel industry. It does not predict
Toyota Boshoko Tennessee
American Synthetic Rubber Dana Incorporated Nexteer impacts on any specific
Truelove & Maclean (T&M) company or location.
Company DENSO Novelis U.S. Steel Corporation
ArcelorMittal Dicastal North America NSK Steering Systems America Valeo
Arconic Eberspaecher Oliver Rubber Company Von Roll U.S.A.
Associated Fuel Pump Systems Electric Fan Engineering Plasan Carbon Composites
Corporation Wescast
Faurecia Posco Americas
Benteler Automotive Windings
Ford Motor Company Pro-Tec Coating
Bodine Aluminum - Toyota Worthington Industries
General Motors SGL Group
Borg Warner ZF Chassis Systems
GKN Driveline Sika Corporation
Bosch ZF TRW North America
Goodyear Tires Solvay
Bowling Green Metalforming, a Hino Motors (Commercial
Magna company Spartan Light Metal Products
truck division of Toyota)
The Domestic Innovation, Technology Deployment, Manufacturing, and Jobs at Risk in Stepping Away from Global Leadership on Clean Cars | Tech@Risk 19V. NEGATIVE IMPACT ON DOMESTIC
INNOVATION AND U.S. COMPETITIVENESS
IN KEY EMERGING TECHNOLOGIES
Our analysis, discussed above, shows direct • A rollback would result in a clear Furthermore, while meeting existing
negative impacts of a rollback on investment reduction in the pace of technology standards through 2025 does not require
and jobs across vehicle systems. Looking development and deployment across high levels of hybrid or electric vehicle
at individual technologies more closely, diverse technologies, but with penetration, the proposal to dramatically
however, our data suggests several additional particularly extreme impacts on the lower 2025 targets—plus failing to set
ways in which a rollback could threaten the newest and most advanced technologies higher targets through 2030 and proposing
strength of the U.S. automotive sector. just entering the market. to limit states’ authority to set zero
emission vehicle targets—sends a signal
The two models whose outputs we Looking at advanced conventional that the United States will not be a major
review are estimates that predict future technology, all these analyses show player in the electric vehicle market. It
deployment of technology. Meanwhile, the that there is still extensive opportunity discourages investments in technologies
U.S. EPA’s Light-Duty Automotive Technology, to deploy conventional technologies like battery cell production, which will be
Carbon Dioxide Emissions, and Fuel Economy within the fleet, and that a rollback essential to ensuring we capture the jobs
Trends 1975-2017 Report (known as would stop that trajectory far short of and manufacturing benefits of global shifts
the annual “Trends Report”) as well as full deployment. For more advanced in vehicle technology over the next decade.
the technical record for the rulemaking, technologies, a rollback could mean the
document the actual past adoption of these difference between developing robust Countries around the world are racing to
technologies under the standards to date. domestic manufacturing capacity in the capture the economic benefits of producing
Looking across both sets of data, we can United States and ceding that investment the next generation of cleaner and more
see the broader role standards (and the elsewhere. efficient vehicle technology. Stepping
rollback) play in innovation. away from standards that provide the
We also note that this data does not show certainty that manufacturers need to
In Figure 9 we show the actual and technologies for which there is near zero invest in and build leading technology in the
predicted deployment of four important deployment today, but which under strong United States puts the auto sector—and
fuel economy and emissions reducing standards were expected to grow. These particularly domestic employment in the
technologies between 2010 and 2025. emerging technologies include important sector—in jeopardy, in the short, medium,
What we see are three consistent themes: enablers of increased hybrid and electric and long term. It is essential that the United
vehicle deployment—such as 48-volt power States maintains and increases its capability
• Even well known and available electronics—but also highly innovative to produce these technologies domestically,
technologies—such as turbocharging, conventional engine technologies, such as and that fuel economy, GHG emissions
which has been used to improve an opposed piston gasoline engine currently reduction, manufacturing, and trade policies
performance for decades—are not being demonstrated delivering over 35mpg all support that trajectory.
widely deployed to improve fuel in a pickup truck.27
economy in the absence of increasing
standards. And even when those
technologies become fairly widely
deployed (turbocharging is now
used in more than 25 percent of
vehicles to achieve both efficiency and
performance gains) cutting standards
results in sharp slowdowns in further
deployment.
• Under the existing standards,
automakers and suppliers have
developed, manufactured, and adopted
new and advanced technologies at a
steady rate and would be projected
to continue to do so should standards
continue along the current trajectory.
Photo Courtesy Achates Power
20 Tech@Risk | The Domestic Innovation, Technology Deployment, Manufacturing, and Jobs at Risk in Stepping Away from Global Leadership on Clean CarsYou can also read