Taking care of businesses - Market Indicators Research Report | 2016 AUCKLAND METROPOLITAN OFFICE - Scoop
←
→
Page content transcription
If your browser does not render page correctly, please read the page content below

Market Indicators
Research Report | 2016

AUCKLAND METROPOLITAN OFFICE

Taking care of
businesses

Accelerating success.
"Business is booming in Auckland
– driving tenant demand for office
 space in Metropolitan Auckland
      to an eight year high."
Contents
Introduction                                    1
Key Findings                                    1
Market Indicators Table                        2
Corporate Real Estate Trends                   3
The Bigger Picture                             5
Market Indicators Map                          6
City Fringe                                    7
North Shore                                    7
West Auckland                                  8
Southern Corridor                              8
Auckland South                                 9
Sales Activity                                 10
Infrastructure Update                          10
Leasing Activity                               11
Development Update                             11
Outlook                                        12

  www.colliers.co.nz/Find-Research

  Join our LinkedIn group:
  Colliers International New Zealand Network
" More supply of office
  space is on the horizon."

Introduction
Business is booming in Auckland – driving tenant demand for office
space in Metropolitan Auckland to an eight year high. This pushed
the vacancy rate to 6% which could have gone lower, reaching critical
point like the CBD, had developers not taken care of businesses by
building more space to accommodate the demand.

More supply is on the horizon, which will be of relief to many tenants
who readied themselves early to take advantage of the situation.
However, not all tenants are in a position to move or drive favourable
leasing rates. The dispersion of the supply throughout Auckland
suggests some demand and supply imbalances may remain.

A lack of stock and competitive pricing is being fuelled by owner-
occupiers and ‘yield-hungry’ investors and syndicators. Recent
expectations of interest rates to stay low will see further pressure
on purchasers. Some view the new price levels as untenable, but
the fear of missing out is promoting greater levels of acceptance,
facilitating a new wave of asset appreciation.

Key Findings
>>Total metropolitan office supply reached more than 1.7 million                 >>Approximately 120,000 sqm of more supply is on its way to
  square metres in 2016. Developers built 20,300 sqm of new space                  Metropolitan Auckland which will help the sector avoid a critical
  in the past 12 months.                                                           shortage of non-CBD office supply that would hamper the growth
                                                                                   of arguably New Zealand’s major economic employment zone of
>> The growth in demand as well as supply has increased net absorption             small to medium sized businesses.
   rates, pushing vacancy to an eight-year low of 6.2%, with
                                                                                 >>Only some precincts and tenants will see greater levels of oppor-
   approximately 106,000 sqm of available space. If all of the space
                                                                                   tunity as developers face the on-going issue of finding suitable land
   was leasable, it would be absorbed in just two years under current
                                                                                   capable of development. If more land was available, it is likely that
   employment growth rates.
                                                                                   more supply would be built despite the pressure on feasibility from
>> Vacancy rates in the City Fringe, Southern Corridor, West Auckland              construction costs.
   and Auckland South are at cyclical lows of 7%, 8%, 6% and 7%                  >>With no clear advantage between landlords and tenants in a more
   respectively. The North Shore has the lowest vacancy rate at just 4%.           balanced environment in the medium term, rents will likely
                                                                                   increase between 1% and 4% annually over the next few years.
>> There is little evidence to suggest that the metropolitan office sector
                                                                                   This is lower than previous upswing cycles, which reached double
   will deviate from its current growth path. Businesses are moving
                                                                                   digits in some cases.
   away from the status quo and are realistic about their future plans,
   taking on more calculated risks.                                              >>The sound property fundamentals supporting the metropolitan
                                                                                   office market has elevated the already high levels of competition
>>There is still some way to go before many of the buildings are                   amongst investors, owner-occupiers and syndicators. A new wave
  completed. This may cause some uncomfortable positions for                       of asset appreciation is forecast as conditions continue to promote
  tenants in the short-term if enquiries are left too late.                        sales activity.

                                                                             1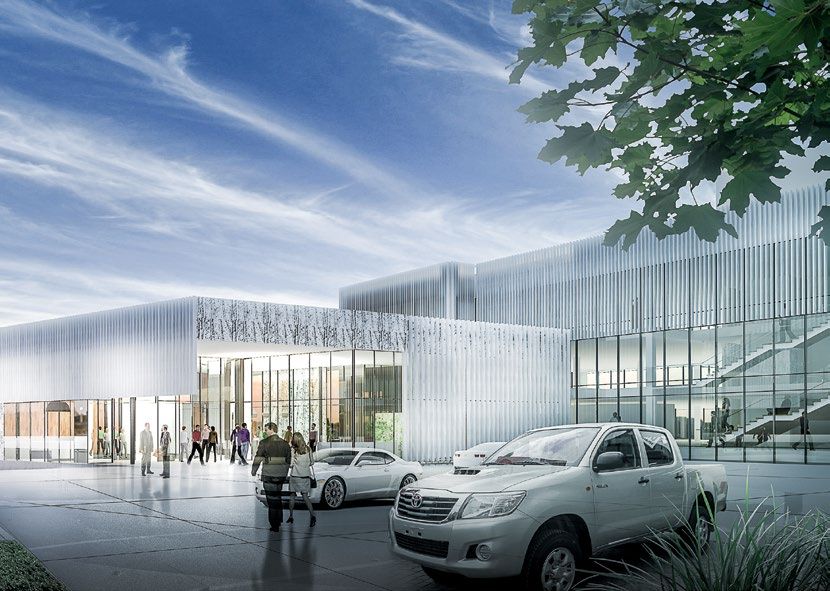
Auckland Metropolitan Office Market Indicators Q2 2016
Vacancy Outgoings* Incentives Capital Value** Market Yields
Precinct Grade Net Face Rents ($/m² pa)
Rate (%) ($/m² pa) (%) ($/m²) (%)
LOW HIGH LOW HIGH LOW HIGH
A 285 350 60 - 95 5-8 3,565 5,000 7.00% 8.00%
Takapuna 3.6% B 240 320 60 - 80 8 - 10 2,665 4,265 7.50% 9.00%
C 220 240 45 - 60 12 - 16 2,315 2,745 8.75% 9.50%
A 240 285 55 - 70 5-8 3,000 4,070 7.00% 8.00%
Albany 3.2%
B 230 270 45 - 60 8 - 10 2,555 3,600 7.50% 9.00%
North Shore
A 270 295 45 - 65 5-8 3,600 4,540 6.50% 7.50%
Mairangi Bay 5.0% B 240 275 45 - 65 8 - 10 3,000 3,930 7.00% 8.00%
C 220 235 40 - 55 12 - 18 2,445 2,850 8.25% 9.00%
A 235 250 50 - 60 5-8 2,940 3,570 7.00% 8.00%
North Harbour 4.9% B 225 240 50 - 60 8 - 10 2,725 3,200 7.50% 8.25%
C 200 220 45 - 55 12 - 18 2,050 2,445 9.00% 9.75%
North Shore New Build A 320 390 70 - 100 8 - 10 4,130 5,570 7.00% 7.75%
A 315 375 65 - 85 10 - 15 4,345 5,770 6.50% 7.25%
Newmarket 8.6% B 220 290 55 - 75 10 - 15 2,665 4,000 7.25% 8.25%
C 160 195 45 - 60 12 - 18 1,780 2,295 8.50% 9.00%
A 230 300 50 - 60 10 - 15 2,970 4,285 7.00% 7.75%
Grafton 7.5% B 190 230 45 - 50 10 - 15 2,110 2,875 8.00% 9.00%
C 155 210 45 - 50 12 - 18 1,475 2,210 9.50% 10.50%
A 230 300 55 - 65 10 - 15 2,970 4,285 7.00% 7.75%
K'Road 11.1%
C 135 170 45 - 50 12 - 18 1,385 1,840 9.25% 9.75%
City Fringe
A 230 270 50 - 65 10 - 15 2,790 3,725 7.25% 8.25%
Newton 5.8% B 170 215 40 - 45 10 - 15 1,840 2,605 8.25% 9.25%
C 135 170 45 - 50 12 - 18 1,385 1,890 9.00% 9.75%
A 255 350 50 - 75 10 - 15 3,515 5,385 6.50% 7.25%
Parnell 2.7% B 220 285 40 - 50 10 - 15 2,665 3,930 7.25% 8.25%
C 160 200 40 - 50 12 - 18 1,730 2,355 8.50% 9.25%
A 290 340 50 - 60 10 - 15 4,000 5,230 6.50% 7.25%
Western Fringe 5.4% B 180 235 50 - 60 10 - 15 2,180 3,135 7.50% 8.25%
C 150 170 50 - 60 12 - 18 1,580 2,000 8.50% 9.50%
City Fringe New Build A 400 475 70 - 80 12 - 18 5,515 7,310 6.50% 7.25%
A 250 300 70 - 80 8 - 15 3,225 4,285 7.00% 7.75%
Southern
Corridor
Southern Corridor 8.2% B 200 245 60 - 80 10 - 16 2,285 3,160 7.75% 8.75%
C 160 200 35 - 45 15 - 20 1,685 2,355 8.50% 9.50%
Southern Corridor New Build A 325 350 70 - 95 8 - 14 4,195 4,830 7.25% 7.75%
A 230 265 45 - 60 8 - 15 2,875 3,785 7.00% 8.00%
Wellington
/Penrose
Mt Wellington/Penrose 7.5% B 180 220 20 - 35 10 - 15 2,000 2,750 8.00% 9.00%
Mt
C 120 160 20 - 25 15 - 20 1,145 1,780 9.00% 10.50%
A 240 315 45 - 65 5 - 10 2,910 4,200 7.50% 8.25%
East Auckland
East Tamaki/Highbrook 0.0% B 180 230 40 - 50 12 - 18 1,945 2,705 8.50% 9.25%
C 130 160 30 - 40 12 - 18 1,210 1,640 9.75% 10.75%
B 160 200 45 - 60 5 - 10 1,730 2,425 8.25% 9.25%
Botany/Howick 0.9%
C 140 160 30 - 50 10 - 15 1,400 1,685 9.50% 10.00%
A 235 315 50 - 65 5 -10 2,940 4,345 7.25% 8.00%
Corridor
Airport
Airport Corridor 3.9% B 160 200 40 - 55 10 - 15 1,730 2,425 8.25% 9.25%
C 110 140 25 - 40 15 - 20 1,130 1,515 9.25% 9.75%
A 230 270 45 - 60 5 - 10 2,705 3,600 7.50% 8.50%
Manukau
Manukau 7.4% B 160 220 35 - 50 10 - 15 1,730 2,665 8.25% 9.25%
C 120 150 25 - 30 10 - 15 1,045 1,620 9.25% 11.50%
B 180 220 30 - 40 10 - 15 1,755 2,445 9.00% 10.25%
Auckland
West Auckland 5.5%
West
C 80 130 25 - 30 15 - 25 680 1,300 10.00% 11.75%
West Auckland New Build A 230 250 45 - 50 8 - 15 2,630 3,335 7.50% 8.75%
Source: Colliers International Research. * Exclusive of rates (North Shore exception). **Assuming fully leased at market rates.
2
CORPORATE REAL ESTATE TRENDS

A TENANT PERSPECTIVE
              GOALS                                  WORKPLACE
                                                     SOLUTIONS
                   ORGANISATIONAL
                       ALIGNMENT
                           A workplace that                      COLLABORATIVE
                                matches the
                        organisation's needs.

                                                                 AGILE & FLEXIBLE

                                                     AUTHENTIC
                                                                 AUTHENTIC

                                                                 BRAND ALIGNMENT

                              COST
                           CONTROL

                            SOCIAL                               TAILOR-MADE
                        ALIGNMENT

                             07:23

                                                                 DIVERSE

A workplace
that matches                                                     TECHNOLOGICAL
the individual’s                     9

                                         6
                                             3

needs.

                                                                 WELLNESS

                                                 3
BENEFITS                                          APPROACHES
                                                  Traditional approaches like the corporate or
                                                  home office are being blended by a mix of
                                                  alternative workplace approaches.
 Co-working and the sharing of big
 ideas stimulates innovation forming
 a competitive advantage for the
 organisation

 Engaging staff and enhancing
 productivity by providing different
 staff the right atmosphere
 and location for the best outcomes                                                           E
                                                                                       F IC
                                                                                     OF

 Sweating the asset rather than the
 employee for better layout and density
 ratios that keep rental costs as
 affordable as possible                             SE
                                                         RV                                   E
                                                            IC                         F IC
                                                                 ED                  OF

 A workplace that expresses the brand
 identity boosts the organisation’s
 attractiveness to clients and staff
                                                                                             K   ING
                                                                                          OR
                                                                                     -W
                                                                             CO

 Satisfying the desire for a better
                                                   WO                                         CE
 work experience for employees leads                    RK                                S PA
 to the retention and attraction of the                   SH                           CT
                                                                 OP                  JE
 best staff                                                        /             O
                                                                            PR

 Incorporating changing demographics and
 workplace diversity enhances corporate           ME
                                                       MB                                        E
 social responsibility, business reputation                 ER                              NG
                                                                 SH                     U
 and a wider pool of potential employees                              IP/            LO

 Technological connectivity and data
 intelligence formulate winning insights
 and outputs that ultimately benefit the
                                                                                            FE
 organisation and clients
                                                                                      CA

 Keeping staff fit and healthy leads to
 better productivity and satisfaction

                                                                                            ME
                                                                                      HO

                                              4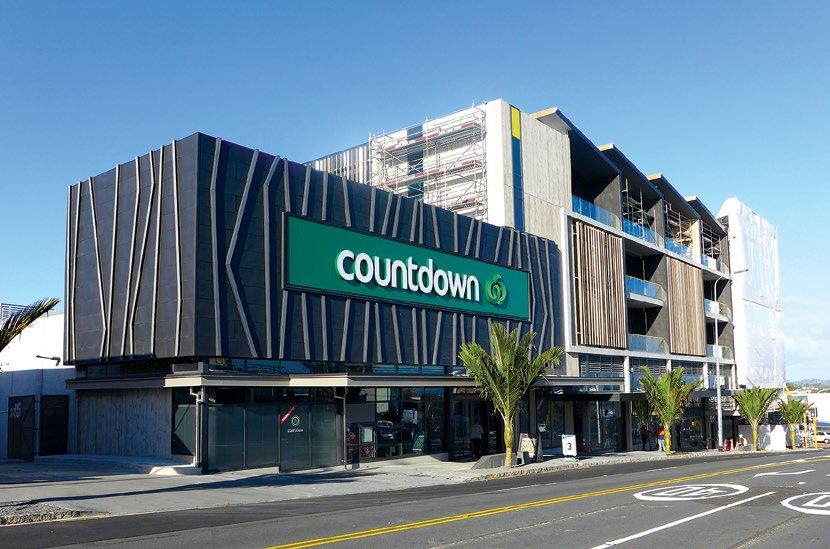
The Bigger Picture Auckland CBD Office Prime Rents vs
Metropolitan Prime Rents
Cranes on Auckland’s skyline are now common place. This has led
to total metropolitan office supply reaching more than 1.7 million $600
Average Prime Net Face Rent ($/m²)
Forecast
square metres in 2016. Developers built 20,300 sqm of new space in
$500
the past 12 months.
$400
Businesses are more confident in taking on more work and profitability
rates are improving, increasing the number of businesses searching $300
for space and resurrecting business expansion plans. This has led to $200
a steady appetite for space across the region, especially for the main
metropolitan office hubs supported by decent infrastructure and $100
public transport links. $0
Jun-20
Jun-08
Jun-09
Jun-07
Jun-21
Jun-10
Jun-12
Jun-14
Jun-15
Jun-16
Jun-18
Jun-13
Jun-19
Jun-17
Jun-11
More demand and new supply increased net absorption rates, pushing
vacancy to an eight-year low of 6.2%, with 106,000 sqm of available
space. If all of the space was leasable, it is enough to accommodate Metropolitan Auckland Auckland CBD
roughly an additional 5,000 employees (based on our latest workplace
Source: Colliers International Research
research on office density). If no new supply became available, current
employment growth rates suggest this would last approximately
two years.
Metropolitan Auckland Office Market Vacancy Rates
Driving the overall low vacancy result is the performance of the main
precincts. Vacancy rates in the City Fringe, Southern Corridor, West
25%
Auckland and Auckland South are at cyclical lows of 7%, 8%, 6% and
7% respectively. The North Shore has the lowest vacancy rate at just 4%. 20%
Vacancy Rate
Importantly for the overall balance of the sector, more supply is on its 15%
way – approximately 120,000 sqm in the next five years. This should 10%
be enough to avoid a critical shortage of non-CBD office supply
hampering the growth of a major economic employment zone of 5%
small to medium sized businesses. However, only some precincts 0%
and tenants will see greater levels of opportunity as developers face
Mar-11
Mar-01
Mar-96
Mar-97
Mar-98
Mar-99
Mar-10
Mar-12
Mar-13
Mar-14
Mar-16
Mar-00
Mar-02
Mar-03
Mar-04
Mar-05
Mar-06
Mar-07
Mar-08
Mar-15
Mar-09
the on-going issue of finding suitable land to develop. If more land
was available, more supply would likely be built despite pressure on
feasibility from construction costs. Overall City Fringe Southern Corridor
North Shore Auckland South West Auckland*
Since late 2011 – coinciding with greater levels of net absorption and
decreasing vacancy rates – average annual rent rises have increased,
Source: Colliers International Research * New to the survey
but only by a modest 3% and 1% in the prime and secondary sectors
respectively. Current rents are forecast to increase by 3% to 4% p.a. in
the prime sector and 1% to 2% p.a. for lower grade premises.
The type of tenants commanding discounts and incentives are those Metropolitan Auckland Office Development Pipeline
that are well-known, occupy large areas of space and take long leases –
ultimately increasing the covenant and future value of the landlord’s ON HOLD UNDER CONSTRUCTION
asset. There are only a few of these types of tenants, but they will be 34,713 80,160
lured into new opportunities. Most favoured are premises that provide
better workplace solutions, productivity and locations that assist in
retention and attraction of the best employees.
Expectations of investment yields firming as well as asset appreciation
continue to drive purchasing sentiment. The sound property funda-
mentals supporting the metropolitan office market has elevated the
already high levels of competition amongst investors, owner-occupiers PROPOSED (2021+) PROPOSED (TO 2021)
and syndicators. Recent expectations of interest rates to stay low is 24,000 39,950
adding fuel to the fire. Some view the new price levels as untenable,
but the fear of missing out is promoting greater levels of acceptance,
Source: Colliers International Research
facilitating a new wave of asset appreciation.
5
Albany
$263 7.5% 1.2%
17 KEY
$250 8.3% 7.6% Major Roads
Railway Line
Average Prime
North Harbour Mairangi Bay Office Rents ($/m2)
$243 7.5% 0% $283 7.0% 9.6%
Average Secondary
$210 9.3% 5.2% $230 8.9% 3.7%
18 Office Rents ($/m2)
SOU
Average Prime
TH
Market Yields (%)
ER
Y
N
W
M Average Secondary
MW
UR Market Yields (%)
BO
Y
R Takapuna
HA Prime Vacancy
ER $318 7.5% 0.4%
Rates (%)
P
UP
$240 9.3% 4.8%
Secondary Vacancy
Rates (%)
Grafton
Western Fringe
N O RT H
$265 7.4% Trend: Jun 15 - Jun 16
$315 6.9% 0%
$178 9.9% Parnell 0%/$0 Actual: Jun 16 Figure
ES $174 9.3% 6.7%
W
TE $303 7.2% 2.2%
RN 0% 8.6%
MW
Y $216 8.3% 2.9%
16 Newton
$250 7.8% Newmarket
Botany/
$159 10% Karangahape Rd $345 6.9% 4.0%
Howick*
West Auckland 0% 5.8% $265 7.4% $195 8.9% 10.8%
$153
$240 8.1% $143 10.6%
10.2%
$153 9.9% 3.8% 12.1%
Mt Wellington/Penrose 0.9%
SO
UT
H $248 7.9% 21.6%
WE
SSouthern
TE Corridor
RN $170 9.8% 5.5%
$275
MW 7.4% 9.7%
Y
$186 9.7% 7.8%
East Tamaki/Highbrook
$278 7.9% 0%
$155 10.2% 0%
Airport Corridor
$275 7.6% 0%
Manukau
$250 8.0% 56.5%
$153 9.1% 5.4%
20 $148 10.3% 3.6%
* No prime stock
Auckland Metropolitan Office Market Review
2016 compared to 2015
Occupier Demand Net Rentals Investor Demand
Enquiry = Average prime grade = $291/m 2
Record levels =
demand
Business confidence = Average secondary grade = $184/m2 prices
Supply = Demand =
Average prime incentives =
Access to funding =
1 month/year of term
Vacancy sustained demand
Prime grade = 5.5% (March 2016) Investment Sales Buyer groups =
Secondary grade = 6.4% (March 2016) Average prime yields = 7.6% private, institutions, syndicators
Spec build activity = Average secondary yields = 9.1%
6
City Fringe                                                                     North Shore
Business confidence levels have spurred office absorption in the city           Despite the slight relief in space available to occupy in our latest
fringe that has led to vacant space halving over the past 24 months.            North Shore office survey, market conditions are tight. At our latest
There is now only 44,000 sqm of office space available in the city fringe       count, there is only 15,000 sqm of available office space across the
from just over 670,000 sqm of stock. Vacancy rarely reaches these low           entire North Shore. All three of the sub-precincts are experiencing
levels, with the last time in 2008, when there was around 200,000 sqm           high levels of demand.
less total supply.
                                                                                This has been brought on by ‘stronger for longer’ economic conditions
The demand for office space has been increased by the removal of                that is being boosted by population growth and the wealth effect
stock for conversion into residential apartments. These market                  created by an increasingly affluent location. Many businesses are
constraints are providing tenants with limited options to pursue.               taking advantage of the locational benefits the North Shore provides
Prime grade properties are even harder to find for tenants with less            suburban tenants, assisting with productivity levels that translate
than 3,500 sqm available.                                                       through to the bottom line.

                                                                                New developments in the North Shore include 1 Byron Ave for Allianz,
Development activity of 40,000 sqm of office space in the city fringe
                                                                                Mitre10 Mega’s new HQ, Smales Farm’s new B:Hive and pockets of
will assist alleviate some of the mounting tenant pressure, but it is
                                                                                other spaces in the North Harbour business zone. Although almost
likely that the majority of the space will be leased within 24 months
                                                                                40,000 sqm of new office space is under development and expected to
under current employment growth forecasts. Similar to many precincts
                                                                                be completed by 2018, much of this space is pre-committed, with the
with new supply, vast amounts of space has received pre-commitment,
                                                                                exception of B:Hive.
however there are more opportunities arising. This includes 96 St
Georges Bay Road in the Parnell office precinct in 2017 with 9,404 sqm          Rents are rising, but still at lower rates than has been achieved in
available at this stage.                                                        previous periods of buoyant economic and commercial property
                                                                                conditions. Similar to office markets across the Auckland region,
The availability of space in the short-term has hampered landlords              this is likely to change over the next year, increasing fractionally.
from increasing rents significantly. This has been welcoming news
for tenants in a landlord favoured market. Average prime net face               Investment yields are now reaching new lows and the range and depth
rents increased by only 2.7% over the past year compared to 4% a                of purchasers have kept conditions competitive. There are no signs
year ago. Forecasts of rental growth remains moderate at between                yet that asset appreciation will slow, especially given increasing
3% and 4% p.a. over the next five years.                                        rental forecasts, lower debt costs and firming investment yields.

  Cider Building
  4 Williamson Avenue, Ponsonby, Auckland
  Progressive Enterprise sold their mixed-use development to Oyster
  Property Group for $93 million, reflecting a yield of 6.74%. Oyster
  Property offered the new building up for syndication and raised $50
  million through the sale of 50 parcels of $1 million. This development
  will include a 4,380 sqm Countdown supermarket, 7,500 sqm of office
  space with 3,700sqm leased to Fairfax Media, 11 retail shops and 520
  basement carparks. The new build is scheduled to open later this year.

                                                                            7
West Auckland Southern Corridor
Limited dedicated office space has been a long-term trend in the west, There has been a noticeable surge in the number of businesses
a reflection of the high proportion of owner-operated businesses. looking to the Southern Corridor – comprising Ellerslie, Greenlane,
However, the recent increase in population and billions of dollars Mt Wellington and Penrose – as a new business base.
being spent on infrastructural projects has spurred occupier interest
The rise in the precinct’s amenity and access to public transport
and development activity.
in recent years has seen the Southern Corridor compete as a more
There is approximately 93,000 sqm of space dotted across West comparable location to the most popular city fringe spots. Other
Auckland, with the major hub in Henderson. Listed sector company advantages are the disparity in rental costs in like-for-like premises
and improved car parking ratios.
Stride Property has also boosted the total office space available with
Stage 1 complete and Stage 2 at Westgate currently under construction This year, significant leasing enquiry for properties over 500 sqm
providing an additional 4,200 sqm of total space by late 2016. resurfaced in a market which had experienced relatively static move-
ments the previous year, especially for larger premises. This pushed
Signalling strong office tenant demand across the west is the pre- the vacancy rate from 11% in March 2015 to 8% a year later.
leasing activity that is taking place for office space as well as the
absorption of existing space pushing the vacancy rate to just 6%. For the level of quality and amenity on offer, rents are a decisive factor
that continues to attract tenants. This has been amplified by the high
The mix of older, existing office space and new premises currently vacancy rates in the Sothern Corridor lately, providing tenants various
being built provide a wide range of leasing options as well as rental high quality options and, in some cases, incentive packages.
levels. The average West Auckland prime office rent is now at $240
A rising number of tenants are using the capital injection up-front
per sqm, well below the average metropolitan office rent of just over
from landlords towards offsetting the constantly increasing cost
$290 per sqm.
of fitting out new premises. Rent-free periods also remain highly
Investment yields are also slightly softer than some of the other main attractive to tenants, reaching between one month and two months
metropolitan office hubs, currently at an average of 8.1% for prime per year of lease term depending on the tenant and the lease terms.
space. The difficulty at the moment for prospective purchasers is The high quality of the office stock in the Southern Corridor and the
locating properties to purchase. This has seen competitive pricing high proportion of properties owned by the listed sector has seen
when stock does become available. Purchaser enquiry for lower quality yields continue to firm. The competitive nature of the investment
premises has increased, especially of properties that could benefit market has also played an important role in the 10 basis point drop
from a refurbishment ahead of the expected rise in popularity and over the past year to an average of 7.6% and 9.1% for the prime and
access to the area. secondary sector respectively.
9-15 Marewa Road
Southern Corridor
Kimberley Trust are constructing two prime-grade buildings with a
total net lettable area of 9,200 sqm. The 1,500 sqm in Building One has
already been leased to a significant national tenant, with construction
expected to be completed in the second quarter of 2017. Both buildings
will provide large, unobstructed floor plates of 980 sqm (Building One)
and 1,650 sqm (Building Two) that can be split to accommodate
businesses of various sizes.
8Auckland South
In the main commercial areas in the south of Auckland – comprising the previous year. New build rents continue to overshadow the rents
areas such as Manukau, Mt Wellington, East Tamaki and the Airport commanded by existing premises. The variability on offer for lower
Corridor – the vacancy rate is just 7%. There is approximately 304,000 quality premises across the area provide a wide variation in rents,
sqm of combined office stock in the precincts, with only 20,000 sqm but can often be secured for between $160 per sqm and $250 per sqm.
of vacant space.
Investment yields are approximately 50 basis points higher than in
The demand for quality premises remains high, but approximately other main metropolitan hubs in Auckland, a reflection of the lower
15% of the vacant space in Auckland South is of modern, quality grade quality premises and the lower levels of large tenant enquiry for
space. On the horizon are new premises at the Auckland Airport. the area.
Known as Quad 7 until naming rights are taken, the building will
provide 7,975 sqm of high quality office space with completion
expected by the end of the year.
A greater focus and commitment by the Auckland Council and the
government on office areas in Manukau, could see a rejuvenation of "The demand for
quality premises
the area’s popularity. A specific project area of approximately 600 ha
has been identified by Panuku Development Auckland from Puhinui
Rd in the north to Brown Rd in the south, Plunkett and Hobil Ave
remains high."
to the west and the Southern Motorway to the east. According to
Panuku Development Auckland, the council and crown entities
control more than two-thirds of the area. This provides a significant
master plan opportunity to transform and rejuvenate the centre.
Average prime rents in the South range between $300 and $340 per
sqm which have been static over the past 12 months after a lift in rents
Fletcher Building Redevelopment
790-816 Great South Road, Penrose, Auckland
Fletcher Building’s headquarters sold for $80m reflecting a 7.1% yield.
The campus is undergoing a redevelopment and has a 20 year lease
to Fletcher Building. The redevelopment of the complex is due for
completion in the third quarter of 2016 with four existing office
buildings to be interconnected by a new single level pavilion.
The campus sits on 2.23 ha land with 13,200 sqm of net lettable area.
9Auckland Metropolitan Office Sales Activity
Address Precinct NLA (m2) Sale Price Yield Vendor Purchaser
Two Millennium Office Estates & the Yellow Southen $206,000,000
Undisclosed 7.25% Goodman Property Trust Oyster Property Group
HQ Building, 600-604 Great South Rd Corridor (conditional)
Fletcher HQ, 790-816 Great South Rd Penrose 13,250 $80,000,000 7.10% Fletcher Contraction Onshore Private Investor
Building B, 8 Nugent St Grafton 7,623 $42,000,000 6.87% Neil Properties Argosy
79 Carlton Gore Rd Newmarket 3,438 $32,660,000 Sub 7% Arawata Assets Ltd 79 Carlton Gore Ltd
Southen
Unisys House, 650 Great South Rd 8,335 $31,800,000 8.20% Stride Property Ltd Maat Consulting Ltd
Corridor
Heartland House, 35 Teed St Newmarket 1,498 $17,000,000 6.52% Private Vendor Stride Property Ltd
9 Augustus Tce Parnell 3,762 $15,400,000 7.00% Augusta Private Syndicator
Westpac, 51 Corinthian Dr Albany 3,424 $15,150,000 7.19% Stride Property Ltd Oyster Property Group
2-8 Jarvis Way East Tamaki 3,123 $13,000,000 5.50% Private Vendor Tram Lease Ltd
117 Khyber Pass Rd Grafton 2,750 $10,000,000 Undisclosed Private Vendor Private Investor
85 Cavendish Dr Manukau 3,875 $10,000,000 7.50% P.F.I. Property No. 1 Ltd Textbook Properties Ltd
90 Great South Rd Papakura 2,983 $9,750,000 Undisclosed Private Vendors Private Investors
326-328 New North Rd Kingsland 1,754 $8,228,888 6.45% Private Vendor Private Investor
132 Hurstmere Rd Takapuna 1,480 $7,500,000 6.13% Private Vendor Private Investor
15-19 Fernhill Dr Westgate 4,131 $7,430,000 Vacant Private Vendor Private Investor
26-32 Virginia Ave Est Eden Terrace 2,616 $7,000,000 8.94% Private Vendor Private Investor
77-85 Clyde Rd Browns Bay 1,165 $6,450,000 4.00% Private Vendor Private Investor
255 Broadway Newmarket Undisclosed $5,350,000 6.50% O'Shea Family Trust Private Investor
12 Clarence St Devonport 670 $5,250,000 Undisclosed Private Vendor Private Investor
2 Dunrobin Pl Highland Park Undisclosed $4,000,000 8.00% Skype 5000 Ltd Private Investor
30 Victoria Ave Devonport 392 $3,800,000 4.71% Private Vendor Private Investor
31 Spring St Freemans Bay 812 $3,500,000 5.41% Private Vendor Private Investor
A1 & A3, 63 Apollo Dr Mairangi Bay Undisclosed $3,145,000 7.28% Private Trust Private Investor
BNZ, Cnr Lincoln Rd & Universal Dr Henderson Undisclosed $3,020,000 4.37% Private Vendor Private Investor
Source: Colliers International Research
Auckland Metropolitan Infrastructure Update
Estimated
Address Precinct Status Purpose
Completion
RAIL
Electric Trains Regional Complete 2015 The trains are faster, quieter, safer and more energy-efficient.
Better comfort and weather protection for waiting passengers, improved security and
Mt Albert Train Station – Stage 2 Mt Albert, Central Construction Mid-2016
lighting and electronic train timetable information.
Parnell Train Station Parnell, Central Construction Mid-2016+ Assist the regeneration/future growth of Parnell.
Pukekohe Train Station Pukekohe, South Design 2017 To connect the Franklin community and the wider Auckland region.
Auckland City Rail Link Auckland Central Design 2021+ Aims to improve travel efficiency and ease congestion around the inner city.
Light Rail Auckland Central Investigation TBC Improve efficiency and resilience of the transport network of the isthmus and city centre.
TRANSPORT
To connect to new development areas and to cater for the increase in traffic
Long Bay Transport Programme Long Bay, North Construction 2017+
movement, the local roading network needs to be upgraded.
Will enable people to catch a quick bus from the eastern suburbs and change to a train
Pakuranga to Botany Busway South Eastern Investigation 2024+
at Panmure.
ROAD
Upgrading SH20A will improve journey reliability and safety for traffic to and from
SH20A to Airport South Auckland Construction Late 2016
Auckland Airport.
The Te Atatu Road corridor improvement will boost the efficiency and safety of Te
Te Atatu Corridor West Auckland Construction Early 2017
Atatu Road for all road users and especially buses, cyclists, and pedestrians.
Operational by Western Ring Route will be an alternative to Auckland’s State Highway 1, linking Manukau,
The Western Ring Route Auckland Region Construction 2017 and fully Auckland, Waitakere and the North Shore, improving network resilience, travel time
complete by 2021 reliability and bus shoulder lanes, and upgrading cycleway and pedestrian facilities.
Address existing bottlenecks at several locations along the Southern Motorway to
Auckland Southern Corridor East Auckland Design Late 2018
provide a more reliable trip for all road users.
East West Connections is a programme that aims to identify and address transport
East West Connections East Auckland Investigation TBC issues in the area between Onehunga, Penrose, Mt Wellington, Mangere, Otahuhu and
East Tamaki.
Source: Colliers International Research, Auckland Transport and New Zealand Transport Agency. For further information visit: www.at.govt.nz and nzta.govt.nz/projects/
10Auckland Metropolitan Office Leasing Activity
Address Precinct NLA (m2) Tenant
Cider Building, 4 Williamson Ave Ponsonby 3,700 Fairfax Media
NorthWest Two, Fred Taylor Dr Westgate 2,200 Constellation Brands New Zealand
2 Nuffield St Newmarket 1,620 Cerebos Greggs
Lv 3 & Pt Lv 4, 205 Wairau Rd Wairau Valley 1,432 Smart Pay
460 Rosebank Rd Avondale 1,380 Aeroqual
650 Great South Rd Southern Corridor 1,310 Fletcher Construction
109 Carlton Gore Rd Newmarket 1,145 Mighty River Power
Millennium Business Park, 600 Great South Rd Southern Corridor 1,100 Griffins
3M Building, 94 Apollo Dr Mairangi Bay 1,083 AMS Ltd
2a Rothwell Ave North Harbour 890 IMS Health
18 Canaveral Dr Mairangi Bay 700 Strker Translations Ltd
Source: Colliers International Research
Auckland Metropolitan Office Development Update
Estimated
Address Precinct NLA (m2) Status Owner/Developer
Completion
CITY FRINGE
Cider Building, 4 Williamson Ave Ponsonby 7,449 Under Construction Q3 2016 Progressive Enterprises
The Employers & Manufacturers Association
EMA Employment Campus, 145-179 Khyber Pass Rd Newmarket 3,600 Under Construction Q3 2016
(Northern) Inc/Location Group
119 Great North Road Grey Lynn 4,500 Under Construction Q3 2017 Giltrap
96 Saint Georges Bay Road Parnell 9,404 Under Construction Q3 2017 Manson TCLM
Confidential Confidential 10,000 Proposed Q1 2019 Manson TCLM
Kent/Teed St Commercial Building, 23-25 Kent St Newmarket 4,000 Proposed TBC Gadol Corporation
Eden 6, 12-18 Normanby Rd Eden Terrace 7,313 On Hold TBC Eden Real Estate Ventures
NORTH SHORE
1 Byron Ave Takapuna 2,100 Under Construction Q2 2016 Private Developer
Apollo Square, 30-40 Rosedale Rd Albany 1,029 Under Construction Q2 2016 Rosedale Apartments
B:Hive, 74 Taharoto Rd Takapuna 11,000 Under Construction 2016+ Smales Farm
The Vodafone Building Expansion, Smales Farm Takapuna 18,000 Under Construction Q3 2017 Smales Farm
Mitre 10 National Support Centre, 67 Corinthian Dr Albany 7,000 Under Construction Q4 2017 Mitre 10
55 Corinthian Dr Albany ~5,000 Proposed Q2 2018 Apec Property Development Ltd
SOUTHERN AUCKLAND
Building 5, The Crossing, Highbrook East Tamaki 3,828 Under Construction Q4 2016 Goodman Property Trust
9-15 Marewa Road Southern Corridor 9,200 Proposed Q2 2017 Kimberley Trust
Quad 7, 6 Leonard Isitt Dr Airport Corridor 7,975 Under Construction Q3 2017 Auckland Aiport
The Ormiston Town Centre at Flat Bush Flat Bush 20,000 Proposed 2025 Auckland Council & Todd Property
6c Pacific Rise Mt Wellington 750 Proposed TBC Private Developer
Sylvia Park Commercial, Mt Wellington Highway Mt Wellington 20,000 Proposed TBC Kiwi Income Property Trust
Building A2 & A3, 666 Great South Rd Southern Corridor 10,000 On Hold TBC Goodman Property Trust
Ascot Parade Business Quarter, Ascot Ave Southern Corridor 17,400 On Hold TBC McConnell Property
WEST AUCKLAND
NorthWest Stage 2 (office component) Massey 4,211 Under Construction Q4 2016 Stride Property Ltd
195-199 Universal Dr Henderson 1,000 Under Construction Q4 2017 Morrison Horticultural
102 Hobsonville Rd Hobsonville 512 Under Construction 2017 Northbridge Properties
Source: Colliers International Research
11Outlook
There is little evidence to suggest that the metropolitan office sector will deviate
from its current growth path. Businesses are moving away from the status
quo and are realistic about their future plans, taking on more calculated risks.
They are expanding and spending money on plant, machinery and staff in a
buoyant economy with a dominant Auckland growth profile.
The recent influx of new developments has averted a supply shortage reaching
critical point. More supply on its way will keep the balance between demand
and supply at more healthy levels over the medium term. However, there is
still some way to go before the buildings are completed which may cause some
uncomfortable positions for tenants in the short-term if enquiries are left too late.
With no clear advantage eventuating between landlords and tenants over the
medium term in a more balanced environment, rents will not rise at significant
rates. Rent increases for many tenants will be between 1% and 4% over the next
few years. This is lower than previous upswing cycles, which reached double
digits in some years and locations.
Vacancy rates are not forecast to rise significantly, therefore, limiting incentive
packages. However, tenants moving to new space will be enticed by landlords,
especially if it is the trigger for a new development to proceed. Of course, not all
tenants are in a position to move or drive favourable leasing rates given their
existing agreements or size of operations.
The dispersion of the supply throughout Auckland suggests some demand and
supply imbalances may remain. This will be especially noticeable in main
metropolitan office hubs supported by decent infrastructure, public transport
links and high qualities of amenity, facilities and car park ratios.
Competition amongst investors, owner-occupiers and syndicators in a
commercial property market with sound fundamentals and ‘yield-hungry’
investors means a lack of stock and competitive pricing. Recent expectations
of interest rates to stay low will see further pressure on purchasers to step up
their pricing levels. Some view the new price levels as untenable, but the fear
of missing out is promoting greater levels of acceptance, facilitating a new
wave of asset appreciation.
"The recent influx of new
developments has averted
a supply shortage reaching
critical point.
12 Image: NorthWest, Fred Taylor DrFor more information contact: Colliers International Research
and Consulting offers a range
Alan McMahon Aimee Simpson of commercial and residential
National Director | Research Research Co-ordinator property solutions:
& Consulting
Chris Farhi • Property Investment strategies
Chris Dibble Director | Strategic Consulting • Demand & Supply Studies
Director | Research & Consulting
Caity Pask • Market Analysis & Forecasts
Leo Lee Senior Analyst | Strategic Consulting • Feasibility Analysis
Senior Research Consultant
• Catchment Analysis
Elena Christodoulou Colliers International
• Lease Audit & Benchmarking
Research Analyst Level 27, SAP Tower
151 Queen St, • Site Options Analysis
Emily Duncan Auckland • Corporate Real Estate Strategy
Research Analyst +64 9 358 1888 • Financial Analysis
• Business Cases
Whilst all care has been taken to provide reasonably accurate information within this report, Colliers International cannot guarantee
the validity of all data and information utilised in preparing this research. Accordingly Colliers International New Zealand limited, do
not make any representation of warranty, expressed or implied, as to the accuracy or completeness of the content contained herein
and no legal liability is to be assumed or implied with respect thereto.
© All content is Copyright Colliers International New Zealand Limited 2016 and may not be reproduced without expressed permission.You can also read