Synthesis of vinyl ester resin carrying PVDF green nanofibers for self healing applications
←
→
Page content transcription
If your browser does not render page correctly, please read the page content below
www.nature.com/scientificreports
OPEN Synthesis of vinyl ester
resin‑carrying PVDF green
nanofibers for self‑healing
applications
C. Naga Kumar, M. N. Prabhakar & Jung‑il Song*
Self-healing on the engineering applications is smart, decisive research for prolonging the life span of
the materials and the innovations have been mounting still smarter. Connecting to advancements in
self-healing carriers, in altering the chemical structure by optimizing the brittleness for self-healing
performance and introducing the bio-degradability, for the first time TPS was blended to PVDF
for the synthesis of nanofibers, as carriers of a vinyl ester (VE) resin (medication), by the coaxial
electrospinning technique. TPS was mechanically mixed with PVDF base polymer and optimized the
TPS content (10 wt%) based on mechanical performance. The novel nanofibers were characterized
via field emission scanning electron microscopy (FESEM), Fourier-transform infrared spectroscopy,
X-ray diffraction, thermal, moisture analysis, and a mechanical line with FESEM and energy-dispersive
X-ray analysis studied the self-healing. The TPS/PVDF fibers having hydrogen bonding and increased
the crystallinity (40.57 → 44.12%) and the diameter (115 → 184 nm) along with the surface roughness
of the fibers with increasing the TPS content. Microanalysis presented the flow-out of the VE resin at
the scratched parts in the pierced fibers; interestingly, after some time, the etched part was cured
automatically by the curing of the spread resin. Mechanical stretching of the nanofibers in the tensile
tests up in the plastic region showed a decrement in the elasticity (TPS/PVDF fibers) and an increment
in the brittle nature (cured VE resin) with the increase in Young’s modulus at each stretching, clearly
elucidating the healing performance.
Abbreviations
Pn PVDF nanofibers
5TPn 5% TPS/PVDF nanofibers
10TPn 10% TPS/PVDF nanofibers
15TPn 15% TPS/PVDF nanofibers
20TPn 20% TPS/PVDF nanofibers
V–10TPn VE–CN infused core–shell TPS/PVDF nanofibers
M–10TPn MEKP infused core–shell TPS/PVDF nanofibers
VM–10TPn Self-healing nanofibers (combination of both V–10TPn and M–10TPn)
In the present decade, researchers have been mostly interested in using nanofibers as smart carriers for self-
healing applications, e.g., curing microcracks, corrosion protection coatings for metals, and wound healing1. The
usage of self-healing nanofibers can extend the usability and life span of materials/composites. Nanofibers have
excellent properties, such as a large surface area to volume ratio, a high degree of flexibility, and good mechanical
properties2. Electrospinning has become a well-known technique to investigators for the preparation of nanofib-
ers owing to its easy operation under optimized conditions compared to all the methods3. In this technique, an
electrostatic force is applied to eject a polymer solution jet from the tip of a droplet to form nanofibers. In the
early years of the twenty-first century, technological developments led researchers to modify the electrospinning
method to prepare tube-like structure (core–shell) nanofibers with distinctive features by installing a particular
type of nozzle, called a coaxial nozzle4–6. In the self-healing field, this innovation tremendously promoted the
Department of Mechanical Engineering, Changwon National University, Changwon 51140, Korea. *email: jisong@
changwon.ac.kr
Scientific Reports | (2021) 11:908 | https://doi.org/10.1038/s41598-020-78706-3 1
Vol.:(0123456789)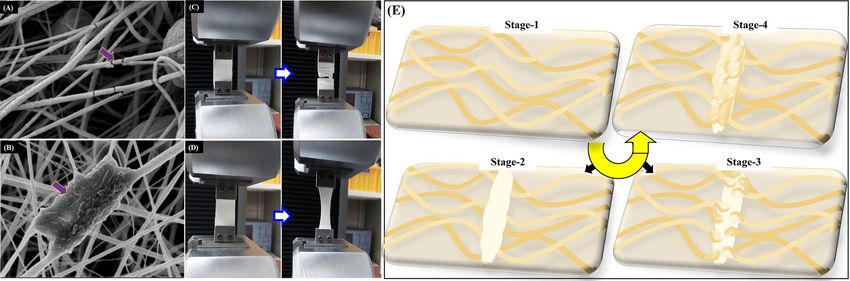
www.nature.com/scientificreports/
use of self-healing carriers as regenerative medicine in tissue engineering7, releasing healing resin in mechanical
engineering8, etc.
The utilization of nanofibers in self-healing applications is particularly attractive compared to the existing
self-healing carriers, e.g., microspheres and vascular networks, owing to the limitations of uniform distribu-
tion and uneven surfaces of the latter in real products. Importantly, in the above two cases, more carriers are
required for both the healing resins along with a curing agent, which increases the density of the corresponding
composites and makes the healing mechanism complex9–11. In fact, microsphere reinforcement in composites by
the vacuum-assisted resin transfer molding (VARTM) process is highly complex. Moreover, the hardener micro-
spheres should be distributed on the resin microspheres, particularly at the cracked parts, which is highly impos-
sible in composites for achieving an effective self-healing process12. Recently Maryam et al., studied self-healing
behavior by developing silane coupled cellulose-functionalized halloysite nanotube/epoxy n anocomposites13.
Several thermoplastic polymers have been used to synthesize nanofibers by the electro-spinning method
such as polyacrylamide (PAM), polyvinyl alcohol (PVA), polyvinyledene fluoride (PVDF), etc.14,15. PVDF is a
well-known polymer mostly used to produce nanofibers owing to its excellent mechanical, thermal, and electrical
properties16. It has a semi-crystalline structure and is non-biodegradable and hydrophobic in nature. Numerous
researchers have studied the development of the electrical behavior of PVDF nanofibers of chemical modifica-
tions and reinforcement of various a dditives17,18; in addition, a few of them have focused on their mechanical
properties and hybridization. For example, (Dai et al.) self-healing internal electric field is proposed and success-
fully endowed to a designed helical structural composite microfiber polyvinylidene fluoride/g-C3N4) based on
the bio inspired simple harmonic v ibration19. Aatif et al. confirmed an improvement in the mechanical proper-
ties of the β-phase fraction of PVDF nanofibers when bentonite nano clay particles were introduced into the
PVDF dope solution for e lectrospinning20. Pu et al. observed an increment in Young’s moduli, tensile strength,
and thermal stabilities of PVDF nanofibers when combined with ZnO nanowires21. Seyyed et al. proved that the
mechanical properties of PVDF nanofibers varied with the increase in nano silica content and stated that with
higher SiO2 content, PVDF nanofibers with better tensile strength, more toughness, and smaller elongation to
break were o btained22.
In fact, PVDF nanofiber-reinforced composites are suitable to be used as self-healing carriers. Mahanty et al.
fabricated PVDF/MWCNT composite electrospun nanofibers followed by piezoelectric pressure sensor directly
as self-powered electronic skin (e-skin)23. Wook et al. used PVDF as shell material in self-healing nanofibers;
the authors encapsulated two components (a resin monomer and a hardener) separately in the cores of PVDF
nano and microfibers formed by solution blowing using compressed air. The self-healing properties of such
nano and microfiber mats were explored using blister tests along with periodic bending fatigue tests24. PVA/
PVDF core–shell nanofibers were synthesized by Yuhua et al., and showed that MBT-loaded coaxial nanofibers
decreased the corrosion activity of coatings25. Choolaei et al. confirmed the improvement in the crystallinity of
PVDF-HPF nanocomposites by adding GO nanoparticles through a heterogeneous nucleation m echanism26.
Indeed the flexible nature of PVDF Nanofibers is not well support the significant self-healing performance
due to damage issues under loadings27. Optimizing brittleness for achieving adequate healing performance,
especially in connection to micro-cracks in fiber-reinforced self-healing composites is a critical task until no
researchers focused. Hence, the current research attempts to practically realize the above-mentioned hypothesis
advancements and problems in PVDF, for the first time by chemical blending low-cost starch in the form of a
thermoplastic polymer for optimizing the brittle nature towards effective self-healing performance as well as
introducing biodegradability. A coaxial electrospinning instrument (Model: NS1 NanoSpinner Electrospinning
equipment, INOVENSO, Korea) was used to produce core–shell nanofibers with uni-diameters. The mechanical
properties were studied for various weight percentages of thermoplastic cornstarch (TPS) (5, 10, 15, and 20 wt%).
As expected, the crystallinity and the modulus of the fibers increased with the increase in the TPS weight percent-
age in PVDF, which, in turn, increased their diameter, as confirmed by X-ray diffraction (XRD), tensile tests,
and field emission scanning electron microscopy (FESEM). 10 wt% of TPS blended PVDF polymer was chosen
to use for further study, even though the higher percentage of TPS (15 and 20 wt%) showing higher properties
such as mechanical strength, surface roughness, degree of crystallinity, water absorption etc., due to mainly on
the structure formation of the uniform diameter of nanofiber without any obstructions. The self-healing roles
of the fabricated nanofibers were investigated by periodic stretching by tensile loading up in their elastic zone.
The variation in the modulus and morphology significantly affected the healing performance of the TPS/PVDF
core–shell nanofibers.
Materials and methodology
Materials. PVDF and glycerol (ACS reagent ≥ 99.5%) were purchased from Sigma-Aldrich, USA, and
dimethylformamide (DMF) (99.0%) was purchased from Samchun Chemicals, South Korea. Corn starch (72%
amylopectin and 28% amylose) was received from Samyang Corporation Ltd., South Korea. Vinyl ester (VE)
(viscosity = 150 cps and specific gravity = 1.03), methyl ethyl ketone peroxide (MEKP) (catalyst), and cobalt
naphthalate (accelerator) were procured from CCP Composites, Korea.
Preparation of self‑healing nanofibers. The fabrication process of TPS/PVDF core–shell nanofibers
as shown in Fig. 1, consist of mainly four steps as follows: Step 1: Synthesis of TPS, Step 2: Preparation of TPS/
PVDF polymer blend solution, Step 3: Preparation of core (VE–CN) and MEKP solutions and Step 4: Fabrica-
tion of TPS/PVDF core–shell nanofibers. The detailed information about the steps is discussed below.
Step 1: Synthesis of TPS
Scientific Reports | (2021) 11:908 | https://doi.org/10.1038/s41598-020-78706-3 2
Vol:.(1234567890)
www.nature.com/scientificreports/
V
Nano-fibers
Co-axial Nozzle
V-10TPn
10TPn
M-10TPn Pn
TPS
Glycerol
H2O
PVDF
Shell
Temp: 30 oC DMF
Time: 12h Acetone
VE-CN
Starch
Core
MEKP
Controller
Figure 1. Schematic representation of electrospinning process producing TPS/PVDF core–shell nanofibers.
TPS was prepared by a simple process in which glycerol and deionized (DI) water were taken in a 3:1 ratio
and stirred at a temperature of 80 °C for more than 10 min to form a homogeneous solution. Subsequently, the
obtained solution and starch were mixed together in a ratio of 1:2 for producing the required T PS28.
Step 2: Preparation of TPS/PVDF blend solution
A 1:3 (w/w) acetone/DMF mixture was used as the solvent, to which 18 wt% PVDF was added. The mixture
was stirred at 80 °C for 8 h, and the prepared TPS (10 wt%) was then added to the PVDF solution. The stirring
was continued for 6 h at 80 °C until a homogeneous TPS/PVDF solution was obtained.
Step 3: Preparation of core solutions (VE–CN and MEKP)
The effective curing process of vinyl ester (VE) requires both accelerators (CN) and catalyst (MEKP). Hence,
three types of core have to prepare such as VE, CN, and MEKP. However, to minimize the density of the nanofib-
ers only two types of core materials (VE–CN and MEKP) used based on chemical nature. VE–CN solution was
prepared by adding the required amount of CN to the VE (100:1) and mixing thoroughly on an overhead stirrer
for 10 min at room temperature. MEKP was used directly without further modification.
Step 4: Synthesizing green PVDF nanofibers
PVDF and TPS/PVDF nanofibers were synthesized using an electrospinning machine with an electrospin-
ning needle. To synthesize the core–shell nanofibers by coaxial electrospinning, a coaxial nozzle with an inner
diameter of 0.8 mm and an outer diameter of 1.6 mm was used, as shown in Fig. 1. VE resin and cobalt naphtha-
lene were mixed in a 100:1 ratio and were used as the core materials such as VE–CN, and MEKP. The flow rate
of the TPS/PVDF (shell) solution was maintained at 1 mL/h, and those of the VE–CN resin (core) and MEKP
(core) were maintained at 0.08 mL/h each. A nozzle tip and a collector were fixed at a distance of 15 cm, and a
current–voltage of 18 kV was supplied to induce the nanofiber formation from the solution. Both the VE–CN
and MEKP core–shell nanofibers were electrospun on the same collector successively to entangle and form a
self-healing core–shell nanofiber mat. Consequently, in individual nanofibers, the core materials (VE–CN and
MEKP) were stored in a liquid state as the core of the core–shell nanofibers, which was surrounded by the TPS/
PVDF shell.
Testing and characterizations. Nanofiber mats of 25 × 15 mm in size were tested using a UTM machine
(2.5 ton load, R&B Inc, South Korea) at a cross-head speed of 1 mm/min. Attenuated total reflection (ATR)–
Fourier-transform infrared (FTIR) spectra of the fibers were measured by an FTIR spectrometer (FT-IR-6300,
JASCO International Co., Ltd., spectrometer, Japan). The FTIR spectra were collected in a range of 4000–
400 cm−1. XRD patterns were obtained using an X-ray diffractometer (Bruker, D8 Discover). The samples were
mounted on the sample holder, and the patterns were recorded by running the instrument at a speed of 2°/
min and a 2θ range of 10°–40°. The crystallite sizes of the nanofibers were calculated by Scherrer’s equation
(D = K /βcosθ ), and the degree of crystallinity was obtained by the following equation:
Area of crystalline peaks
Degree of crystallinity = × 100
Area of crystalline peaks + Amorphous peaks
The thermal stability was characterized via thermogravimetric analysis (TGA) (STA 6000, PerkinElmer, UK)
within a temperature range of 30–700 °C and at a rate of 20 °C/min under a nitrogen atmosphere. To study the
surface morphology, the specimens were examined via FESEM (LYRA3xm, Czech Republic) at an accelerated
voltage of 5–30 kV with an energy-dispersive X-ray (EDX) analyzer. All the samples were sputter-coated with
gold using an automated fine coater (JEOL JFC-1600). A water absorption test was conducted on the nanofibers
Scientific Reports | (2021) 11:908 | https://doi.org/10.1038/s41598-020-78706-3 3
Vol.:(0123456789)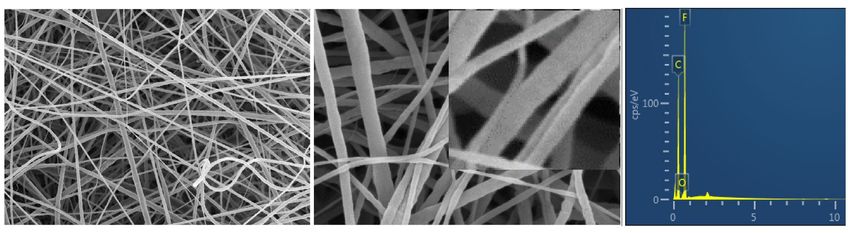
www.nature.com/scientificreports/
by soaking them in water for 24 h. The weights of the specimen before ( m0) and after ( m1) the soaking were
noted, and the water absorption (Q) was calculated using the formula, Q = m1−m0 m0 × 10029. Five samples were
tested for each type of nanofiber, and all the samples were pressed with tissue paper and dried before weighing.
Results and discussion
Analysis of TPS/PVDF nanofibers. Microanalysis. Figure 2A shows the FESEM images of the PVDF
nanofibers with different weight percentages of TPS and confirms the presence of nanofibers with accurate na-
nosized diameters. The diameter distribution histogram presents the diameters of the nanofibers by counting
50 nanofibers using the Nano Measurer software. The average diameter of Pn is approximately 115 nm. As the
TPS weight percentage in PVDF increases, the average diameter of the TPS/PVDF nanofibers also increases as
follows: Pn (115 nm) < 5TPn (152 nm) < 10TPn (168 nm) < 15TPn (175 nm) < 20TPn (184 nm)30.
The surfaces of the nanofibers tremendous change with the variation in the TPS content, as shown in the
second column of the zoomed images in Fig. 2B; it can be seen that the PVDF nanofibers have a smooth sur-
face, which becomes rough as the percentage of TPS increase. This is probably because the introduction of TPS
causes a decrease in the conductivity of the electrospinning solution, which assists in increasing both the fiber
diameter and the r oughness31,32.
The roughness of these fiber surfaces suggest that they are brittle, which can be confirmed by the increment in
the tensile modulus, as explained later in “Tensile properties” section. The crests and troughs on the surfaces of
the fibers also help in the interfacial bonding between the fibers and a resin when they are used for the prepara-
tion of composites. Nanofibers with collapsed beads and micrometer-sized droplets of the solution are observed
(Fig. 2B) as the TPS content reached 15 wt% and more. This can be attributed to the high viscosity and surface
tension of the TPS/PVDF solution, causing the jet to interrupt and withdraw into spherical f orms33. Because of
the presence of more beads and spherical droplets in 15TPn and 20TPn, they cannot be used further for prepar-
ing core–shell nanofibers. Thus, 10TPn is considered as the optimal polymer blend based on the morphological
observations. The compositions of the elements in the fibers were determined by EDX analysis, and the results
are shown in Fig. 2C. The content of fluorine decreases gradually as the TPS content increases, which suggests
a reduction in the PVDF percentage in the nanofibers with an increase in TPS.
Spectral analysis. The interfacial interaction and confirmation of hydrogen bonding were characterized using
FTIR. Figure 3A shows all the crystalline phases can be recognized through the vibrational peaks between 1300
and 600 cm−1 in the fingerprint region. Accordingly, PVDF may present at least four different well-known crys-
talline structures: the orthorhombic alpha (α), beta (β), gamma (γ), and the monoclinic delta (δ) phase in terms
of its crystallization conditions. However, in PVDF nanofibers, the FTIR spectral doesn’t show any vibrational
bands at 976, 796, 764 and 614 cm−1 and also at 1232, 833, 812 and 776 cm−1 which indicates the absence of α
phase and γ phase in which PVDF neat p ossessed34. Thus, the peaks 1401, 1274 and 840 cm−1 exclusively repre-
sent the characteristics of the β phase.
Observing the FTIR peaks of TPS, the characteristic bands around at 3425, 3270 and 2923 cm−1 (CH and
OH stretching bands), 1640 cm−1 (absorbed water), 1152, 1018 and 1103 cm−1 (CC and CO stretching) 916 and
988 cm−1 (CC vibration) (CO stretching, CC stretching and vibration) and 1008 cm−1 (CO–H bending vibra-
tion)35 were the combinations of starch and glycerol.
After the preparation of PVDF nanofibers, the gradual addition of TPS in 5% interval figures the appearance
of new peaks as shown in two insets, Fig. 3B,C. Significant new characteristic bands were observed between
3100 and 3500 cm−1 and the disappearance of weak peak at 2901 cm−1 in Pn and forming a weak broadband of
2882 cm−1 for 5TPn, 2872 cm−1 for 10TPn, 2876 cm−1 for 15TPn, and 2879 cm−1 for 20TPn. Since both polymers
exhibiting thermoplastic behavior, the reactive sites of TPS in oxygen molecules readily react with the reactive
sites of PVDF with hydrogen forming hydrogen bonding. Consequently, as the % of TPS increases by 5% in
every sample, the hydrogen bonding increases indirect proportional since starch is a stereo-regular polymer
with chirality and a high density of hydrogen b onding36.
Figure 3D proposes the molecular interaction between TPS and PVDF induces the formation of orientated
β crystals indicates possible confirmation of hydrogen bonding at O–H…F–C due to the stronger polarity of the
hydroxyl groups as observed in O–H stretching vibration in the range of 3500–3150 cm−137. In addition, as inves-
tigated by Mi et al., the dipoles of β crystals relating to the peaks 1401, 1274 and 840 cm−1 are in the orthogonal
direction and corresponding relative intensity can be used to determine the lattice o rientation38. Meanwhile the
interaction between C–H…F–C is a dipolar dispersion force, wherein PVDF, a non-conjugated linear fluorinated
hydrocarbons and TPS also contain carbon and hydrogen resulting in transient dipole moment lead a separate
transient dipole moment in neighboring molecule, initiating a fleeting attraction between the C–H molecules39.
The remaining characteristic bands were mostly contributed by PVDF which as follows: (1) 3400–3427 cm−1:
stretching vibration mode of the hydrogen-bonded O H groups of starch, (2) 1625–1629 cm−1: double bond
interaction of C to C; (3) 1185–1190 cm−1 the retain stretching vibration of C–F; and the (4) 883–884 cm−1:
confirmed the C=C bonding in bending movement.
XRD spectroscopy. XRD is an analytical technique used to identify the crystallinity of a material; it was con-
ducted on the TPS/PVDF nanofibers to study the effect of TPS in the PVDF fibers. Figure 4A shows the XRD
patterns of the TPS/PVDF nanofibers. The PVDF patterns reveal the existence of the β-phase in the samples; the
curves present a typical crystal phase peak at 20.5°. The peaks at 15°, 17.03°, 17.88°, and 22.9° correspond to the
crystalline peaks of TPS. The crystallite sizes of the nanofibers are 2.28, 2.30, 2.53, 2.59, 2.87, and 1.03 nm for Pn,
5TPn, 10TPn, 15TPn, 20TPn, and TPS, respectively, as tabulated in Table 1. The calculated crystalline diameters
of the PVDF nanofibers are less than that of TPS/PVDF nanofibers. The crystallite diameter indicates the level
Scientific Reports | (2021) 11:908 | https://doi.org/10.1038/s41598-020-78706-3 4
Vol:.(1234567890)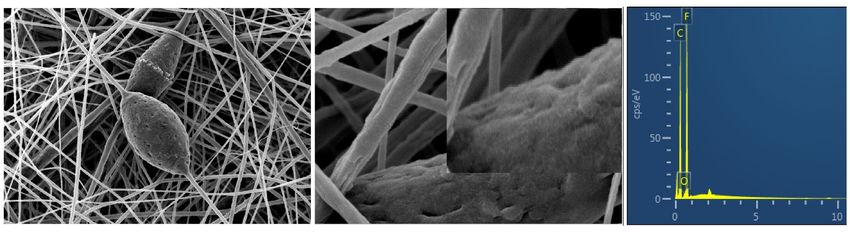
www.nature.com/scientificreports/
(A)20 D avg = 115 nm F
Pn (B) (C)
18
16 C
14
12
Count
10
8
6
4 O
2 1µm 200 nm
0
0 50 100 150 200 250 300 350 400 450
Diameter (nm)
F
20 5TPn D avg = 152 nm
18
16
C
14
12
Count
10
8
6
4 O
2 1µm 200 nm
0
0 50 100 150 200 250 300 350 400 450
Diameter (nm)
D avg = 168 nm F
20 10TPn
18 C
16
14
12
Count
10
8
6
4 O
2 1µm 200 nm
0
0 50 100 150 200 250 300 350 400 450
Diameter (nm)
D avg = 175 nm F
20 15TPn C
18
16
14
12
Count
10
8
6
4 O
2 1µm 200 nm
0
0 50 100 150 200 250 300 350 400 450
Diameter (nm)
18
20TPn D avg = 184 nm
CF
16
14
12
Count
10
8
6
4
O
2 1µm 200 nm
0
0 50 100 150 200 250 300 350 400 450
Diameter (nm)
Figure 2. TPS/PVDF nanofibers: (A) Diameter distribution histogram and FESEM images at less
magnification, (B) high magnification FESEM images and (C) EDX analysis.
Scientific Reports | (2021) 11:908 | https://doi.org/10.1038/s41598-020-78706-3 5
Vol.:(0123456789)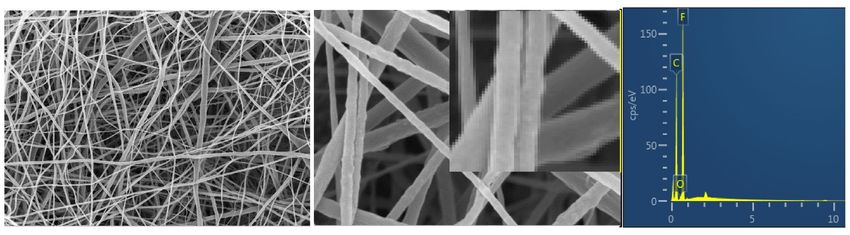
www.nature.com/scientificreports/
(B) (C) (D)
F
O
Hydrogen
Bonding
C
TPS
H
PVDF
3500 3400 3300 3200 3100 3000 3200 3120 3040 2960 2880 2800
Wavenumber (cm-1) Wavenumber (cm-1)
1274 840
(A) Pneat
Pn
5TPn
Transmittance %
10TPn
15TPn
20TPn
TPS β β
4000 3600 3200 2800 2400 2000 1600 1200 800 400
Wave number (cm-1)
Figure 3. (A) FTIR spectra including (B,C) new characteristic bands of TPS/PVDF nanofibers and (D)
Molecular interaction between TPS and PVDF.
(A) (B) 45
Pn 20.5
Degree of Crystallinity (%)
5TPn
10TPn 44
15TPn
Intensity (a.u.)
20TPn
43
42
41
β
40
10 15 20 25 30 35 40 50 100 150 200 250
2θ
θ (degree) Mean Diameter (nm)
Figure 4. (A) XRD patterns and (B) Degree of crystallinity of PVDF, TPS, and PVDF/TPS nanofibers.
Scientific Reports | (2021) 11:908 | https://doi.org/10.1038/s41598-020-78706-3 6
Vol:.(1234567890)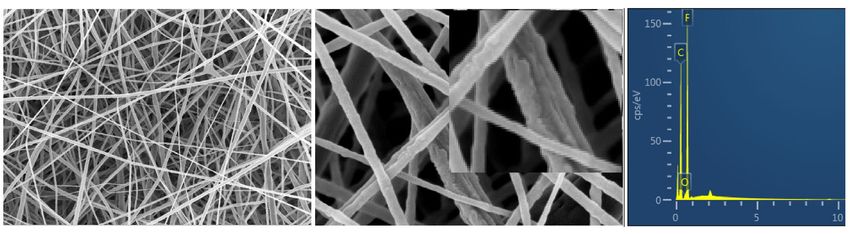
www.nature.com/scientificreports/
TGA results Tensile test results XRD results
Degree of
Name of the Residue Tensile Tensile Elongation at Crystallite crystallinity Water
specimen Tonset 10% (°C) Tmax 65% (°C) strength (MPa) strength (MPa) modulus (MPa) break (%) diameter (nm) (%) absorbtion
Pn 470 560 29 2.33 ± 0.12 36.85 ± 3.4 64 ± 3.08 2.28 40.57 10.88 ± 2.3
5TPn 460 500 26.5 2.78 ± 0.2 54.75 ± 5.3 53 ± 1.1 2.3 41.32 38.60 ± 1.89
10TPn 460 500 26 3.29 ± 0.17 70.9 ± 6.13 47 ± 3.2 2.53 42.43 74.86 ± 3.1
15TPn 460 500 25.2 3.3 ± 0.09 78.1 ± 3.45 42 ± 2.7 2.59 43.98 89.55 ± 4.05
20TPn 455 500 25 0.81 ± 0.1 21.08 ± 5.01 40 ± 2.04 2.87 44.12 106.58 ± 2.57
TPS 100 350 6 – – – 1.03 9.84 –
Table 1. TGA, tensile, XRD, and water absorption data of TPS/PVDF nanofibers.
(A) 0.09 Tensile Modulus Elongation at break 70 (B) 3.5
10TPn
0.08 65 3.0 VM-10TPn
Elongation at break (%)
Tensile Strength (MPa)
0.07
Tensile Modulus (GPa)
60
2.5
0.06 55
0.05 50 2.0
0.04 45 1.5
0.03 40
1.0
0.02 35
0.5
0.01 30
0.00 25 0.0
Pn 5TPn 10TPn 15TPn 20TPn 0 10 20 30 40 50 60
TPS/PVDF Nanofiber mats Tensile Strain (%)
Figure 5. (A) Tensile modulus and elongation at break (B) stress–strain curves of TPS/PVDF nanofibers.
of crystallinity in a material; therefore, the crystallinity increases with the increase in the crystallite diameter as
shown in Fig. 4B. The degrees of crystallinity of Pn, 5TPn, 10TPn, 15TPn, 20TPn, and TPS were 40.57, 41.32,
42.43, 43.98, 44.12, and 9.84% respectively, as summarized in Table 1. The order of the degrees of crystallinity
of the nanofibers is as follows: Pn > 5TPn > 10TPn > 15TPn > 20TPn. This increment in the crystallinity indicates
that the crystallinity of the PVDF nanofibers increases with the increase in the TPS c ontent40.
Properties of TPS/PVDF nanofiber mats. Tensile properties. Tensile tests were performed on the TPS/
PVDF nanofibers to determine the change in the properties after the addition of TPS in PVDF. Table 1 lists
the tensile strength, modulus, and elongation at the break of the TPS/PVDF nanofiber mats. The percentages
of elongation at the break of Pn, 5TPn, 10TPn, 15TPn and 20TPn are 64, 53, 47, 42, and 40%, respectively; it
can also be observed from Fig. 5A that the order of the elongation at break is as follows: Pn > 5TPn > 10TPn >
15TPn > 20TPn. The elongation at the break is observed to be maximized for Pn, following which it gradually
decreases with the increase in the TPS content. The elongation at break substantially decreases, indicating that
the nanofiber mat becomes relatively brittle on the addition of TPS to PVDF. This might be due to the crystalline
nature of TPS, which also increases the crystallinity of the TPS/PVDF nanofibers, as explained and confirmed
by the XRD results. The crystalline nature of TPS changes the crystalline diameter and the percentage of crystal-
line in PVDF, these changes in the structure of PVDF tends to increase the brittleness in TPS/PVDF nanofibers.
This nature of the brittleness of the TPS/PVDF nanofibers is highly useful for their self-healing properties when
they are reinforced in composites. As the brittleness increases, the nanofibers become easily ruptured inside the
composites, when damage occurs, and thus, causes the healing agent inside to easily spill out. It also helps in
repairing (curing) the cracked locations.
The tensile moduli of Pn, 5TPn, 10TPn, 15TPn, and 20TPn are 0.036, 0.054, 0.070, 0.078, and 0.02 GPa,
respectively, as tabulated in Table 1. Interestingly, the order of the modulus is the reverse of that of the elonga-
tion at break and is as follows: Pn < 5TPn < 10TPn < 15TPn. Only the modulus of 20TPn is very less compared
to that of Pn, as shown in Fig. 5A, and the tensile moduli of 5, 10, and 15TPn are increased by 32, 48, and 52%,
respectively. This change in the trend of the moduli also explains the increase in the stiffness of the fibers due
to the increase in the brittleness of the TPS/PVDF nanofibers owing to the addition of TPS. As the TPS con-
tent increases, the value of the tensile modulus increases, indicating a decrement in the flexibility of the PVDF
nanofibers.
The tensile strength of the TPS/PVDF nanofibers presents the same trend as the modulus. The strength
of the TPS/PVDF nanofibers increases as the percentage of TPS increases by up to 15%, and subsequently, it
reduces at 20% TPS. Compared to Pn, the tensile strength of 5, 10, and 15TPn is increased by 16, 29, and 29%
Scientific Reports | (2021) 11:908 | https://doi.org/10.1038/s41598-020-78706-3 7
Vol.:(0123456789)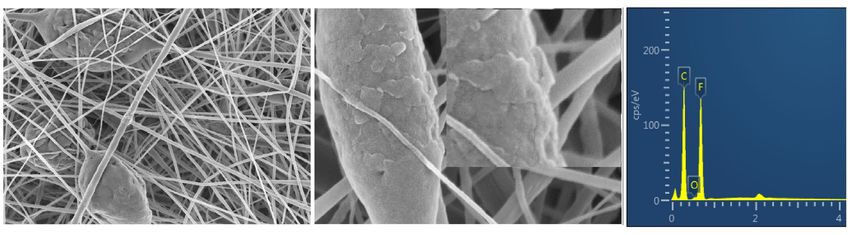
www.nature.com/scientificreports/

                            100                                                 100                                               100
                                                                        Pn                                              10TPn                                       10TPn
                                                                        5TPn                                 22%        V-10TPn                     26%             M-10TPn
                    Weight (%)   80                                     10TPn    80                                     VE-CN     80                                MEKP
                                                                        15TPn
                                 60                                     20TPn    60                                               60
                                                                        TPS

                                 40                                              40                                               40

                                 20                                              20                                               20
                                       (A)                                            (B)                                               (C)
                                   0                                             0                                                 0
                                         100 200 300 400 500 600 700                   100 200 300 400 500 600 700                       100 200 300 400 500 600 700
                                             Temperature (oC)                               Temperature (oC)                                  Temperature (oC)
                                                               VE-CN   V-10TPn   10-TPn                                                   MEKP   M-10TPn   10-TPn
                       (D)                                                                          (E)
                                   100                                                                           100                                 26%
                      Weight (%)

                                                                                                    Weight (%)
                                    80                                                                            80
                                    60                                                22%                         60
                                    40                                                                            40
                                    20                                                                            20
                                     0                                                                             0
                                             30   100 200 300 400 500 600 700                                          30   100 200 300 400 500 600 700
                                                      Temperature         (oC)                                                    Temperature (oC)
                                                       Figure 6.  TGA curves of (A) TPS/PVDF, (B) V–10TPn, (C) M–10TPn and (D,E) Schematic description about
                                                       volume % of healing agent (VE–CN and MEKP) in TPS/PVDF nano fibers in the light of thermal properties.

                                                       respectively. All the fiber mats were tested after being conditioned in a laboratory environment (23 °C and 35%
                                                       relative humidity) for 24 h under identical conditions. However, as the TPS content is further increased, both the
                                                       tensile stress and modulus are decreased. The tensile strength and modulus of 20TPn are much lower compared
                                                       to those of Pn. As the weight percentage of TPS in the nanofibers is further increased (20%), it agglomerates,
                                                       which subsequently decreases the strength and modulus of the nanofibers. Moreover, the agglomeration of TPS
                                                       increases the beads in the nanofibers, and thus, decreases the strength of the fibers. However, these agglomera-
                                                       tion problems are negligible at low weight percentages.
                                                           Samples 10TPn and VM–10TPn underwent tensile tests, and the stress–strain curves are as shown in Fig. 5B.
                                                       Their thicknesses were 0.12 mm and 0.26 mm, respectively, which suggests that the VM–10TPN sample is 2.16
                                                       times thicker than the 10TPn sample. This is because two additional components (VE resin combined with
                                                       an accelerator and MEKP hardener) were simultaneously supplied with the TPS/PVDF solution during the
                                                       co-electrospinning process. Young’s moduli E of the 10TPn mat and the VE–10TPn specimens were 0.066 and
                                                       0.041 GPa, respectively. This indicates that the 10TPn mat is fully solidified and is stiffer than the VM–10TPn
                                                       mat containing the liquid resin monomer or cure in the fiber as the core. The 10TPn is a solid structure without
                                                       any voids and VM–10TPn acts as a hollow structure with a liquid inside and is less in strength and modulus than
                                                       10TPn due to the differences in their structures. The ultimate tensile strength of the 10TPn mat is also almost
                                                       twice that of the VM–10TPn mat, as depicted in Fig. 5B.

                                                       Thermal analysis of core materials. TGA is a technique that measures the thermal stability of a given specimen
                                                       and is conducted on TPS/PVDF nanofibers. Figure 6A shows the thermographs of the TPS/PVDF nanofib-
                                                       ers. Additionally, Table 1 lists the temperatures at which the specimens are reduced by 10% weight due to the
                                                       evaporation of their moisture content. The total decomposition (Tmax) of Pn fibers is at 560 °C, whereas the
                                                       decomposition of all TPn (5TPn, 10TPn, 15TPn, and 20TPn) fibers are at 500 °C due to the less thermal stability
                                                       of TPS (Tmax 350 °C). From Fig. 5, it can be observed that the major weight loss of all the nanofibers is between
                                                       480 and 520 °C, whereas, for TPS, it is between 150 and 350 °C owing to its high combustibility, TPS presents
                                                       a two-step thermal oxidative degradation at 220 and 340 °C, and a similar degradation can be observed for 5,
                                                       10, 15, and 20TPn confirming the presence of TPS in the nanofibers. The residues of Pn, 5TPn, 10TPn, 15TPn,
                                                       20TPn, and TPS are 29, 26.5, 26, 25.2, 25, and 6%, respectively, as tabulated in Table 1. This suggests that adding
                                                       TPS reduces the residual PVDF nanofibers.
                                                           TGA explains the thermal degradation of the nanofibers, based on which the amount of the core material
                                                       in the core–shell nanofibers can also be assessed. V–10TPn and M–10TPn were tested along with three control
                                                       samples, 10TPn, and VE resin combined with CN and MEKP. Figure 6B shows the TGA plots of VE, 10TPn,
                                                       and VE–10TPn. In the case of VE resin, the shape of the TGA curve in an inert atmosphere possesses two dis-
                                                       tinct mass loss steps. The first occurs at approximately 100 °C, and the second stage of the degradation occurs
                                                       between 390 and 440 °C. The V–10TPn curve presents the thermal degradations of both the VE resin and 10-TPn,
                                                       confirming the presence of the VE resin in V–10TPn. The VE resin contents in the core–shell nanofibers are
                                                       estimated by considering the weight loss contribution from V–10TPn near 420 °C, using the weight loss of 10TPn

          Scientific Reports |               (2021) 11:908 |                https://doi.org/10.1038/s41598-020-78706-3                                                        8

Vol:.(1234567890)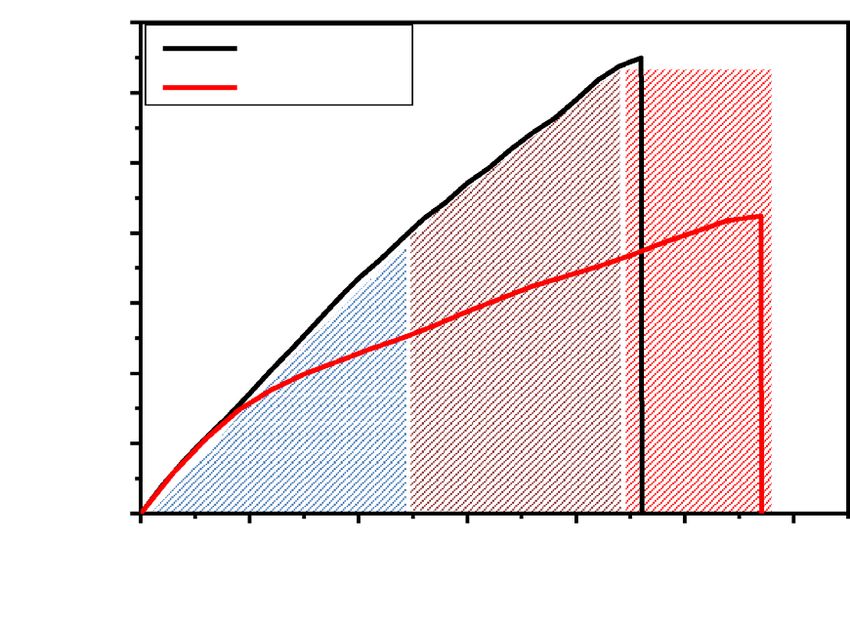
www.nature.com/scientificreports/

                                 Figure 7.  SEM images of VM–10TPn (A) scratched, (B) after 6 h, (C) after 24 h, (D) EDX mapping of
                                 VM-10TPn (E) ruptured V–10TPn nanofibers and EDX analysis at ruptured portion, and (F) ruptured M–10TP
                                 nanofibers and EDX analysis at ruptured portion.

                                 as the baseline. Thus, the VE resin content in V–10TPn was determined to be approximately 22 wt%. Similarly,
                                 Fig. 6C shows the TGA curves of MEKP, 10TPn, and M–10TPn. The MEKP curve exhibits a one-step weight
                                 loss starting at 190 °C and continuing up to 210 °C. In the case of M–10TPn, the thermal degradation pattern
                                 shows a two-step decomposition that is a combination of both the MEKP and 10–TPn curves. Considering the
                                 same approximation, the MEKP content in M–10TPn is estimated to be approximately 26 wt%41. The clearest
                                 demonstration of the quantity of the core materials (VE–CN and MEKP) in V–10TPn and M–10TPn has depicted
                                 via a 3D column graph in Fig. 6D,E.

                                 Water absorption test. Water absorption tests were conducted on the TPS/PVDF nanofibers to evaluate the
                                 effect of TPS on water absorption, and the results are tabulated in Table 1. The average water absorption percent-
                                 ages of Pn, 5TPn, 10TPn, 15TPn, and 20TPn are 10.88, 38.6, 74.86, 89.55, and 106.58%, respectively. The order
                                 of the water absorption of the fibers is as follows: 20TPn > 15TPn > 10TPn > 5TPn > Pn. The water absorption
                                 percentage increases with the increase in the TPS content in the nanofibers. The water absorption rate of PVDF
                                 is less (10.88%) than that of the TPS/PVDF fibers owing to its hydrophobic nature. Concurrently, the hydrophilic
                                 nature of TPS plays an important role in the absorption of water. Overall, the blended fibers exhibit significantly
                                 different natures than PVDF, confirming the chemical bonding of TPS with PVDF (FTIR section) and forming
                                 new types of nanofibers that are completely different from PVDF nanofibers.

                                 Self‑healing properties. Confirmation of healing agent in core–shell nanofibers by FESEM. A scratch test
                                 was performed on a VM–10TPn mat to understand the healing phenomena of the above self-healing nanofib-
                                 ers. Figure 7 shows the process mechanism of releasing a healing medicine from the self-healing nanofibers. A
                                 zoomed portion of Fig. 7A displays the self-healing nanofibers, in which grooves can be observed clearly at the
                                 scratched portion along with the breakage of nanofibers. Subsequently, i.e., after 6 h, as can be seen in Fig. 7B,
                                 the groove portion becomes narrow and the flooding out of the healing resin from the self-healing nanofibers at
                                 the broken parts can be observed clearly. Partial curing of the resin can be also observed in the figure, referring
                                 to the simultaneous release of the healing resin (VE–CN) along with the catalyst (MEKP). This phenomenon
                                 continued further and the healing resin filled the remaining groove portions, as depicted in Fig. 7C. For further
                                 confirmation of core healing compounds along with base shell polymer could be examined at groove portion by
                                 EDS elemental mapping as shown in Fig. 7D exhibiting the major elements i.e., carbon (C), Oxygen (O), Fluo-
                                 rine (F), Cobalt (Co) present in VE–CN, MEKP and 10TPn which are strong evidential for the liquid state of the
                                 core material until the curing occur. The core–shell nanofibers with VE–CN (V–10TPn) and MEKP (M–10TPn)
                                 were separately spun on carbon fibers, as illustrated in Fig. 7E,F, to display the leakage of the core material from
                                 the core–shell nanofibers. Figure 7E shows clearly the leakage of VE–CN from V–10TPn at the ruptured part
                                 and further supporting the EDS analysis showing the respective elements [PVDF (C, O, F), VE (C, O) and CN

Scientific Reports |   (2021) 11:908 |                https://doi.org/10.1038/s41598-020-78706-3                                                   9

                                                                                                                                              Vol.:(0123456789)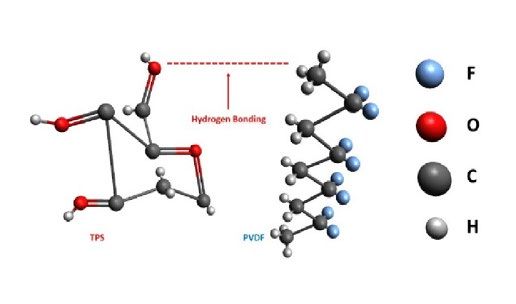
www.nature.com/scientificreports/
(A) 3.5 (B) 2.5
10TPn 0h
Tensile Strength (MPa)
3.0 VM-10TPn
Tensile Strength (MPa)
24 h
2.0 48 h
2.5 72 h
2.0 1.5
1.5 1.0
1.0
0.5
0.5 Intermediate Failure
Elastic zone zone
zone
0.0 0.0
0 10 20 30 40 50 60 0 5 10 15 20 25
Tensile Strain (%) Tensile Strain (%)
(C) 2.5 (D)
0h 100
Tensile Strength (MPa)
24 h
2.0 48 h
80
72 h
1.5
60
E/E0
1.0 40
0.5 20 10TPn VM-10TPn
0.0 0
0 5 10 15 20 25 0 14 28 42 56 70
Tensile Strain (%) Time period (h)
Figure 8. (A) Tensile test results, (B,C) Tensile stress/strain curves at periodic stretching, and (D) Relative
variation in tensile modulus of 10TPn and VM–10TPn.
(C, Co)]. Similarly, a leakage of MEKP from the M–10TPn fibers at the ruptured portions can be seen clearly in
Fig. 7F with EDX analysis exhibiting the elements of PVDF (C, O, F) and MEKP (C, O) at the ruptured portions.
Overall, the fabricated self-healing nanofibers can carry sufficient amounts of the resin and are competitive with
the existing nanofibers for self-healing applications42.
Self‑healing phenomena during tensile testing. Figure 8 presents the healing phenomena of the self-healing
nanofibers based on mechanical, digital, and morphological validations. Three deformation zones can be seen
in the stress–strain curves (Fig. 8A) of 10TPn and VM–10TPN, which are categorized into elastic, intermediate
plastic, and ultimately catastrophic failure zones. Till up to 25% of the strain range, the curve is linear and is in
the elastic zone; the intermediate plastic zone is between the strain of 25% and 45%. Subsequently, the curve
tends to rupture, which indicates the ultimate catastrophic failure zone. These deformation zones are different
for different nanofiber mats (Elastic zone, plastic zone, failure zone)43.
Tensile tests (stretching) are performed on 10TPn and VM–10TPn periodically in time intervals of 24 h (0 h,
24 h, 48 h, and 72 h) and with a 25% strain range; the corresponding results are shown in Fig. 8B,C. The tensile
strength of 10TPn at the first, second, third, and fourth stretching are 2.13, 1.58, 1.04, and 0.51 MPa, respectively.
As the number of stretching increases, the strength decreases by 76%. The decrement in the strength of 10TPn is
due to the breakage of a few nanofibers at each loading time; eventually, this effect induces the fiber mat losses, in
terms of the original strength. Similarly, the tensile strength of VM–10TPn at the first, second, third, and fourth
stretching is 1.81, 1.64, 1.4, and 1.25 MPa, respectively. Interestingly, a significant decrement in the strength
is not observed owing to the self-healing phenomena. The tensile moduli of 10TPn are 66.4, 60.2, 28.59, and
10.15 MPa at the first, second, third, and fourth stretching, respectively. The moduli present similar behavior as
the tensile strength. The modulus of VM–10TPn at the four periodic stretching modes are 36.38, 34.56, 31.5, and
26.8 MPa, respectively. In the initial stretching modes, the modulus abruptly decreases; however, in subsequent
cases, this change is not noted. The probable reason is that in the first stretching, the breakage of the number
of fibers decreases, and at each stage, curing occurs. This might suppress the stretching of the nanofibers. The
flexibility of the nanofibers is comparatively higher than those of the cured portions in the fiber mat.
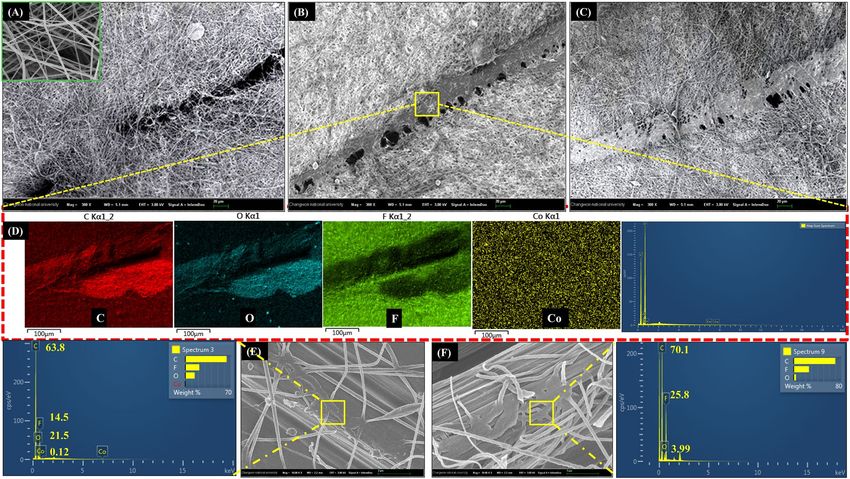
Figure 9A,B display the micro observations related to the periodical tensile test to further validate the self-
healing mechanism. Figure 9A shows the broken fibers immediately after the first stretching in the direction
of the applied tensile load. Some undisturbed fibers are present in the stretched mat, which will be involved in
further tensile stretching. In addition, during each stretching, both the resin (VE–CN) and catalyst (MEKP)-
carrying nanofibers simultaneously break. Hence, there may be a possible healing process using a curing resin,
as proven in Fig. 9B. As shown in the figure, a cured resin covers a certain area where the resin flows spreads,
and broken fibers can also be observed.
Scientific Reports | (2021) 11:908 | https://doi.org/10.1038/s41598-020-78706-3 10
Vol:.(1234567890)www.nature.com/scientificreports/
Figure 9. (A,B) Micro images of core–shell nano fibers, (C,D) digital images of 10TPn and VM–10TPn
following repeated stretching by tensile loading and (E) Schematic representation of healing mechanism.
The self-healing mechanism is further confirmed by plotting a graph of the variations in the tensile modulus
(E/E0) with the number of stretching for 10TPn and VM–10TPn, as shown in Fig. 8D. The modulus of the vari-
ation (E/E0) is calculated by considering the modulus of the first stretching as numerator (E) and the modulus
of each case as the denominator (E0). The modulus variations of 10TPn and VM–10TPn are reduced by 85% and
29%, respectively. Both the plots apparently significantly vary owing to the nature of the fabricated nanofiber
polymer and the spill out of the healing polymer. As explained in the Introduction section, PVDF is a thermo-
plastic polymer that is elastic in nature (elongation at the break, 64% (Table 1)), and the vinyl ester resin is a
thermoset fragile polymer. Hence, in the case of VM–10TPn, the modulus slightly decreases at each stretching
and finally reaches 71% at the fourth stretching because of the brittle nature of the healing resin, which also
supports the increase in the modulus at each stage. Furthermore, no breakage is observed (Fig. 9D). However,
in 10TPn, there is no healing concept; instead, there is an abrupt decrement in the modulus, which reaches
15%, with the eventual breakage of the nanofibers (Fig. 9C). The schematic representation is showed in Fig. 9E
connected to the self-healing mechanism for physical understanding. The core–shell nano fibers (VM–10TPn)
experienced in the healing process through different stages by manual damage and could be observed the healed
damage portion by the process of releasing the healing resin along with curing agents simultaneously. In the
schematic representation having total 4 stages as follows: Stage 1 showed the well-prepared core–shell nanofib-
ers (VM–10TPn). The manual damaged nanofibers shown in stage-2. The core material releasing from broken
nano-fibers has demonstrated in stage-3 and in stage-4 the effective bonding of nano-fiber with the chemical
reaction between VE, CN and MEKP and a solid patch forming at broken edges of nano-fibers.
Conclusions
Self-healing nanofibers are successfully prepared. The outcomes of the study are as follows: FESEM and XRD
analysis supporting the mechanical properties by increasing the diameter (115 → 184 nm) and crystallinity
(40.5 → 44.1%) of the PVDF nanofibers with TPS. Spectral analysis proved the formation of the green PVDF
compound by chemical interaction. The TGA results of V–10TPn and M–10TPn confirmed the presence and also
the quantity of VE–CN (22%) and MEKP (26%) in the core–shell nanofibers. Periodic tensile loadings within
the elastic zone on the nanofibers and core–shell nanofibers showed marginal differences in the modulus. They
evidentially confirmed the self-healing behavior by observing the recovery of the modulus in each stretching of
the core–shell nanofibers. Moreover, microanalysis further confirmed clearly the flow of the healing resin (VE
resin) at the scratched portion in the pierced fibers, and curing process was conducted automatically by inter-
acting with the curing agents after some time. Overall, this self-healing finding may have the capability to apply
the real-time structural implementation in aerospace, automobile, electronic, bio-medicinal, etc., especially for
recovery of micro damages in natural/synthetic fiber-reinforced composites, the authors’ continuous future study.
Moreover, these findings strongly support the research on self-healing for its further advancement and create a
unique path in the direction of biodegradability, which is a major global issue in the present engineering sectors.
Received: 5 August 2020; Accepted: 26 November 2020
References
1. Barhoum, A. et al. Nanofibers as new-generation materials: From spinning and nano-spinning fabrication techniques to emerging
applications. Appl. Mater. Today 17, 1–35 (2019).
2. Lee, M. W., An, S., Kim, Y.-I., Yoon, S. S. & Yarin, A. L. Self-healing three-dimensional bulk materials based on core–shell nanofib-
ers. Chem. Eng. 334, 1093–1100 (2018).
3. Wang, X. & Nakane, K. Preparation of polymeric nanofibers via immersion electrospinning. Eur. Polym. 134, 109837. https://doi.
org/10.1016/j.eurpolymj.2020.109837 (2020).
4. Paimard, G. et al. An impedimetric immunosensor modified with electrospun core–shell nanofibers for determination of the
carcinoma embryonic antigen. Sens. Actuat. B Chem. 311, 127928. https://doi.org/10.1016/j.snb.2020.127928 (2020).
Scientific Reports | (2021) 11:908 | https://doi.org/10.1038/s41598-020-78706-3 11
Vol.:(0123456789)www.nature.com/scientificreports/
5. Zhang, C., Li, Y., Wang, P. & Zhang, H. Electrospinning of nanofibers: Potentials and perspectives for active food packing. Compr.
Rev. Food Sci. 19, 479–502 (2020).
6. Yu, D.-G. et al. Multifluid electrospinning for the generation of complex nanostructures. Wiley Interdiscip. Rev. 12, e1601. https://
doi.org/10.1002/wnan.1601 (2020).
7. Rahmati, M. et al. Electrospinning for tissue engineering applications. Prog. Mater. Sci. https: //doi.org/10.1016/j.pmatsc i.2020.10072
1 (2020).
8. Torre-Muruzabal, A., Daelemans, L., Van Assche, G., De Clerck, K. & Rahier, H. Creation of a nanovascular network by electro-
spun sacrificial nanofibers for self-healing applications and its effect on the flexural properties of the bulk material. Polym. Test.
54, 78–83 (2016).
9. Kanellopoulos, A., Giannaros, P. & Al-Tabbaa, A. The effect of varying volume fraction of microcapsules on fresh, mechanical and
self-healing properties of mortars. Constr. Build. Mater. 122, 577–593 (2016).
10. Naga Kumar, C., Prabhakar, M. N. & Song, J. Result of vascular tube design on the curative and mechanical performance of modi-
fied carbon fibers/hybrid resin self-healing composites. Polym. Compos. 41, 1913–1924 (2020).
11. Latif, M., Naga Kumar, C., Prabhakar, M. N. & Song, J. Development of hybrid composites with improved mechanical and self-
healing properties. Fibers Polym. 20, 413–420 (2019).
12. Chowdhury, R. A. et al. Self-healing epoxy composites: Preparation, characterization and healing performance. J. Mater. Res.
Technol. 4, 33–43 (2015).
13. Jouyandeh, M. et al. Highly curable self-healing vitrimer-like cellulose-modified halloysite nanotube/epoxy nanocomposite coat-
ings. Chem. Eng. J. 396, 125196. https://doi.org/10.1016/j.cej.2020.125196 (2020).
14 Wang, H. et al. Self-healing double-cross-linked supramolecular binders of a polyacrylamide-grafted soy protein isolate for LI-S
batteries. ACS Sustain. Chem. Eng. 8, 12799–12808 (2020).
15 Seidi, F. et al. Self-healing polyol/borax hydrogels: Fabrications, properties and applications. Chem. Rec. 20, 1–22 (2020).
16. Sahatiya, P., Kannan, S. & Badhulika, S. Few layer M oS2 and in situ poled PVDF nanofibers on low cost paper substrate as high
performance piezo-triboelectric hybrid nanogenerator: Energy harvesting from handwriting and human touch. Appl. Mater. Today
13, 91–99 (2018).
17 Mayeen, A. et al. Flexible dopamine-functionalized BaTiO3/BaTiZrO3/BaZrO3–PVDF ferroelectric nanofibers for electrical energy
storage. J. Alloys Compd. 837, 155492. https://doi.org/10.1016/j.jallcom.2020.155492 (2020).
18 Chen, C. et al. Enhanced piezoelectric performance of B iCl3/PVDF nanofibers-based nanogenerators. Compos. Sci. Technol. 192,
108100. https://doi.org/10.1016/j.compscitech.2020.108100 (2020).
19 Dai, B. et al. Construction of self-healing internal electric field for sustainably enhanced photocatalysis. Adv. Funct. Mater. https
://doi.org/10.1002/adfm.201807934 (2019).
20. Shah, A. A. et al. High performance thin-film nanocomposite forward osmosis membrane based on PVDF/bentonite nanofiber
support. J. Ind. Eng. Chem. 86, 90–99 (2020).
21 Pu, X. et al. Flexible PVDF/nylon-11 electrospun fibrous membranes with aligned ZnO nanowires as potential triboelectric
nanogenerators. Chem. Eng. 398, 125526. https://doi.org/10.1016/j.cej.2020.125526 (2020).
22. Haddadi, S. A., Ahmad Ramazani, S. A., Talebi, S., Fattahpour, S. & Hasany, M. Investigation of the effect of nanosilica on rheo-
logical, thermal, mechanical, structural, and piezoelectric properties of poly(vinylidene fluoride) nanofibers fabricated using an
electrospinning technique. Ind. Eng. Chem. 56, 12596–12607 (2017).
23. Mahanty, B., Maity, K., Sarkar, S. & Mandal, D. Human skin interactive self-powered piezoelectric e-skin based on PVDF/MWCNT
electrospun nanofibers for non-invasive health care monitoring. Mater. Today. 21, 1964–1968 (2020).
24. Lee, M. W., Yoon, S. S. & Yarin, A. L. Solution-blown core–shell self-healing nano- and microfibers. ACS Appl. Mater. Interfaces
8, 4955–4962 (2016).
25. Dong, Y., Li, S. & Zhou, Q. Self-healing capability of inhibitor-encapsulating polyvinyl alcohol/polyvinylidene fluoride coaxial
nanofibers loaded in epoxy resin coatings. Prog. Org. Coat. 120, 49–57 (2018).
26 Choolaei, M. et al. Influence of graphene oxide on crystallization behavior and chain folding surface free energy of
poly(vinylidenefluoride-co-hexafluoropropylene). Macromol. Chem. Phys. 19, 1700103. https://doi.org/10.1002/macp.201700103
(2017).
27. Wang, X. et al. Tactile-sensing based on flexible PVDF nanofibers via electrospinning: A review. Sensors 18, 330 (2018).
28. Prabhakar, M. N. & Song, J. Fabrication and characterization of starch/chitosan/flax fabric green flame-retardant composites. Int.
J. Biol. Macromol. 119, 1335–1343 (2018).
29. Jia, J. & Wang, C. A facile restructuring of 3D high water absorption aerogels from methoxy polyethylene glycol-polycaprolactone
(mPEG-PCL) nanofibers. Mater. Sci. Eng. C 94, 965–975 (2019).
30. Wang, M. et al. Preparation of PVDF/PVP core–shell nanofibers mats via homogeneous electrospinning. Polymer 55, 2188–2196
(2014).
31. Al-Ajrash, S. M. N. & Lafdi, K. The role of carbon and SiC crystallinities in the oxidation and mechanical property improvement
of hybrid nano-fibers. Ceram. Int. 45, 7286–7294 (2019).
32 Bian, Y., Wang, S., Zhang, L. & Chen, C. Influence of fiber diameter, filter thickness, and packing density on PM2.5 removal
efficiency of electrospun nanofiber air filters for indoor applications. Build. Environ. 170, 106628. https://doi.org/10.1016/j.build
env.2019.106628 (2020).
33. Du, J. & Hsieh, Y. Cellulose/chitosan hybrid nanofibers from electrospinning of their ester derivatives. Cellulose 16, 247–260 (2009).
34. Pinto, T. V. et al. Light driven PVDF fibers based on photochromic nanosilica@naphthopyran fabricated by wet spinning. Appl.
Surf. Sci. 470, 951–958 (2019).
35. Prabhakar, M. N., Shah, A. R. & Song, J.-I. Improved flame-retardant and tensile properties of thermoplastic starch/flax fabric
green composites. Carbohydr. Polym. 168, 201–211 (2017).
36. Shanks, R. & Kong, I. In Thermoplastic Starch, Thermoplastic Elastomers (ed. El-Sonbati, A.Z.) 95–116 (In Tech, 2012).
37. Jana, S., Garain, S., Sen, S. & Mandal, D. The influence of hydrogen bonding on the dielectric constant and the piezoelectric energy
harvesting performance of hydrated metal salt mediated PVDF films. Phys. Chem. Chem. Phys. 17, 17429–17436 (2015).
38. Mi, C., Ren, Z., Li, H., Yan, S. & Sun, X. Synergistic effect of hydrogen bonds and diffusion on the β-crystallization of poly(vinylidene
fluoride) on poly(methyl methacrylate) interface. Ind. Eng. Chem. Res. 58, 7389–7396 (2019).
39. Yin, Z., Tian, B., Zhu, Q. & Duan, C. characterization and application of PVDF and its copolymer films prepared by spin-coating
and langmuir-blodgett method. Polymers 11, 2033. https://doi.org/10.3390/polym11122033 (2019).
40 Lee, H. et al. Enhancement of mechanical properties of polymeric nanofibers by controlling crystallization behavior using a simple
freezing/thawing process. RSC Adv. 7, 43994–44000 (2017).
41. Neisiany, R. E., Khorasani, S. N., Kong, J., Lee, Y. & Ramakrishna, S. Encapsulation of epoxy and amine curing agent in PAN
nanofibers by coaxial electrospinning for self-healing purposes. RSC Adv. 6, 70056–70063 (2016).
42. An, S. et al. Highly flexible transparent self-healing composite based on electrospun core–shell nanofibers produced by coaxial
electrospinning for anti-corrosion and electrical insulation. Nanoscale 7, 17778–17785 (2015).
43. Khansari, S., Sinha-Ray, S., Yarin, A. L. & Pourdeyhimi, B. Stress–strain dependence for soy-protein nanofiber mats. J. Appl. Phys.
111, 044906 (2012).
Scientific Reports | (2021) 11:908 | https://doi.org/10.1038/s41598-020-78706-3 12
Vol:.(1234567890)www.nature.com/scientificreports/
Acknowledgements
The authors acknowledge the Basic Science Research Program through the National Research Foundation of
Korea funded by the Ministry of Science Education (2019R1A2B5B03004980 and 2018R1A6A1A03024509) for
supporting this study.
Author contributions
N.K.: Conceptualization, Methodology, Investigation, Formal analysis, Visualization, Writing—original draft,
Writing—review and editing. M.N.P.: Methodology, Investigation. J.S.: Funding acquisition, Supervision.
Competing interests
The authors declare no competing interests.
Additional information
Correspondence and requests for materials should be addressed to J.S.
Reprints and permissions information is available at www.nature.com/reprints.
Publisher’s note Springer Nature remains neutral with regard to jurisdictional claims in published maps and
institutional affiliations.
Open Access This article is licensed under a Creative Commons Attribution 4.0 International
License, which permits use, sharing, adaptation, distribution and reproduction in any medium or
format, as long as you give appropriate credit to the original author(s) and the source, provide a link to the
Creative Commons licence, and indicate if changes were made. The images or other third party material in this
article are included in the article’s Creative Commons licence, unless indicated otherwise in a credit line to the
material. If material is not included in the article’s Creative Commons licence and your intended use is not
permitted by statutory regulation or exceeds the permitted use, you will need to obtain permission directly from
the copyright holder. To view a copy of this licence, visit http://creativecommons.org/licenses/by/4.0/.
© The Author(s) 2021
Scientific Reports | (2021) 11:908 | https://doi.org/10.1038/s41598-020-78706-3 13
Vol.:(0123456789)You can also read