Supply-side disruptions are dragging down the automotive sector
←
→
Page content transcription
If your browser does not render page correctly, please read the page content below
Supply-side disruptions are
dragging down the automotive
sector
By   Sophie   Guilloux-Nefussi   and   Elena   Rusticelli,   OECD
Economics Department.

The car industry has been severely affected by supply-side
constraints in recent months. Shortages of semiconductors and
other intermediate goods, delays in supplier delivery times
and bottlenecks in container shipping have forced car
manufacturers around the world to reduce production despite
strong global demand.

In the first ten months of 2021, motor vehicle production in
the euro area was 26% lower than in the same period of 2019,
with respective shortfalls of 24% and 9% in Japan and the
United States. Inventory levels have also fallen sharply in
many countries. In the United States, the auto industry’s
inventory-to-sales ratio (the number of motor vehicles in
stock relative to monthly sales) declined to a low of 0.4 in
October 2021, compared to the long-term average of between
2-2.5. The reduced availability of new cars and low inventory
levels have hit global car sales, which fell by over 20%
between April and September 2021, a pace of decline only seen
previously in deep recessions. Strong demand and reduced
supply have also led to substantial upward pressure on new and
used car prices, contributing to the surge in consumer price
inflation in many countries this year.

The transport equipment industry is strongly linked through
global value chains, especially in Europe. In 2019, more than
80% of sectoral production in Hungary, Slovakia and Slovenia
involved goods that crossed at least two borders along the
production process, with this share remaining above 50% for
most European countries.

Globally, electronics and electrical equipment represent 6% of
total motor vehicle inputs. These inputs are typically sourced
from trade partners in the same country or region (Figure 1).
In Japan and Korea, more that 70% of the electronics and
electrical equipment inputs in the motor vehicle sector are
sourced domestically and 20% from elsewhere in Asia. US and
Canadian producers also rely on regional value chains, with
about 60-75% of electronics and electrical equipment inputs
sourced from the Americas.      In many central and eastern
European countries, the share of electrical inputs from Europe
is above 70%. Although the share of inputs supplied directly
from Asia is small in North America and Europe, producers can
still be heavily reliant on critical parts and components that
are available from only a few suppliers.

Figure 1. Regional value chains are important in the motor
vehicle sector

Note: The colours represent the regions from which inputs are
sourced. The bars with stripes represent the percentage share
of inputs sourced domestically, while the solid-colour bars
correspond to the percentage shares of imported inputs.
America includes Brazil, Canada, Mexico and United States.
Asia and Pacific includes Australia, China, Chinese Taipei,
Indonesia, India, Japan and Korea. Based on input data in
current prices and expressed in USD terms.
Source: World Input-Output Database (WIOD), 2016 release.
What are the relative contributions of supply and demand
imbalances to the decline in motor vehicle production?
Econometric estimates show that survey indicators of
suppliers’ delivery times and new orders (capturing supply
disruptions and demand pressure respectively) both have
significant effects on motor vehicle production. The estimated
relationship can be used to calculate the difference between
car production in 2021 and the output level that might
otherwise have been expected from demand growth if suppliers’
delivery times had remained unchanged from their level in the
fourth quarter of 2020. This gap is substantial in a number of
countries.

Longer supplier delivery times and other disruptions are found
to have reduced motor vehicle production in Germany
particularly sharply, by an amount equivalent to over 1½ per
cent of GDP in the first nine months of 2021 (Figure 2,
Panel A). Production losses due to supply disruptions are also
estimated to have been substantial in the Czech Republic,
Japan and Mexico, amounting to ½ to 1% of GDP. In many other
countries, the impact of supply constraints on production is
smaller, and motor vehicle production represents a lower share
of overall activity, but there is still a noticeable drag on
GDP in 2021. Aggregating across countries, there is a growing
gap between actual car production and the level that might
have been reached in the absence of supply constraints (Figure
2, Panel B). Overall, actual production has been around 25%
lower this year than in the scenario with no additional supply
constraints in 2021.

Figure 2. Supply-side constraints are        depressing   car
production in 2021 and weighing on GDP
Note: Panel A shows the implied impact on GDP from the gap
between actual motor vehicle production in the first nine
months of 2021 and production in a scenario in which new
orders follow their actual path in 2021, while suppliers’
delivery times are held at their 2020Q4 level. Panel B shows
the overall gap between scenario and actual production, across
countries accounting for 85% of global motor vehicle
production. Based on estimates for a panel of 30 OECD and
emerging economies, over April 1996 to December 2019, with
monthly growth rates of car production regressed on country-
specific manufacturing PMI indices weighted by the share of
motor vehicles output, lags of the dependent variable and
fixed effects.
Source: Markit; Eurostat; OECD Structural Analysis database;
OECD Trade in Value Added database; and OECD calculations.
Supply-side strains are expected to persist. At the onset of
the pandemic, automotive producers cut orders for chips in
anticipation of lower demand and semiconductor producers
shifted supply to meet soaring demand for computers, webcams,
tablets and other electronic and communication equipment. This
redirection of supply has contributed to the current shortages
faced by carmakers. In 2020, the automotive industry
represented around one-tenth of global semiconductor demand
while communication and computers, the two largest
semiconductor markets by end-use, jointly accounted for two-
thirds of total demand, giving them relative priority with
suppliers. In this context, the current supply shortage for
motor vehicle manufacturers may continue well into 2022.
Additional precautionary demand from manufacturers, in order
to rebuild stock levels, could also exacerbate demand/supply
imbalances (Rees and Rungcharoenkitkul, 2021).

References

Rees, D. and P. Rungcharoenkitkul (2021), “Bottlenecks: causes
and macroeconomic implications”, BIS Bulletin, No. 48.

OECD (2021), OECD Economic Outlook, Volume 2021 Issue 2.
https://doi.org/10.1787/66c5ac2c-en

How        the        digital
transformation can help Japan
secure sustainable growth
By Kei Oguro, Douglas Sutherland and Vincent Koen, OECD
Economics Department

The pandemic dealt a heavy blow to the Japanese economy, at a
time past reforms were bearing fruit in raising labour force
participation and reducing the size of budget deficits.
Difficulties in bringing infections under control and the
pressure new cases put on hospitals forced the government to
declare a succession of states of emergency. The prolonged
imposition of sanitary measures in combination with voluntary
distancing measures held back growth after the initial bounce-
back in economic activity (Figure 1).       However, after a
relatively slow start, the share of the fully-vaccinated
population is now amongst the highest in the OECD. The
government has recently outlined a new sizeable policy package
to support the recovery. Thus conditions are in place to
underpin a strong pick-up in growth, once the impact of the
omicron variant is mitigated.

Figure 1. The pandemic hit economic activity hard

Real GDP

Source: OECD Economic Outlook Database No.110.
The pandemic exposed structural weaknesses, notably the long-
standing plight of temporary and non-regular workers, who were
more exposed to the economic downturn. But other weaknesses
had hitherto been less in focus. The difficulties workers,
businesses and government faced in moving to remote working
and targeting support to those most in need, highlighted the
patchiness of the digital transformation.

The OECD Economic Survey of Japan advocates policies to
address these weaknesses. These policies would contribute to
sustainability by boosting productivity and resilience to
future shocks. In addition, they would reduce inequalities and
promote fiscal sustainability.

Addressing structural weaknesses to boost productivity and
labour supply

Past reforms have successfully increased labour force
participation by women and older workers. Yet more can be
done, particularly by promoting workplace flexibility and
addressing other barriers to participation. Continuing Work
Style reforms that promote flexibility and cap overtime hours
while increasing the provision of childcare places will help
boost participation further (Figure 2). Reforms such as
promoting equal pay for equal work also promise to reduce
inequalities by eroding the differences between regular
workers and those workers with temporary jobs or less secure
positions. Output can be boosted further by raising
productivity growth, which has been very sluggish in recent
years. One aspect of this is weak business dynamism hindering
the diffusion of new technologies. Policies to enhance entry
and exit of firms, such as by increasing competitive pressures
and facilitating bankruptcy, could help in this context.

Figure 2. Labour force participation has risen but gender gaps
remain sizeable
Source: OECD LFS by sex and age indicators and gender wage gap
indicator.
Making the most of digital transformation

Japan is well placed to benefit from greater digitalisation.
The digital infrastructure is well-developed and most people
are highly skilled. However, while some parts of the economy
are at the international frontier, such as in robotics, the
diffusion of new technologies is often not widespread. Small
firms and those in the service sector in particular often make
less use of digital technologies. Furthermore, research and
development in the ICT sector is weaker than in the rest of
the economy and than in ICT sectors elsewhere in the OECD.
Policies that strengthen business dynamism and promote the
diffusion of new technologies would help lift productivity.
Complementary investments in intangible capital are needed to
ensure that the potential benefits are fully exploited.

The government itself can also play a role in promoting the
adoption of digital tools. At present, hankos (physical
stamps) are still widely required for many official procedures
and the use of online forms for government services is amongst
the lowest in the OECD (Figure 3) and this has hindered the
development of digital service provision. Some parts of
government have already taken the initiative to raise e-
government supply, to wit the case of the city of Fukuoka,
which has identified around 3 800 procedures that can now be
completed without a hanko. However, more can be done in this
direction and to utilise available data. The newly established
Digital Agency can push such developments across government.

Figure 3. Individuals using the Internet for sending filled
forms via public authorities’ websites
Source: ICT Access and Usage by Households and Individuals
database, Main Science and Technology Indicators.
To capture the full benefits from digitalisation, policy needs
to ensure people have the necessary skills. The government has
recently ensured that schoolchildren have access to computers,
but schools and teachers are often unprepared and need
training and support to make best use of them. In addition,
comparatively few students graduate in science, technology,
engineering and mathematics (STEM) disciplines, particularly
women (Figure 4). Reforming STEM curricula to make them more
attractive to study and breaking down the barriers, especially
for women, could enhance labour supply and deepen the pool of
talent in a digital era. Finally, the system of firm-based
training and adult learning is weak. Promoting training and
job mobility will also help raise skills and productivity and
help those workers most at risk from technological shocks
remain in employment longer.

Figure 4. Relatively few students graduate in science,
technology, engineering or mathematics
Source: OECD Education at a Glance, 2020.
References: OECD Economic Surveys: Japan 2021

Austria: Addressing three
major    challenges   for   a
stronger and more sustainable
recovery
By Dennis Dlugosch and Rauf Gönenç, OECD Economics Department

Austria faces several challenges. Beyond the immediate task to
minimise the human and economic costs of the pandemic,
structural reforms to ensure the long-run sustainability of
public finances, to promote more and better employment and the
transition to a greener economy are key priorities for
delivering on stronger and greener growth than before the
pandemic.

While the country-wide lockdown to contain the fourth wave of
COVID-19 infections weighed on growth during the last two
months of 2021, GDP is projected to recover quickly and grow
by around 5% in 2022 and 2.5% in 2023. Bold fiscal stimulus,
using the fiscal space made available by prudent management in
the past, supported the resilience and recovery of the economy
and limited job losses and bankruptcies. Subsequently,
economic activity grew faster than expected in the first three
quarters of 2021 and the level of economic activity has
surpassed its pre-crisis levels already in the summer of 2021
(Figure 1).

Figure 1. The economy is recovering fast from a severe shock

Real GDP

Source: OECD (2021), OECD Economic Outlook: Statistics and
Projections (database).
Near-term risks to the outlook are tilted to the downside. New
sanitary restrictions would reduce growth prospects, notably
in hospitality sectors which contribute significantly to
Austria’s incomes and regional cohesion by providing jobs in
remote areas.

The OECD Economic Survey of Austria 2021 highlights three key
economic policy challenges. First, policymakers need to
restore medium-term fiscal sustainability. This will help to
address the high level of public debt as compared to national
standards following the ample economic and social supports
mobilised during the pandemic. The second big challenge is to
boost labour force participation, particularly of women and
seniors. Shortfalls in labour force participation are weighing
on economic growth and public finances, and denting
individuals’ living standards. The third key policy challenge
is aligning total greenhouse gas emissions with the intendent
trajectory. Plans to phase in carbon prices starting from 2022
are welcome. Reaching the ambitious 2040 goal – 10 years
before the EU target date – will nevertheless be difficult.

I. Ensuring long-term fiscal sustainability

Following effective anti-COVID fiscal supports, the gross
public debt is projected to increase from 70.6% in 2019 to
around 80% of GDP by 2022 (Maastricht definition). This level
is elevated compared to national historical standards and may
restrict the authorities’ fiscal room of action in the future.

New spending pressures are arising from population ageing and
other policy needs, such as investments in decarbonisation and
digitalisation of the economy. The share of public spending in
GDP is already high, at around 50% of GDP in 2019. The
additional demands for public investment and expenditure will
require new prioritisation procedures to protect fiscal
sustainability. A medium-term fiscal consolidation strategy,
including a strengthened medium-term expenditure framework
covering the federal government, Lander and municipalities,
that spars room for needed fiscal action in the future should
complement the prioritisation procedures.

II. Creating more and better jobs

The pandemic has exacerbated vulnerabilities on labour
markets. Long-term unemployment soared in the second half of
2020, although from a relatively low rate, before declining
partially. Skill mismatches have increased in all regions and
labour and skill shortages constitute a major impediment to
faster activity growth in many sectors. These shortages have
been amplified as some immigrant workers have returned to
their home country during the pandemic. There is considerable
potential for higher labour force participation by certain
population groups, including women and seniors.

Facilitating the participation of senior workers who retired
too early from the labour force is essential. Key in this
regard would be to improve rehabilitation and up-skilling
measures, further reform access to disability pensions, and
enhance incentives to continue working at an old age by
adapting working conditions.

Figure 2. Labour force participation of women could improve
further

Full-time female employment rate, 20-64 year-olds, 2020
Source: Eurostat (2021), Labour Force Survey Statistics.
Full-time employment of working-age women in Austria needs to
increase. It currently stands at only 50%, well below the EU
average of 65% (Figure 2). The Survey recommends to bolster
the availability and quality of early child care services
throughout the country, including in rural areas. Austria has
one of the lowest enrolment rates in early childhood education
and care in the OECD. The OECD also recommends encouraging the
balance use of parental leaves for a more equal sharing of
paid and unpaid work between mothers and fathers.

III. Ensuring a fair and efficient transition towards a green
economy

Austria’s ambitious target of carbon neutrality by 2040 – 10
years earlier than the EU goal – is welcome. Austria has
already a high share of renewables in total energy supply and
a new law that aims to shift the country to 100% carbon-free
electricity by 2030. However, the carbon intensity of the
economy has not declined in the most recent years, and has
fallen behind comparable countries.

The recently announced Eco-Social Tax Reform is a major step
forward in the pricing of emissions. It will help foster a
market-oriented approach to carbonless growth. Further
emission cuts will nevertheless be needed across all sectors,
particularly in transportation, buildings and industrial
processes, where the potential is large.

Figure 3. Austria is not on track to reach its Paris agreement
targets

Per capita metric tons of CO2 equivalent

Note: Total GHG emissions exclude LULUCF (land-use, land-use
change and forestry). Scatters in 2030 indicate IMF implied
unconditional nationally determined contribution (NDC)
economy-wide target levels on GHGs excluding LULUCF. The
population estimate for 2030 is based on the UN population
data with the medium-variant projection. Dotted lines refer to
the linear emission trajectories required to reach the
announced targets in 2030.
Source: OECD calculations based on IMF Climate Database, and
United Nations (2019). World Population Prospects 2019.
New emission regulations will have to be introduced. Carbon
prices will need to be harmonised and increased further.
Austria needs to better leverage its remarkable capabilities
in the area of R&D to expand emission-saving innovations. More
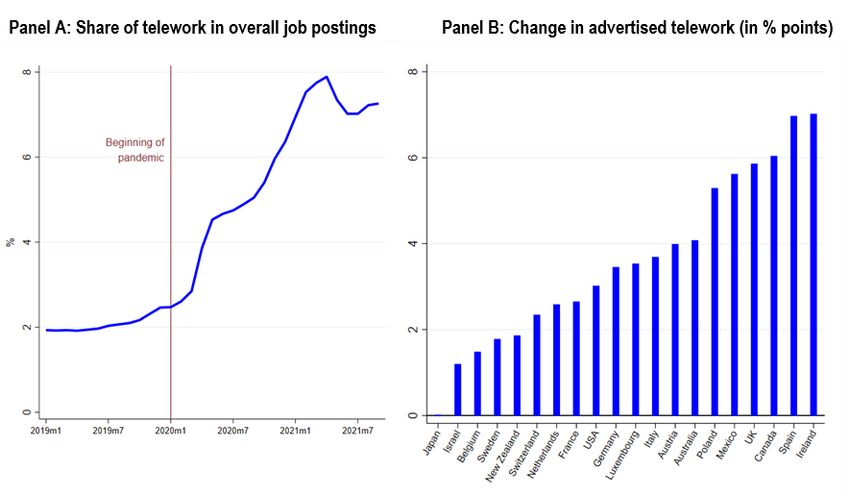
rigorous climate policies would however have important
distributional impacts. The users of carbon-intensive goods
and services (including fossil fuel cars and poorly insulated
houses) would be strongly affected. Compensation for low-
income households would need to be combined with forward-
looking disclosure of the intended regulatory and price
changes after 2025, to improve medium-term predictability and
help firms and households to adjust well in advance.

References

OECD (2021), OECD Economic Surveys: Austria 2021, OECD
Publishing, Paris, https://doi.org/10.1787/eaf9ec79-en.

OECD (2019), OECD Economic Surveys: Austria 2019, OECD
Publishing, Paris, https://doi.org/10.1787/22f8383a-en.

Will telework persist after
the pandemic?
By Pawel Adrjan, Alexandre Judes, Tara Sinclair (Indeed Hiring
Lab),     Gabriele      Ciminelli,       Michael      Koelle,
and Cyrille Schwellnus (OECD Economics Department)

The pandemic has triggered a surge in telework. In a new
paper, we analyse developments in online job postings that
advertise telework across 20 OECD countries over the past two
years. This allows us to provide new insights into the extent
and drivers of telework adoption during COVID-19.

Job postings that advertise telework differ from measures
of realised telework: in contrast to realised telework, job
postings relate to firms’ future hires rather than telework
adoption by their existing workforces. However, online job
postings signal firms’ expectations of future developments in
telework, and as such provide the best available measure of
its medium-term adoption, beyond ad-hoc arrangements adopted
during COVID-19 related lockdowns.

On average across countries, advertised telework more than
tripled during the pandemic…

We find that the average share of remote postings across the
countries in the study more than tripled from just 2.5% of job
postings in January 2020 to 7.9% in April 2021.
Despite the easing of restrictions during the first half of
2021, the average share of remote postings remained near
its peak at 7.5% in September 2021 (Figure 1, Panel A). While
advertised telework increased almost everywhere, there were
notable differences across countries, raising the question of
the role of policies and institutions             in   telework
adoption during the pandemic (Panel B).

Figure 1. Advertised telework more than tripled

Note: Panel A depicts the average share of job postings
advertising telework from January 2019 to September 2021
across 20 OECD countries. Panel B depicts the difference in
the average share of advertised telework during the pandemic
period (January 2020 to September 2021) and its average share
during the pre-pandemic period (2019) for each of the 20
countries.
Source: Adrjan et al. (2021)
Pandemic-driven mobility restrictions were a catalyst for
remote work…

Restrictions to mobility explain about one third of the
differences in the rise of remote postings across countries
between January 2020 and September 2021. In countries where
mobility restrictions were high, such as Ireland, Italy, Spain
or the United Kingdom, the share of remote work increased
significantly more than in countries where restrictions were
low, such as Japan and New Zealand (Figure 2).

Figure 2. Government restrictions boosted advertised telework
Note: The Figure relates the Oxford Covid-19 Government
Response Stringency Index to the pandemic change in the share
of job postings advertising telework. The government
restriction index is calculated as the mean value of the
Oxford Stringency Index over January 2020 to September 2021.
The change in advertised telework during the pandemic refers
to the change in advertised telework during the pandemic.
Source: Adrjan et al. (2021)
… but the easing of government restrictions has so far not
reduced advertised telework

Our econometric analysis suggests that advertised telework
responds strongly to tightening government restrictions
but only weakly and temporarily so to easing restrictions. In
other words, government-imposed mobility restrictions appear
to durably drive up advertised telework even once they are
fully lifted.
The weak response of advertised telework to easing
restrictions is overwhelmingly driven by countries with high
levels of digital infrastructure, suggesting that
telework will be particularly persistent in digitally well-
prepared countries.

For instance, in Italy, where internet penetration is
relatively low, the share of remote work increased by more
than 9 percentage points from January 2020 to April 2021 but
decreased by five percentage points in the following five
months as restrictions were eased. In contrast, in the
United States, where internet penetration is high, the share
of teleworkable job postings increased by about seven
percentage points between January 2020 and January 2021, at
the peak of restrictions, and remained at about that level
during the subsequent period of easing, suggesting that
companies permanently integrated remote work into their
organisation rather than treating it as a temporary remedy.

Conclusion: Telework is likely here to stay

In sum, our analysis suggests that government-imposed mobility
restrictions have catalysed telework. But the easing of
restrictions has so far not triggered an equivalent reduction,
even during the first half of 2021 when, in many
countries, the easing occurred in the context of rapidly
rising vaccination rates and was thus perceived to be more
persistent than in 2020. This suggests that remote work is
here to stay even once the pandemic recedes.

In order to benefit from the possible diffusion of remote work
in the coming years, public policies should try to make the
most of its potential effects on productivity and well-being.
This may include ensuring that workers have a suitable working
environment (e.g. computer equipment, office and childcare
facilities), facilitating the dissemination of best management
practices (e.g. moving from a culture of presenteeism to an
output-oriented assessment of worker productivity) or ensuring
that everyone has access to a fast, reliable and secure
internet connection (e.g. in rural areas).

Reference

Adrjan, P., et al. (2021), “Will it stay or will it go?
Analysing developments in telework during COVID-19 using
online job postings data”, OECD Productivity Working Papers,
No.            30,             OECD            Publishing,
Paris, https://doi.org/10.1787/aed3816e-en.

Towards net zero emissions in
Denmark
By Andrew Barker, Hélène Blake and Patrick Lenain, OECD
Economics Department

Denmark has embarked on an impressive climate policy agenda
with ambitous emissions targets, carbon pricing, innovation,
public investment and regulatory policies. The share of
renewables in electricity generation has grown from less than
10% in the mid-1990s to over 80% in 2020. This has been the
key driver behind the sharp cuts in greenhouse gas emissions
by 36% between 1990 and 2019, making Denmark one of the least
carbon-intensive countries in the OECD. Emission cuts have
been achieved without compromising economic or jobs growth,
with progress in wind generation in particular contributing to
the development of an important export industry.

Denmark intends to go further with a a legally-binding
commitment to cut emissions by 70% by 2030 from 1990 (Figure
1). This will require halving emissions from 2019 levels – a
similar reduction in the next decade as has been achieved in
the past 30 years. Cutting emissions at such a fast pace will
be challenging, with substantial disruptions and socioeconomic
challenges. Radical technological changes and vast resource
reallocation will take place throughout the economy, similar
to the transformational change in the Danish electricity
sector since the mid-1990s. Greater certainty on policy
measures to meet these targets will be important to send
strong signals to investors. Additional investment in the
order of 1% to 2% of GDP will be needed, which could largely
come from the private sector with the right incentives.

Job losses to date in high-carbon activities have been offset
by new opportunities in green industries – workers with skills
in offshore oil and gas have for instance retrained to work in
offshore wind. The succesful Danish “flexicurity” system,
which combines a safety net with support for skill building
and job search, will continue to play a key role to facilitate
this sizeable transformation.

Figure 1. Meeting targets will require further progress in all
sectors
Source: UNFCCC GHG Data Interface; Danish Climate Law.
The energy sector must continue its transition towards
renewable sources. Scarce supplies of sustainable woody
biomass, on which Denmark has relied for low-emissions
district heating, will need to be freed up for the difficult-
to-decarbonise sectors, while continuing to protect security
of supply as wind generation expands. A low-carbon economy
will rely heavily on renewable energy, which can be promoted
by further decreases in taxes on renewable electricity, as
well as technological breakthroughs allowing large-scale
conversion of electricity into sustainable fuels such as
hydrogen, methane or ammonia.

Progress in reducing transport emissions has been slow to
date, despite more environmentally-friendly vehicles, as the
number of cars has continued to increase as well as the
reliance on road transport (Figure 2). Agriculture is also a
major and growing source of greenhouse gases. Low-hanging
fruit such as rewetting of peatlands and improved manure
management are available to cut emissions with limited impact
on activity, while also reducing other environmental damages.
Denmark needs to work with other EU member states towards
further reform to green the Common Agriculture Policy, as
agriculture is highly exposed to international trade and
emissions could increase elsewhere if Denmark proceeds without
international cooperation.
Figure 2. Increasing car use has pushed up transport emissions
despite greener vehicles

Source: OECD estimation based on EEA; Statistics Denmark; ITF.
The Danish government has made substantial progress to
overcome many of the challenges linked to deep emission cuts.
In the past year and a half, for example, the government has
removed restrictions in district heating to support a move
away from biomass, agreed measures to reduce greenhouse gas
emissions in agriculture, and increased support for green
vehicles and electric charging infrastructure. Further policy
actions are being discussed among various stakeholders,
including more uniform emission pricing. Denmark’s past and
planned efforts to decarbonise quickly and achieve net zero in
2050 are an inspiring example for other countries, as
highlighted in the 2021 OECD Economic Survey of Denmark.

Inflation                with  all  the
trimmings               – using trimmed
means to compare underlying
inflation  in   major  OECD
economies
By   Patrice   Ollivaud   and   Geoff   Barnard,   OECD   Economics
Department

A major challenge for policy makers is understanding whether,
in the absence of a faster tightening of monetary policy,
recent consumer price inflation pressures are likely to
dissipate or to persist and even intensify. Looking at
statistical measures of underlying inflation is one way to
help answer that crucial question.

Headline inflation is the aggregation of price changes for
hundreds of components of household consumption expenditure.
One approach to estimating underlying inflation is to exclude
some subset of price changes so as to come up with a measure
that is less volatile than headline inflation, unbiased
(neither over- nor underestimating headline inflation over the
cycle), and indicative of the trend, so that headline will
tend to adjust towards underlying inflation (Roberts, 2005).

One widely used estimate of underlying inflation is core
inflation, which removes energy and food-related items. This
works well when commodity prices are the main source of
volatility in inflation, but can give a flawed picture if
extreme price movements are coming from other items. Trimmed-
mean inflation is an alternative statistical measure of
underlying inflation pressures which addresses this drawback
by removing the most extreme price changes on both sides of
the distribution each month and then computing mean inflation
from the remaining items. This means that the items excluded
can vary over time. An extreme form of the trimmed-mean
approach is median inflation, which excludes all price
movements other than the median.

There are trade-offs in deciding how much to trim: removing
too few items could leave excessive volatility, while removing
too many could push trimmed-mean inflation away from the
(unobserved) trend in inflation (Dolmas and Koenig, 2019).
Trimmed-mean measures are used widely, but there is no
consensus on the optimal degree of trimming. For example, the
Federal Reserve Bank of Dallas (2021) trims US price changes
extensively and asymmetrically, removing 24% from the lower
tail and 31% from the upper tail, while the European Central
Bank (ECB) has recently used a measure trimming just 7.5% from
each end of the euro area distribution of price changes (ECB,
2021).

The latest OECD Economic Outlook (OECD, 2021, Box 1.4) reports
on an exercise to facilitate comparisons across countries by
constructing, for four major OECD economies, a measure
involving a symmetric 10% trimming. This tracks 36-month
average inflation (a proxy for trend inflation) reasonably
well across a range of countries, although it is not
necessarily the optimal trimming for any of the countries
individually. The results are compared with headline and core
inflation.

Both this trimmed-mean measure and core inflation are less
volatile than headline inflation (Figure 1). When, as is often
the case, food and energy products exhibit the most price
volatility, they behave similarly. At times, however, they are
found to diverge, for example during the first phase of the
pandemic in the United States, when substantial price declines
for a limited number of non-food, non-energy items meant that
core inflation fell along with headline while trimmed-mean
inflation (which excluded these items) barely moved.
Similarly, in Japan all three measures have remained low, but
trimmed-mean inflation has diverged more from core inflation
than elsewhere, reflecting the fact that price declines for a
few components outside of food and energy – above all, mobile
phone charges – have held down core (as well as headline)
inflation.

Figure 1. Indicators of underlying inflation pressures are now
rising

Year-on-year percentage changes

Note: Data are for the personal consumption expenditures
deflator for the United States; consumer price inflation for
Japan; and harmonised consumer price inflation for the euro
area and the United Kingdom. Trimmed-mean inflation trims 10%
in terms of weights at the top and bottom of the distribution
of the year-on-year growth of prices. Core inflation excludes
energy and food-related products.
Source: Bureau of Economic Analysis; Japan Statistics Bureau;
Eurostat; Office for National Statistics; OECD Economic
Outlook 110 database; and OECD calculations.
Trimmed-mean measures suggest that underlying inflation
pressures are now rising in all four economies, but to varying
degrees. Underlying inflation, on the measure shown, has risen
particularly sharply in the United States to around 4% at
present, and in the United Kingdom. In contrast underlying
inflation, although increasing, remains low in Japan and close
to 2% in the euro area (especially taking into account known
one-off factors such as the reversal of the 2020 VAT cut in
Germany).

The trimmed-mean and core inflation measures both point to
stronger inflation pressures, but this does not necessarily
mean that inflation will continue to rise. If, as argued in
the Economic Outlook, a large part of upward price pressures
has reflected supply restrictions associated with the
pandemic, those pressures can be expected to ease when
pandemic-related effects fade. On the other hand, whatever the
uncertainty about the duration of inflationary pressures, the
broadening of price increases, even in Japan and the euro
area, is at least indicating that such pressures are not just
a matter of spikes in a few consumer prices.

References
Dolmas, J. and E. Koenig (2019), “Two Measures of Core
Inflation: A Comparison”, Working Paper, No. 1903, Federal
Reserve Bank of Dallas.

ECB (2021), “Comparing Recent Inflation Developments in the
United States and the euro area”, ECB Economic Bulletin, Issue
6/2021.

Federal Reserve of Dallas (2021), Trimmed Mean PCE Inflation
Rate website.

OECD (2021),OECD Economic Outlook, Volume 2021 Issue 2, OECD
Publishing, Paris.
Roberts, I. (2005) “Underlying Inflation: Concepts,
Measurement and Performance”, Research Discussion Paper, No.5,
Reserve Bank of Australia.

Spurring growth and closing
gaps through digitalisation
in   a  post-COVID   world:
Policies to LIFT all boats
By Mauro Pisu, Christina von Rüden, Hyunjeong Hwang and
Giuseppe Nicoletti, OECD Economics Department

Over the past decades, policy makers across OECD countries
faced the double challenge of a marked slowdown in
productivity growth and a large increase in inequality. This
happened despite the seemingly rapid emergence of digital
technologies, which have the potential to boost productivity
growth and living standards. This new study shows that the
productivity slowdown, rising income dispersion and fast
digitalisation are linked: they can be traced back to
differences across firms and households in access to digital
technologies and the complementary knowledge, embodied in
intangible investments, which is necessary for digital
technology adoption. The study stresses that broad-based
policy support would help to spur growth and narrow the
divides in digitalisation, productivity and incomes.

The key for understanding the link between the productivity
slowdown, rising income dispersion and fast digitalisation is
that intangible assets are costly and difficult to finance,
especially for less productive firms and SMEs. While the high
productive firms can afford and benefit from intangible
assets, the low productivity firms much less so, and therefore
are set to lose ground relative to the best performers.
Ultimately, differences in access to technology and
intangibles translate into both rising productivity
differences across firms and rising cross-firm dispersion in
average wages, which largely depend on the firms’ average
productivity. This in turn not only drags down aggregate
productivity growth but also contributes to overall wage
inequality (Figure 1).

Figure 1. Linking digitalisation, productivity and income gaps

Source: OECD.
Indeed, gaps between firms at the global productivity frontier
and productivity laggards increased dramatically over the past
two decades, especially in intangible-intensive sectors where
complementarities with digital technologies are strong (Figure
2).

Figure 2. Productivity dispersion and its link with wage
dispersion

Evolution of productivity dispersion (difference between
frontier and laggards) grouped by intangible intensity
(2000=100)

Source: Corrado et al. (2021 forthcoming), New Evidence on
Intangibles, Diffusion and Productivity, OECD publishing,
Paris.
Broad-based, equitable and growth-enhancing digital
transformation requires action spanning several policy areas
at once. Policies that help to close productivity gaps across
firms by broadening the digital transformation and raising the
productivity of laggard firms offer a double dividend: they
contribute to sustain aggregate productivity and to close wage
and income gaps.

The COVID-19 pandemic has added new opportunities         for
accelerating productivity-enhancing digitalisation.       For
instance, lockdowns and social distancing requirements have
increased the use of online platforms (OECD, 2020), raising
resilience during the crisis and foreshadowing future
productivity benefits, especially for SMEs and less productive
firms, which benefit most from the use of platforms. It also
caused a surge in telework, with real time surveys suggesting
that the phenomenon is likely to survive the crisis. The added
flexibility that telework allows might also raise productivity
in activities where stronger telework is feasible and
sustainable.

In addition to making use of these opportunities, the paper
proposes a multipronged policy approach to durably accelerate
the diffusion and uptake of digital technologies across all
layers of society, and share their benefits more widely. The
building blocks of the proposed LIFT approach are the
following:

     Lifelong learning for all. Skills are crucial to adopt
     and effectively use digital technologies. Building
     effective and inclusive lifelong learning programmes is
     key to ensuring everybody has the opportunity to acquire
     and upgrade the skills needed to thrive in a digital
     world. Boosting adult learning programmes and on-the-job
     training schemes, and better integrating digital tools
     into school curricula are key steps to this end.
     Intangibles finance. Supporting intangible investments
     requires not only financial market reforms to facilitate
     their funding with private equity and their
     collateralisation for bank credit, but also specific
     policies for the development, upgrade and diffusion of
     managerial and workers’ skills.
     Framework conditions. These should provide firms with
     the right incentives and access to markets, including
     via the updating of competition and regulatory policies
     to the digital age and easy access to digitalised public
     services via e-government and open data.
     Technology access via infrastructure. Policy should
     support the development and access to quality ICT
     infrastructure, as such infrastructure is the basis for
     the take up and effective use of all kinds of digital
technologies. Only a comprehensive, coordinated and well-monitored policy approach at the national level, coupled with initiatives at the international level to establish common principles, share best practices and foster robust cooperation among relevant agencies, can ensure that OECD economies succeed in spurring growth and closing gaps through accelerated and widespread digitalisation in the post-COVID world. References: OECD (2020), “The Role of Digital Platforms in Weathering the COVID-19 Shock, OECD Policy Responses to Coronavirus (COVID-19)”, http://www.oecd.org/coronavirus/policy-responses/the-role-of-o nline-platforms-in-weathering-the-covid-19-shock-2a3b8434/. Pisu, M., et al. (2021), “Spurring growth and closing gaps through digitalisation in a post-COVID world: Policies to LIFT all boats”, OECD Economic Policy Papers, No. 30, OECD Publishing, Paris, https://doi.org/10.1787/b9622a7a-en. Finland’s Zero Homeless Strategy: Lessons from a Success Story By Laurence Boone, Boris Cournède, OECD Economics Department; and Marissa Plouin, OECD Directorate for Employment, Labour and Social Affairs Following a period when homelessness rose in many countries, the onset of the COVID-19 pandemic prompted governments across
the OECD area to provide unprecedented public support –
including to the homeless. In the United Kingdom, for
instance, people who had been living on the streets or in
shelters were housed in individual accommodations in a matter
of days. And in cities and towns across the OECD, public
authorities worked closely with service providers and other
partners to provide support to the homeless that had
previously been considered impossible.

How can countries build on this momentum and ensure more
durable outcomes? The experience of Finland over the past
several decades – during which the country has nearly
eradicated homelessness – provides a glimpse of what can be
possible with a sustained national strategy and enduring
political will.

The number of homeless people in Finland has continuously
decreased over the past three decades from over 16 000 in
1989 to around 4 000, or 0.08% of the population (Figure 1).
This is a very low number, especially considering that Finland
uses a relatively broad definition of homelessness, whereby in
particular it includes people temporarily living with friends
and relatives in its official homelessness count. In 2020,
practically no-one was sleeping rough on a given night in
Finland.

Figure 1. Homelessness has shrunk remarkably in Finland
Source: Report 2021: Homelessness in Finland 2020, The Housing
Finance and Development Centre of Finland (ARA).
This is undoubtedly a remarkable success, even if comparing
homelessness statistics across countries is fraught with
difficulties (OECD, 2020). Many homeless people live
precariously, with the implication that statistical tools such
as household surveys typically fail to accurately
measure their living conditions. Furthermore, countries
define homelessness very differently, for instance counting
people who temporarily live with friends or relatives as
homeless (as Finland does) or excluding them from homelessness
statistics. While there is no OECD-wide average against which
to compare Finland’s homeless rate of 0.08%, other
countries with similarly broad definitions of homelessness
provide points of reference, such as neighbouring

Sweden (0.33%) or the Netherlands (0.23%). 1

Finland’s success is not a matter of luck or the outcome of
“quick fixes.” Rather, it is the result of a sustained, well-
resourced national strategy, driven by a “Housing First”
approach, which provides people experiencing homelessness with
immediate, independent, permanent housing, rather than
temporary accommodation (OECD, 2020). A key pillar of this
effort has been to combine emergency assistance with
the supply of rentals to host previously homeless people,
either by converting some existing shelters into residential
buildings with independent apartments (Kaakinen, 2019) or by
building new flats by a government agency (ARA,
2021). Building flats is key: otherwise, especially if housing
supply is particularly rigid, the funding of rentals can risk
driving up rents (OECD, 2021a), thus reducing the “bang for
the buck” of public spending.

The Finnish experience demonstrates the effectiveness of
tackling   homelessness   through   a   combination   of
financial assistance, integrated and targeted support
services and more supply: using just one of these
levers is unlikely to work. Financial assistance comes from
the social benefits systems, which includes a housing
allowance for low-income people (mostly jobless persons with
no or low unemployment benefits) covering about 80% of housing
costs (Kangas and Kalliomaa-Puha, 2019). Emergency
social assistance funding can complement the housing
allowance if it is insufficient. Social services provide
housing before other interventions that are targeted to
beneficiaries’ needs (such as, to pick one example, providing
health services to help overcome substance abuse). These
efforts require dwellings: investment grants by Finland’s
Housing Finance and Development Centre financed the
construction of 2 200 flats over 2016-19 for long-term
homeless people (ARA, 2021). Indeed, investing in housing
development should be a priority for OECD governments as they
navigate the recovery from the crisis: over the past two
decades, public investment in housing development has dropped
to just 0.06% of GDP across the OECD on average (OECD,
2021b).
Another important driver of Finland’s success is the
integration of efforts to fight homelessness with other parts
of the social safety net. When a housing need is identified in
any part of the social service system, housing is provided
first, to provide a solid basis for employment, long-term
health and/or family assistance (OECD, 2020). This integrated
approach avoids the pitfalls that can arise, for
instance, when benefits are preconditioned on having an
address, or when obtaining a flat requires a minimum income.
There are indications that, by facilitating the integration of
previously homeless people in society, the upfront Finnish
investment that provides people with housing first, pays off
by reducing subsequent costs incurred by social
services. Evaluations point to annual savings in public
expenditure in the range of EUR 9 600-15 000 per
person who had previously experienced homelessness        (Y-
Foundation, 2017; Ministry of the Environment, 2011).

Overall, Finland’s achievements illustrate the benefits of
integration,    balance   and  continuity    in  policies
to tackle homelessness: integration across housing and social
assistance programmes, balance between demand and supply,
and political continuity over time have helped to maximise the
results of the country’s investment to end homelessness. Not
only has this approach resulted in a steady decline in
homelessness, but it has also made the system more resilient
to shocks, including the COVID-19 crisis. Indeed, the pandemic
was less of a strain to Finland’s homeless support
system compared to other countries, given that many vulnerable
people were already housed and supported in individual flats
(Fondation Abbé Pierre – FEANTSA, 2021).

These lessons can be transposed to other OECD countries as
they look to build on the momentum and lessons learned from
the COVID crisis.

References
ARA (2021), Report 2021: Homelessness in Finland 2020, The
Housing Finance and Development Centre of Finland
(ARA). Fondation Abbé Pierre – FEANTSA (2021), Sixth Overview
of Housing Exclusion in Europe, FEANTSA – Abbé Pierre.

Kaakinen, J. (2019), “Time to act: Let’s end homelessness for
good,” OECD Forum Network Series on the New Societal
Contract.

Kangas, O. and L. Kalliomaa-Puha(2019), “ESPN Thematic Report
on National Strategies to Fight Homelessness and Housing
Exclusion: Finland”, European Social Policy Network (ESPN),
European Commission, Brussels.

Ministry of the Environment (2011), Asunnottomuuden
vähentämisen taloudelliset [Economic effects of reducing
homelessness], Ympäristöministeriön.

OECD (2020), “Better data and policies to fight homelessness
in the OECD”, Policy Brief on Affordable Housing, OECD,
Paris, http://oe.cd/homelessness-2020.

OECD (2021a), Brick by     Brick:   Building   Better   Housing
Policies, OECD, Paris.

OECD (2021b), OECD Affordable Housing Database, indicator
PH1.1, OECD, Paris.

Pleace, N. et al. (2021), European Homelessness and COVID 19,
European Observatory on Homelessness.

Portugal: Policy action for a
strong                and           sustainable
recovery
By Caroline Klein, OECD Economics Department

Like most countries around the world, the COVID-19 pandemic
hit Portugal severely, taking a heavy toll on the
economy. GDP declined by 8.4% in 2020 compared to 4.7% on
average in the OECD. With the lifting of restrictions,
activity has rebounded strongly and the latest OECD
forecasts project GDP will reach its pre-crisis level in
2022 (Figure 1). Policy support and the impressive success of
the vaccination campaign, with Portugal having the highest
vaccination rate in the OECD end-2021, has been decisive for
the recovery.

Figure 1. The pandemic severely hit the economy

Gross Domestic Product, Index 2015Q1 = 100

Note: Peers refer to the weighted average of Greece, Italy and
Spain.
Source: OECD Economic Outlook: Statistics and Projections
(database) and updates.
At the same time, Portugal is still facing important
challenges. The economic outlook remains fraught with
uncertainties, such as the emergence of new virus variants, or
the rise in inflation reflecting higher energy prices and
supply bottlenecks. Productivity was only three-quarters of
the OECD average in 2019, and productivity gains were 20%
below the OECD average over the past ten years,
limiting improvement in living standards. The crisis has
accelerated the already rapid pace of the digital and green
transitions. Portugal is no doubt ready to embrace these
transformations, but more is needed to do so successfully.

The 2021 OECD Economic Survey of Portugal presents key
actions on how to sustain the recovery and lift Portugal’
economic potential in these uncertain times.

Firstly, agile fiscal and financial policies are necessary
to address persistent macroeconomic vulnerabilities. Portugal
entered this crisis in a much better shape than before the
Global Financial Crisis, but macroeconomic imbalances
remained large. Portugal’s fiscal space should be restored
by reducing the public debt ratio, which is among the highest
in the OECD. A credible fiscal consolidation strategy –
including the containment of age-related costs – should be
implemented once the recovery is firmly established. Rapid and
effective absorption of EU funds will help. Portugal will
receive    a    total   of    EUR   61    billion    over
2021-2027, supporting public investment from current low level
(Figure 2).

Figure 2. Public investment has been low

Public investment, Per cent of GDP, 2020 or latest available
Source: OECD (2021), OECD Economic Outlook: Statistics and
Projections (database).
Secondly, policies should ensure that the recovery is more
sustainable and benefit all. Youth, women and people with low
skills were hardest hit by the pandemic. Almost one
fourth of the active 15-24 year olds were looking for a job
in September, twice the OECD average. Public employment
services need to be reinforced to better adapt to the changing
needs of the labour market, provide individualised support and
expand training programmes. Portugal is at the forefront of
many environmental policies, as reflected by its high share or
of renewable energy, for example. However, more efforts are
needed to reduce water abstraction and become a carbon-neutral
economy by 2050. Policy action must combine investments with
incentives to reduce environmental damages and compensation
measures for low-income households.

Thirdly, Portugal could get more from the digital
transition. Portugal can build on its impressive development
of digital government and its start-up ecosystem to help spur
the digital transition more widely, as the least educated
segments of the population and smaller firms lag behind in the
adoption of digital technologies. Equipping the population and
firms with adequate skills is a prerequisite for
digitalisation. The government plans to further increase
resources for schools and teachers, including regular in-
service training on ICT use, are welcome and should be
accelerated. Participation in adult education is low
(Figure 3) and needs to expand. Introducing a personal
training account for adults, with more generous vouchers for
low-skilled workers should be considered. Finally, raising
competition in the telecommunication sector by facilitating
consumer mobility can increase the quality and the
affordability of broadband services throughout the country.

Figure 3. Few adults participate in training

Participation in education and training, Last 4 weeks, % of
25-64 year-olds, 2019

Source: OECD (2020) Education at a Glance Database; Eurostat
(2020).
Further reading

OECD (2021), OECD Economic Outlook, Volume 2021 Issue 2:
Preliminary       version,        OECD      Publishing,
Paris, https://doi.org/10.1787/66c5ac2c-en.

OECD (2021) OECD Economic Surveys: Portugal 2021, OECD
Publishing, Paris, https://doi.org/10.1787/13b842d6-en.
The role of firms in wage
inequality: Policy lessons
from a large-scale cross-
country study
By Chiara Criscuolo, Nathalie Scholl, Cyrille Schwellnus, OECD
Directorate for Science, Technology and Innovation; Antton
Haramboure, Alexander Hijzen, OECD Directorate for Employment,
Labour and Social Affairs; and Michael Koelle, OECD Economics
Department.

This post provides an overview of the new report The Role of
Firms in Wage Inequality: Policy Lessons from a Large Scale
Cross-Country Study launched on 9 December.

Policy makers in many OECD countries have been grappling for
some time with a number of potentially inter-related trends:
low productivity growth, widening gaps in business
performance, increasing market concentration and rising income
inequality (OECD, 2015; Andrews, Criscuolo and Gal, 2016;
Berlingieri, G., P. Blanchenay and C. Criscuolo, 2017).
However, little is known about the implications of widening
gaps in business performance and increasing market
concentration for wage inequality, including wage gaps between
men and women.

Filling this knowledge gap is the aim of a new OECD report The
Role of Firms in Wage Inequality: Policy Lessons from a Large
Scale Cross-Country Study, OECD, 2021. As the pandemic has
boosted the digitalisation of business models in a way that
may favour large tech-savvy firms, this is a critical issue
for policy makers seeking to support an inclusive recovery.

Firm pay policies account for around one-third of overall wage
inequality

Wages are not only determined by workers’ skills but also by
the productivity and pay policies of the firms they work for.
The new report finds that average pay differentials across
firms account for a sizeable part of overall wage inequality
and that this predominantly reflects between-firm differences
in pay for workers with similar levels of skills rather than
differences in the composition of workers (Figure 1).
Differences in wage premia across firms, i.e. pay differences
after taking account of differences in workforce composition,
account for around one-third of overall wage inequality.

Figure 1. Firm wage premia account for about one third of
overall wage inequality

Contributions to overall wage dispersion, latest available
year
You can also read