Strain-Resolved Dynamics of the Lung Microbiome in Patients with Cystic Fibrosis
←
→
Page content transcription
If your browser does not render page correctly, please read the page content below
Zurich Open Repository and
                                                                          Archive
                                                                          University of Zurich
                                                                          Main Library
                                                                          Strickhofstrasse 39
                                                                          CH-8057 Zurich
                                                                          www.zora.uzh.ch

 Year: 2021

 Strain-Resolved Dynamics of the Lung Microbiome in Patients with Cystic
                                 Fibrosis

 Dmitrijeva, Marija ; Kahlert, Christian R ; Feigelman, Rounak ; Kleiner, Rebekka L ; Nolte, Oliver ;
                      Albrich, Werner C ; Baty, Florent ; von Mering, Christian

Abstract: In cystic fibrosis, dynamic and complex communities of microbial pathogens and commensals
can colonize the lung. Cultured isolates from lung sputum reveal high inter- and intraindividual vari-
ability in pathogen strains, sequence variants, and phenotypes; disease progression likely depends on the
precise combination of infecting lineages. Routine clinical protocols, however, provide a limited overview
of the colonizer populations. Therefore, a more comprehensive and precise identification and charac-
terization of infecting lineages could assist in making corresponding decisions on treatment. Here, we
describe longitudinal tracking for four cystic fibrosis patients who exhibited extreme clinical phenotypes
and, thus, were selected from a pilot cohort of 11 patients with repeated sampling for more than a year.
Following metagenomics sequencing of lung sputum, we find that the taxonomic identity of individual
colonizer lineages can be easily established. Crucially, even superficially clonal pathogens can be subdi-
vided into multiple sublineages at the sequence level. By tracking individual allelic differences over time,
an assembly-free clustering approach allows us to reconstruct multiple lineage-specific genomes with clear
structural differences. Our study showcases a culture-independent shotgun metagenomics approach for
longitudinal tracking of sublineage pathogen dynamics, opening up the possibility of using such methods
to assist in monitoring disease progression through providing high-resolution routine characterization of
the cystic fibrosis lung microbiome. IMPORTANCE Cystic fibrosis patients frequently suffer from recur-
ring respiratory infections caused by colonizing pathogenic and commensal bacteria. Although modern
therapies can sometimes alleviate respiratory symptoms by ameliorating residual function of the protein
responsible for the disorder, management of chronic respiratory infections remains an issue. Here, we
propose a minimally invasive and culture-independent method to monitor microbial lung content in pa-
tients with cystic fibrosis at minimal additional effort on the patient’s part. Through repeated sampling
and metagenomics sequencing of our selected cystic fibrosis patients, we successfully classify infecting
bacterial lineages and deconvolute multiple lineage variants of the same species within a given patient.
This study explores the application of modern computational methods for deconvoluting lineages in the
cystic fibrosis lung microbiome, an environment known to be inhabited by a heterogeneous pathogen
population that complicates management of the disorder.

DOI: https://doi.org/10.1128/mBio.02863-20

Posted at the Zurich Open Repository and Archive, University of Zurich
ZORA URL: https://doi.org/10.5167/uzh-203166
Journal Article
Published Version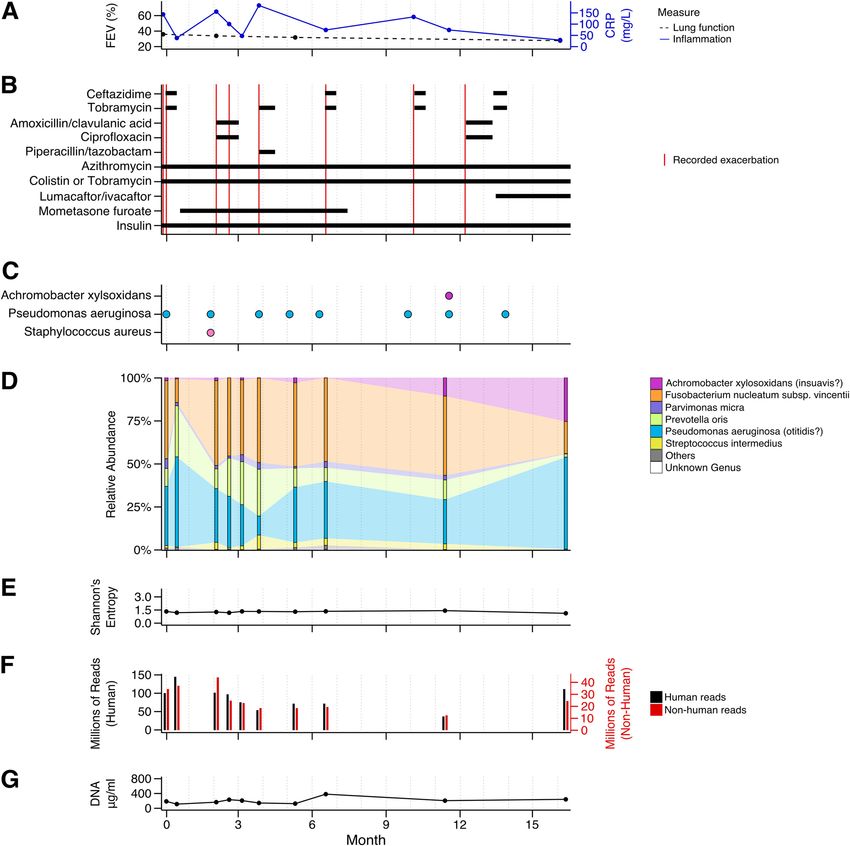
The following work is licensed under a Creative Commons: Attribution 4.0 International (CC BY 4.0)
License.

Originally published at:
Dmitrijeva, Marija; Kahlert, Christian R; Feigelman, Rounak; Kleiner, Rebekka L; Nolte, Oliver; Al-
brich, Werner C; Baty, Florent; von Mering, Christian (2021). Strain-Resolved Dynamics of the Lung
Microbiome in Patients with Cystic Fibrosis. mBio, 12(2):Epub ahead of print.
DOI: https://doi.org/10.1128/mBio.02863-20

                                                2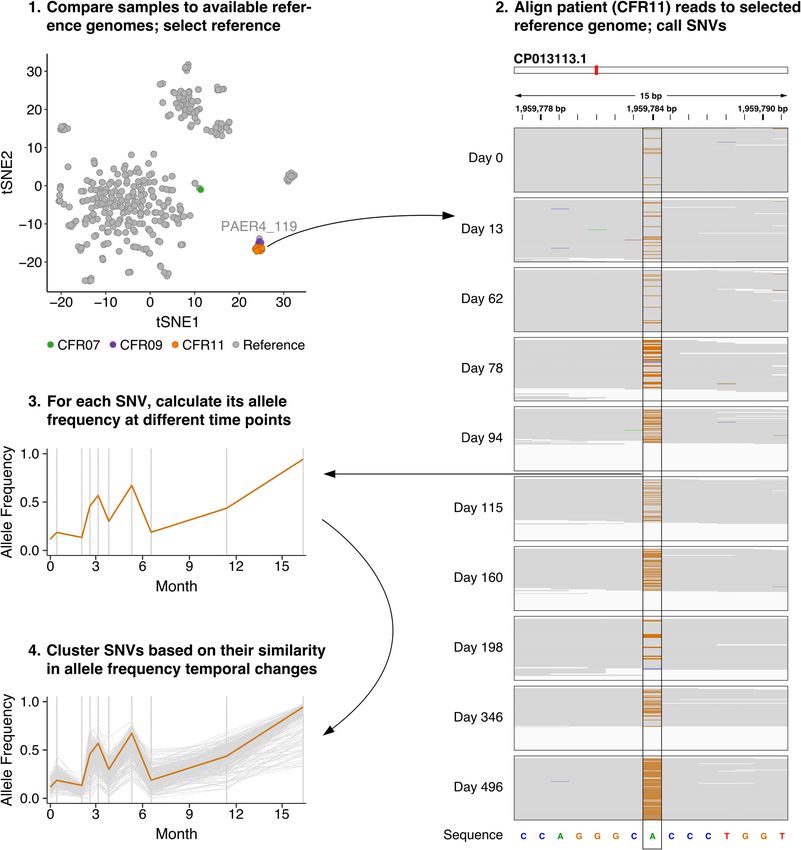
RESEARCH ARTICLE

Strain-Resolved Dynamics of the Lung Microbiome in Patients
with Cystic Fibrosis
Marija Dmitrijeva,a,b Christian R. Kahlert,c,d Rounak Feigelman,a,b* Rebekka L. Kleiner,e* Oliver Nolte,f Werner C. Albrich,d
Florent Baty,e Christian von Meringa,b

                                                                                                                                                                           Downloaded from http://mbio.asm.org/ on May 11, 2021 by guest
a   Department of Molecular Life Sciences, University of Zurich, Zurich, Switzerland
b   Swiss Institute of Bioinformatics, Zurich, Switzerland
c   Infectious Diseases and Hospital Epidemiology, Children’s Hospital of Eastern Switzerland, St. Gallen, Switzerland
d   Infectious Diseases and Hospital Epidemiology, Cantonal Hospital St. Gallen, St. Gallen, Switzerland
e   Pneumology and Sleep Medicine, Cantonal Hospital St. Gallen, St. Gallen, Switzerland
Human Microbiology, Centre for Laboratory Medicine, St. Gallen, Switzerland
f

ABSTRACT In cystic fibrosis, dynamic and complex communities of microbial patho-
gens and commensals can colonize the lung. Cultured isolates from lung sputum
reveal high inter- and intraindividual variability in pathogen strains, sequence var-
iants, and phenotypes; disease progression likely depends on the precise combina-
tion of infecting lineages. Routine clinical protocols, however, provide a limited over-
view of the colonizer populations. Therefore, a more comprehensive and precise
identification and characterization of infecting lineages could assist in making corre-
sponding decisions on treatment. Here, we describe longitudinal tracking for four
cystic fibrosis patients who exhibited extreme clinical phenotypes and, thus, were
selected from a pilot cohort of 11 patients with repeated sampling for more than a
year. Following metagenomics sequencing of lung sputum, we find that the taxo-
nomic identity of individual colonizer lineages can be easily established. Crucially,
even superficially clonal pathogens can be subdivided into multiple sublineages at
the sequence level. By tracking individual allelic differences over time, an assembly-
free clustering approach allows us to reconstruct multiple lineage-specific genomes
with clear structural differences. Our study showcases a culture-independent shotgun
metagenomics approach for longitudinal tracking of sublineage pathogen dynamics,
opening up the possibility of using such methods to assist in monitoring disease
progression through providing high-resolution routine characterization of the cystic
fibrosis lung microbiome.                                                                                                 Citation Dmitrijeva M, Kahlert CR, Feigelman R,
                                                                                                                         Kleiner RL, Nolte O, Albrich WC, Baty F, von
IMPORTANCE Cystic fibrosis patients frequently suffer from recurring respiratory infec-                                   Mering C. 2021. Strain-resolved dynamics of
tions caused by colonizing pathogenic and commensal bacteria. Although modern                                            the lung microbiome in patients with cystic
                                                                                                                         fibrosis. mBio 12:e02863-20. https://doi.org/10
therapies can sometimes alleviate respiratory symptoms by ameliorating residual                                          .1128/mBio.02863-20.
function of the protein responsible for the disorder, management of chronic respira-                                     Editor David S. Guttman, University of Toronto
tory infections remains an issue. Here, we propose a minimally invasive and culture-                                     Copyright © 2021 Dmitrijeva et al. This is an
independent method to monitor microbial lung content in patients with cystic fibro-                                       open-access article distributed under the terms
                                                                                                                         of the Creative Commons Attribution 4.0
sis at minimal additional effort on the patient’s part. Through repeated sampling                                        International license.
and metagenomics sequencing of our selected cystic fibrosis patients, we success-                                         Address correspondence to Christian von
fully classify infecting bacterial lineages and deconvolute multiple lineage variants of                                 Mering, mering@imls.uzh.ch.
the same species within a given patient. This study explores the application of mod-                                     * Present address: Rounak Feigelman, Paragon
                                                                                                                         Genomics, Hayward, California, USA; Rebekka L.
ern computational methods for deconvoluting lineages in the cystic fibrosis lung                                          Kleiner, Department of Internal Medicine,
microbiome, an environment known to be inhabited by a heterogeneous pathogen                                             Herisau Hospital, Herisau, Switzerland.
population that complicates management of the disorder.                                                                  Received 9 October 2020
                                                                                                                         Accepted 30 January 2021
KEYWORDS cystic fibrosis, longitudinal study, lung sputum, metagenomics, strain                                           Published 9 March 2021
typing
                                                                                                                                                      ®
March/April 2021 Volume 12 Issue 2 e02863-20                                                                                                              mbio.asm.org 1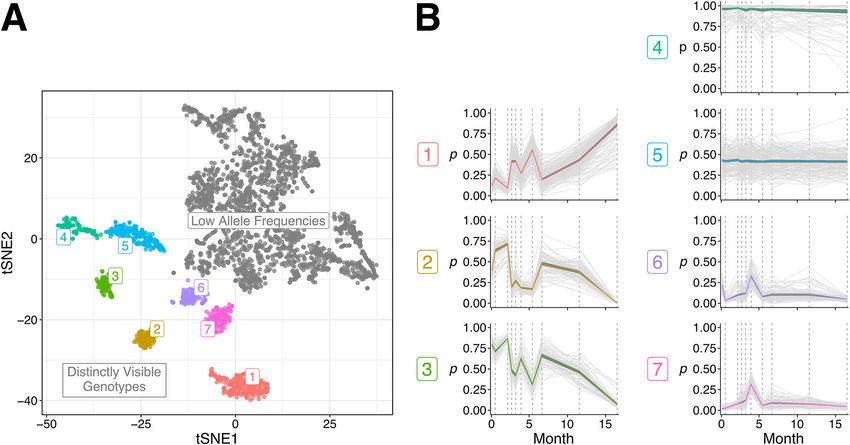
®
Dmitrijeva et al.

     ystic fibrosis (CF) is a monogenic, autosomal recessive, and life-shortening disease
C    that predominantly affects the Caucasian population (1). The disease involves mul-
tiple organ systems but has its most severe consequences in the airways, where it leads
to decreased mucociliary clearance followed by mucus plugging. Subsequently, the
mucosal airways of CF patients are chronically inflamed and colonized by allochtho-
nous microorganisms. The resulting respiratory symptoms include difficulty breathing,
persistent cough, expectoration of sputum, and recurrent pulmonary infections.
Respiratory failure accounts for more than half of CF patient deaths (2, 3). Nevertheless,
improvements in CF management, such as antibiotic therapy and administration of mu-
colytic drugs, have increased the median life expectancy for patients, turning CF into a
predominantly adult disorder (4). More recent therapies aim to directly ameliorate resid-
ual function of the protein encoded by the CFTR gene locus and have been shown to

                                                                                                                Downloaded from http://mbio.asm.org/ on May 11, 2021 by guest
slow the rate of lung function decline in a subset of CF patients (5). Chronic respiratory
infections, however, seem to persist even though respiratory symptoms improve (6).
Therefore, improved characterization of persistent respiratory pathogens is needed to
develop tailored therapies that control their composition and abundance.
    Several common pathogens colonizing the lungs of CF patients are known.
Pseudomonas aeruginosa is predominant in the adult CF population (2, 3). However,
aggressive antimicrobial therapies aimed at reverting initial colonization by P. aeru-
ginosa (7, 8) have recently led to a decline in its prevalence (2). Another key patho-
gen in CF is Staphylococcus aureus, which accounts for the majority of infections in
young patients and has become increasingly more prevalent among all CF patients
(2, 3). Other pathogens recognized in CF include members of the Burkholderia cepacia
complex, mycobacteria such as Mycobacterium avium and Mycobacterium abscessus,
Stenotrophomonas maltophilia, and members of the Achromobacter genus (2, 3, 9).
Although the latter pathogens are present in a small fraction of CF patients, they are of-
ten multidrug resistant and, thus, challenging with regard to the treatment options in
the clinic. Finally, anaerobic bacteria such as members of the Prevotella genus have also
been identified in CF patient sputum using specialized culture techniques (10), but these
typically are not assessed during routine clinical diagnosis, and their role as pathogens in
CF patients has yet to be defined.
    Culture-independent approaches are increasingly complementing and expanding
on the findings of traditional microbiology approaches. For instance, studies using
sequencing to characterize the lung microbiome have noted the presence of anaerobic
bacteria not recognized as typical CF pathogens, such as Prevotella and Veillonella, in a
sizable portion of the patients (11–13). In addition, culture-independent approaches
uncovered a high level of variability across the lung microbiomes of CF patients
(13–18). In late-stage patients, however, the microbiome generally tends to be lower in
diversity and becomes dominated by one or a few of the commonly recognized CF
pathogens (13, 14, 17). Several efforts have compared patient-matched samples from
different clinical states but have not found significant reproducible changes between
samples taken at baseline and at exacerbation, which suggests that the CF lung micro-
biome is resilient over time (11, 12, 14–16). Most culture-independent studies of the
lung microbiome in CF, however, have been performed using 16S rRNA sequencing
and, thus, provide only limited insights into the functions or strain identities of lung
microbial communities.
    Whole-genome sequencing (WGS) and metagenome sequencing improve on the
limited taxonomic and functional resolution of 16S rRNA sequencing. Metagenomics
allows us to survey bacterial, viral, and fungal populations at once, giving a more com-
plete picture of microbial relative abundances in the CF lung microbiome (17, 19).
Consequently, a larger portion of microbiome inhabitants can be classified at the spe-
cies level (17), and prominent CF pathogens have been classified at the strain level (17,
18, 20). Moreover, multiple subpopulations of specific pathogens have been detected
in CF through metagenome sequencing (17, 18). However, so far only single reference

March/April 2021 Volume 12 Issue 2 e02863-20                                                   mbio.asm.org 2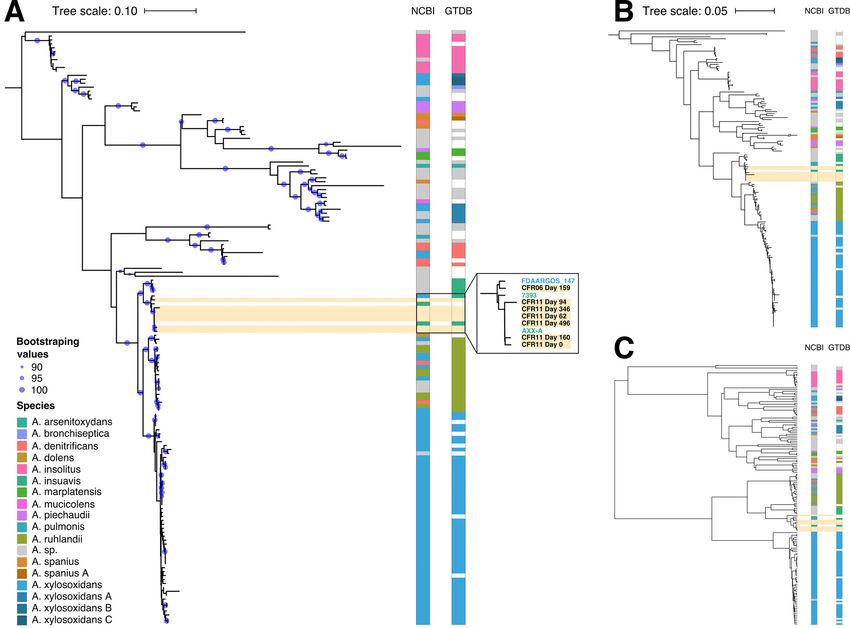
®
Strain-Resolved Microbiome Dynamics in Cystic Fibrosis

points per patient were typically sequenced, limiting haplotype deconvolution and
preventing insights into the temporal dynamics of these lineages.
    Here, we describe longitudinal sputum sampling in CF patients over the course of one
and a half years, conducting metagenomics sequencing of spontaneously expectorated
sputum at multiple time points. The aim of the study was to investigate the advantages
of collecting longitudinal data of CF patients for monitoring and characterizing lineage
successions in situ. We successfully classified most of the lung microbiome members at
the species and genus level and confirmed the presence of pathogens identified during
routine clinical diagnosis. Importantly, we show how longitudinal metagenomics data
can be used to deconvolute distinct lineage variants of the same species within a given
patient. We introduce an assembly-free approach that can delineate nearly complete, lin-
eage-specific genomes even when their sequence divergence is fairly low. Our study
introduces culture-independent methods that can be used in the future for monitoring

                                                                                                                 Downloaded from http://mbio.asm.org/ on May 11, 2021 by guest
pathogen lineages in CF.

RESULTS
    Patient-specific lung microbiomes. We monitored four CF patients selected from
a larger cohort over the course of 19 months (Fig. 1; see also Fig. S1, S2, and S3 in the
supplemental material). A summary of patient information, clinical parameters, and
prescribed medication is available in Data Set S1 at https://string-db.org/suppl/Dataset
_S1_Strain-resolved_Microbiome_Dynamics_in_Cystic_Fibrosis.xlsx. During the course
of our study, the patients produced sputum spontaneously, either during routine clini-
cal check-ups or during exacerbations. In total, 25 samples were collected. We
extracted total DNA from the collected sputum, enriched for nonmethylated DNA, and
sequenced it using the Illumina HiSeq 4000 platform. Sequencing depth varied
between 21 million reads and 179 million reads (Fig. 1F and Fig. S1F, S2F, and S3F).
Human DNA constituted between 70% and 93% of all reads. We observed no signifi-
cant associations between the total DNA concentration in the sample and the
sequencing depth or the fraction of nonhuman reads. Nonhuman DNA predominantly
originated from bacteria; viruses (including bacteriophages) accounted for, at most,
1.5% of reads, and fungi accounted for, at most, 0.15% of the reads (as profiled by
MiCoP) (21). More than 95% percent of the bacteria at each time point could be identi-
fied to at least the genus level using the mOTUs software (22) (Fig. 1D and Fig. S1D,
S2D, S3D, and Data Set S1 at the URL mentioned above, mOTUs), indicating that the
lung microbiomes of these patients largely consisted of previously characterized bacte-
rial clades.
    Lung microbiome compositions showed marked differences between the four
patients (Fig. S4). For instance, the lung microbiome profile of patient CFR06 contained
between 60% and 93% of anaerobic bacteria, including the oral anaerobes Prevotella,
Parvimonas, and Fusobacterium, and was the only patient devoid of any detectable
Pseudomonas (Fig. S1D). Typical CF pathogens identified by the clinical microbiology labo-
ratory, A. xylosoxidans, H. influenzae, and S. aureus (Fig. S1C), and their corresponding gen-
era accounted for less than a fourth of the bacterial content (Fig. S1D). This patient was
several years younger than the other subjects and displayed a milder form of CF, with the
highest average forced expiratory volume (FEV), a measure of lung function (95% confi-
dence interval [CI], 56.8% 6 6.4% versus 30.7% 6 0.7% in CFR07, 40.0% 6 3.1% in CFR09,
32.5% 6 3.3% in CFR11) (Fig. S1A). Around 7 months into the study, the patient had an
exacerbation that was treated with a combination of piperacillin-tazobactam and intrave-
nous tobramycin (Fig. S1B). Following this event, the lung microbiome composition of
CFR06 experienced a major shift: Prevotella buccae, S. aureus, and A. xylosoxidans/insuavis
all decreased in relative abundance. Concomitantly, Prevotella oris, Fusobacterium nuclea-
tum, and Gemella morbillorum increased in relative abundance (Fig. S1D).
    In contrast, the lungs of patients CFR07 and CFR09 were colonized predominantly by
P. aeruginosa (Fig. S2C and D and S3C and D), with samples from these patients cluster-
ing together (Fig. S4). Patient CFR07 displayed a stable clinical phenotype, with no

March/April 2021 Volume 12 Issue 2 e02863-20                                                    mbio.asm.org 3
®
Dmitrijeva et al.
Downloaded from http://mbio.asm.org/ on May 11, 2021 by guest
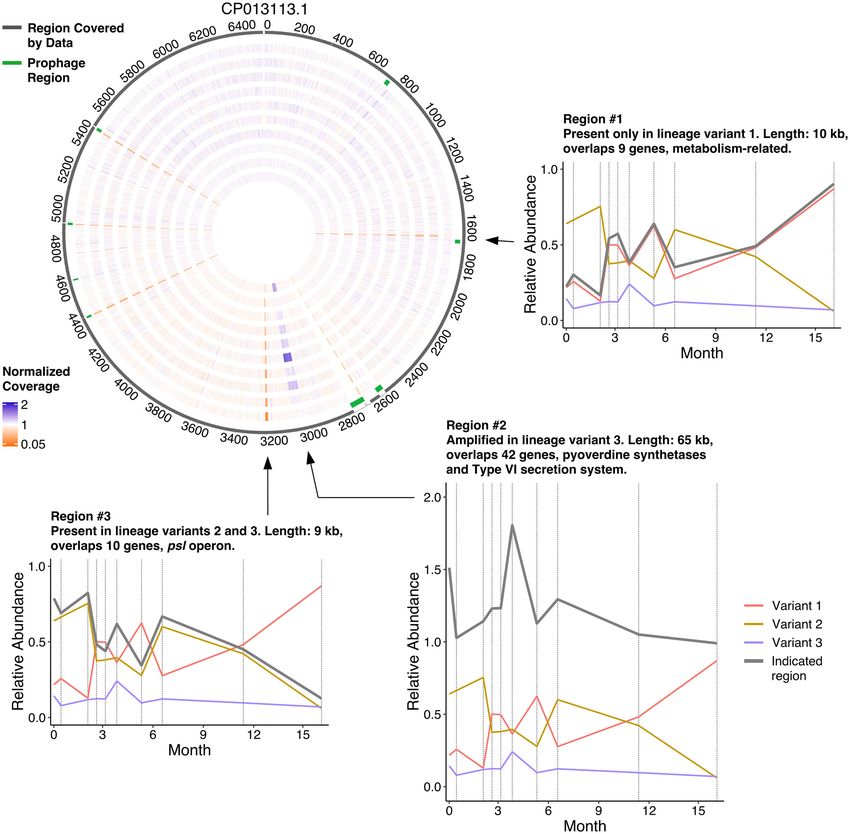
FIG 1 Study report of patient CFR11 displaying the dynamics of multiple parameters over time. (A) Percent forced expiratory volume (FEV) (black) and
concentration of C-reactive protein (CRP) (blue), with actual measurements shown as dots. (B) Medication assigned to the patient during the course of the
study and recorded exacerbation events (in red). (C) Bacteria identified in the clinical microbiology laboratory. (D) Relative abundance profiles generated by
mOTUs, with actual measurements shown as bars. Selected species and their corresponding genera with more than 5% relative abundance at at least one
time point are shown color-coded. Less abundant species are grouped into “Others” (gray). Taxa that could not be identified by mOTUs on the genus level
are grouped into “Unknown Genus” (white). (E) Shannon’s diversity index (entropy) calculated based on the relative abundance profiles generated by
mOTUs, with actual measurements shown as dots. (F) Number of reads per sample. Human reads are indicated in black and plotted on the left axis. Reads
that did not concordantly map to the human genome are depicted in red and plotted on the right axis. (G) Concentration of total DNA isolated from
patient sputum, with actual measurements shown as dots.
exacerbations recorded during the course of the study, and retained FEV at 30%
(Fig. S2A and B). P. aeruginosa accounted for more than 90% of all bacteria in this
patient’s lung microbiome, resulting in the lowest microbiome diversity of all examined
patients (average Shannon’s diversity index with 95% CI, 0.48 6 0.09 versus 2.29 6 0.44
in CFR06, 1.79 6 0.93 in CFR09, and 1.29 6 0.06 in CFR11) (Fig. S2E). The lung
March/April 2021 Volume 12 Issue 2 e02863-20 mbio.asm.org 4®
Strain-Resolved Microbiome Dynamics in Cystic Fibrosis
microbiome of patient CFR09 contained, in addition to P. aeruginosa, up to 17.5% and
9.2% of the genera Prevotella and Veillonella, respectively, and various low-abundance
genera that comprised up to 35% of the lung microbiome (Fig. S3D).
Finally, patient CFR11 presented the most severe course of disease (Fig. 1) and
died shortly after study completion. The patient experienced multiple exacerbations,
accompanied by high levels of inflammation, with FEV gradually declining from 36%
to 28% (Fig. 1A and B). The lung microbiome of CFR11 was dominated by P. aerugi-
nosa (Fig. 1C and D) and the oral anaerobes P. oris and F. nucleatum (Fig. 1D). In addi-
tion, Parvimonas micra, Streptococcus intermedius, and A. xylosoxidans/insuavis were
present in lower relative abundances, with the fraction of Achromobacter increasing
at later time points (Fig. 1D), to the point of also being detected using standard clini-
cal microbiology procedures (Fig. 1C). Thus, in three of the patients, the most abun-
dant bacteria remained the same throughout the course of the study, and only
Downloaded from http://mbio.asm.org/ on May 11, 2021 by guest
CFR06 displayed a major sustained shift in lung microbiome composition (Fig. S4).
From all identified bacteria, the most relevant from a clinical perspective were A. xylo-
soxidans (identified in two patients, CFR06 and CFR11) and P. aeruginosa (identified
in three patients, CFR07, CFR09, and CFR11). Therefore, we set out to assess to what
extent cultivation-independent sequencing would allow us to classify these patho-
gens in more detail.
Strain-level classification of Achromobacter. Seven of the sputum samples con-
tained sufficient reads to provide a 2-fold median coverage of the A. xylosoxidans pan-
genome (one sample from CFR06 and six samples from CFR11), and the corresponding
assembled contigs showed more than 80% expected genome completeness according
to CheckM (23) (Data Set S1 at https://string-db.org/suppl/Dataset_S1_Strain-resolved
_Microbiome_Dynamics_in_Cystic_Fibrosis.xlsx, assembly reports). From a selection of
22 fully sequenced A. xylosoxidans reference genomes, A. xylosoxidans FDAARGOS_147, a
strain isolated from a patient at Children’s National Hospital in Washington, DC, was the
only genome with more than 50% gene family overlap with the Achromobacter contigs
from the patients (Fig. S5A and B). Therefore, we decided to compare marker gene
sequence identity to place our samples within the Achromobacter genus.
From 144 Achromobacter genomes in the NCBI genome database (November 2018)
(24), Achromobacter genus trees were constructed using the sequences from the 10
single-copy genes used by mOTUs, sequences from the seven genes used in standard
Achromobacter MLST (25), or pairwise genome average nucleotide identities (see
Materials and Methods). The three genus trees were more consistent with each other
(average normalized Robinson-Foulds distance, 0.62) than to a phylogenetic tree
informed by a single marker gene, such as 16S rRNA (average normalized Robinson-
Foulds distance, 0.90). All three trees revealed some discrepancies with the NCBI taxon-
omy (Fig. 2, NCBI columns). Out of the eight clades containing more than one genome,
only A. marplatensis and A. insolitus were monophyletic in all three trees. Conversely,
our analyses clustered together genomes assigned to different species with more than
90% bootstrap support. For example, one well-supported cluster contained genomes
from A. ruhlandii, A. denitrificans, and A. xylosoxidans (Fig. 2A). As has been noted previ-
ously, taxonomic classification within the Achromobacter genus has inconsistencies
(26). The Genome Taxonomy Database (GTDB) is a recent effort to redefine prokaryotic
taxonomy and improve on such inconsistencies in species assignment (27). To deter-
mine whether this approach could be of help here, we downloaded the species assign-
ments from GTDB (as of April 2019). Indeed, seven of the nine multigenome
Achromobacter clades defined by GTDB were monophyletic in all three trees, and all
nine clades were monophyletic in the mOTU tree (Fig. 2, GTDB columns).
On all three Achromobacter genus trees, we observed that our patient-derived
Achromobacter genomes and A. xylosoxidans FDAARGOS_147 clustered with two A.
insuavis genomes. The lineage in patient CFR11 was 99.99% identical to A. insuavis
AXX-A, a strain observed at the Laboratory of Bacteriology at the Faculty of
Medicine in Dijon, France (Fig. 2A, zoom-in). The lineage in patient CFR06 clustered
March/April 2021 Volume 12 Issue 2 e02863-20 mbio.asm.org 5®
Dmitrijeva et al.
Downloaded from http://mbio.asm.org/ on May 11, 2021 by guest
FIG 2 Strain-typing of patient-specific Achromobacter in the context of a sequence-based phylogeny of the genus. (A) Maximum-likelihood tree based on
sequences of 10 single-copy genes used by mOTUs. Colors on the right of the tree depict species assignments according to NCBI and GTDB taxonomies
and apply to panels B and C as well. Blue circles indicate branch confidence values ($90) based on 100 bootstraps of the tree. (B) Maximum-likelihood tree
based on sequences of seven housekeeping genes from the Achromobacter MLST database. (C) UPGMA clustering of pairwise average nucleotide identities
of the comprising Achromobacter genomes.
with A. xylosoxidans FDAARGOS_147 and was 99.24% identical to it (Fig. 2A, zoom-
in). Taken together, these results indicated that the clinical laboratory misidentified
this pathogen, incorrectly reporting A. xylosoxidans instead of A. insuavis.
Strain-level classification of P. aeruginosa. Next, we asked how well strain iden-
tification performs in the case of P. aeruginosa, a species for which more compre-
hensive reference information is available. Patients CFR07, CFR09, and CFR11 all car-
ried Pseudomonas in sufficient amounts to allow 99% estimated genome coverage (Data
Set S1 at https://string-db.org/suppl/Dataset_S1_Strain-resolved_Microbiome_Dynamics
_in_Cystic_Fibrosis.xlsx, assembly reports). To identify the lineages, we compared our
samples to a representative set of 359 P. aeruginosa genomes based on gene family
presence/absence profiles (28) (Fig. S5C) and marker gene sequence identity (Fig. S5D).
Patients CFR09 and CFR11 harbored a lineage with single-copy gene sequences 100%
identical to those of P. aeruginosa PAER4_119 (first sampled in Poland), although some
differences in gene family content were present (Fig. S5C and D). The samples from
CFR07, however, contained gene families distinct from those of the other patients and
clustered with other reference genomes (Fig. S5C). Indeed, the tree based on marker
genes revealed that CFR07 is infected by a new lineage that was, at most, 99.73% identi-
cal to the genomes in the representative set (Fig. S5D).
Our work with Pseudomonas indicated that more than one variant of the lineage
March/April 2021 Volume 12 Issue 2 e02863-20 mbio.asm.org 6®
Strain-Resolved Microbiome Dynamics in Cystic Fibrosis
was likely present in some of the patient samples, most notably in CFR11. Both
PanPhlAn and CheckM presented corresponding warnings but could not further delin-
eate these lineage variants.
Delineation of P. aeruginosa lineage variants without cultivation or genome
assembly. To distinguish and track P. aeruginosa lineage variants in patient CFR11, we
took advantage of the repeated samplings in our time series data. Under the assumption
that the relative abundances of competing P. aeruginosa populations in a patient would
vary over time, any population-specific sequence variants should similarly vary over time.
This would allow reconstructing constituent genomes through clustering sequence var-
iants by their shared temporal behavior. To test this approach, we mapped all apparent
Pseudomonas reads from patient CFR11 to the closest reference genome (P. aeruginosa
PAER4_119), which served as a scaffold (Fig. 3, steps 1 and 2). We then called single-nucle-
otide variants (SNVs) using metaSNV (29) and determined their allele frequencies at each
Downloaded from http://mbio.asm.org/ on May 11, 2021 by guest
time point (Fig. 3, steps 2 and 3). Finally, we determined clusters of SNVs displaying simi-
lar changes in allele frequencies over time (Fig. 3, step 4).
A total of 3,451 SNVs were called, of which 3,079 had allele frequencies detected at
every time point, with at least one allele frequency not equal to one. Repeated t-dis-
tributed stochastic neighbor embedding (t-SNE) runs at slightly varying settings consis-
tently yielded seven distinct clusters of SNVs in addition to a pool of lower-frequency
SNVs that could not be reliably clustered (Fig. 4A). Of the seven clusters, each showed
a clearly distinct pattern of allele frequencies over time (Fig. 4B). Cluster 3 appeared to
be a linear sum of clusters 2 and 6 (P , 2.2E216; comparison between the sum of SNV
allele frequencies from the aforementioned clusters over 10 time points to that of the
same SNVs but with the time points shuffled) and to inversely correlate with cluster
1 (P , 2.2E216), not differing from it significantly in the extent of temporal variation
(P = 0.38; comparison of standard deviations in individual SNV allele frequencies
between clusters). Clusters 6 and 7 followed a somewhat shared pattern over time,
with the exception of the first time point (P , 2.2E216), and did not significantly differ
in their extent of temporal variation (P = 0.10). Cluster 5 exhibited significantly less tem-
poral variation than cluster 6 (P = 3.4E225), and cluster 4 exhibited the least temporal
variation.
To investigate the clusters more carefully, we plotted the spatial positioning of the
cluster-specific SNVs in the reference genome (Fig. S7A). We found no association
between the distance of SNVs from the same cluster on the chromosome and the simi-
larity in their temporal profiles (Fig. S7C), indicating that the differences in allele fre-
quency patterns were not simply due to recombination of selected genomic regions
containing multiple SNVs. Neighboring SNVs from clusters 1, 2, 3, 6, and 7 were located
within the expected range of distances, indicating homogeneous distribution, but
neighboring SNVs from clusters 4 and 5 were closer to each other than expected
(P , 1E204), indicating the concentration of SNVs in selected genomic regions
(Fig. S7B). Together with the fact that these clusters exhibited less SNV temporal profile
cohesiveness than clusters 1, 2, 3, 6, and 7 (data not shown), we interpret such SNVs to
reflect intragenomic polymorphisms in relation to the reference genome (e.g., at tan-
dem-repeat regions) that were artifactually clustered together. Hence, clusters 4 and 5
were discarded. Considering the remaining clusters, the most parsimonious interpreta-
tion of the data appears to be the presence of three distinct P. aeruginosa lineage var-
iants in the patient (reflected in clusters 1, 2, and 6/7, respectively). In this scenario,
cluster 3 would consist of SNVs that are ancestrally shared between two of the variants
and whose frequencies reflect the sum of their relative abundances.
Because t-SNE is a nondeterministic algorithm, we sought to validate our observa-
tions. Therefore, we used the called SNVs to perform principal-component analysis
(PCA) combined with hierarchical clustering and to run DESMAN, a tool developed for
grouping SNVs into haplotypes by assessing the variation of nucleotide base frequen-
cies across samples and by using a Bayesian model to resolve possible sequencing
errors and SNVs that are shared between more than one strain (30). The clusters gener-
ated based on PCA were largely consistent, the only deviation being a merging of
March/April 2021 Volume 12 Issue 2 e02863-20 mbio.asm.org 7®
Dmitrijeva et al.
Downloaded from http://mbio.asm.org/ on May 11, 2021 by guest
FIG 3 Identification of lineage variants through assessment of temporal changes in SNV allele frequencies in the metagenomics data of patient CFR11.
(Step 1) Selection of a reference genome based on generated gene family presence/absence profiles. (Step 2) Read mapping of CFR11 samples to the
reference genome (CP013113.1). A pile-up of a selected region containing an SNV (1,959,777 to 1,959,791 bp) is shown for every time point. The reference
sequence is displayed on the bottom. Gray indicates read base pairs that are identical to the reference sequence. Orange indicates that a substitution to
guanine has occurred. (Step 3) The change in allele frequency over time for the selected SNV. (Step 4) A group of SNVs that show a similar pattern of
temporal changes in allele frequencies. The selected SNV is depicted in orange. The explicit steps performed and tools used in this approach can be found
in a flow chart in Fig. S6.
t-SNE clusters 6 and 7 (Fig. S8A and B). The three haplotypes yielded by DESMAN coin-
cided with clusters 1, 2, and 6 (Fig. S8C and D). Thus, we could validate the majority of
SNVs that were clustered together in t-SNE (Fig. S8E). In addition, we could confirm via
additional long-read sequencing that SNVs that were observed to cluster together by
March/April 2021 Volume 12 Issue 2 e02863-20 mbio.asm.org 8®
Strain-Resolved Microbiome Dynamics in Cystic Fibrosis
Downloaded from http://mbio.asm.org/ on May 11, 2021 by guest
FIG 4 Clustering of SNVs detected in patient CFR11 based on their temporal changes in allele frequencies. (A) A t-SNE plot depicting the clustering pattern
of 3,079 SNVs called in patient CFR11. Most SNVs occur at low allele frequencies (gray). The remaining SNVs form seven distinctly visible genotypes that
are labeled and colored accordingly. (B) Changes in the allele frequencies (p) of SNVs belonging to each distinct genotype over time. The colored line
indicates mean allele frequency of the genotype. Dark gray ribbons indicate the 95% confidence intervals.
all three methods indeed occurred on the same DNA molecule significantly more often
than expected based on their individual allele frequencies alone (P , 1E204) (Fig. S9).
Taken together, our results suggest the coexistence of three lineage variants that,
notably, would have been impossible to distinguish using the 16S rRNA gene alone
(Fig. S10). Likewise, at the observed pairwise divergence of less than 0.01% between
the variant genomes, traditional genome assembly approaches also would likely not
be able to distinguish these (31).
Subsequently, we focused on SNVs that were assigned to the same cluster or haplo-
type by all three methods (Fig. S8E). Out of the 563 SNVs from all three lineage var-
iants, 502 overlapped a gene in P. aeruginosa PAER4_119, with 459 genes containing
at least one SNV (Data Set S1 at https://string-db.org/suppl/Dataset_S1_Strain-resolved
_Microbiome_Dynamics_in_Cystic_Fibrosis.xlsx, diagnostic SNV genes). We next won-
dered whether genes known to be mutated in CF (32) would be preferentially mutated
in our lineage variants. Only variant 2 had a borderline significant enrichment of muta-
tions in these genes compared to the rest of the genome (P = 0.03, Fisher’s exact test),
while variants 1 and 3 had no enrichment compared to the rest of the genome
(P values of 0.21 and 0.15, respectively, Fisher’s exact test).
At least 100 SNVs separated each lineage variant from the other (Table 1). The
rate of mutations in P. aeruginosa has been estimated to be, at most, 5.5 SNVs per
year (33–35), unless a hypermutator phenotype develops (34, 36). To test for poten-
TABLE 1 Number of SNVs consistently clustered by three different approaches (t-SNE, PCA,
and DESMAN)
SNV type No. of SNVs
Lineage variant 1 specific 204
Lineage variant 2 specific 106
Lineage variant 3 specific 186
Shared between 2 and 3 67
March/April 2021 Volume 12 Issue 2 e02863-20 mbio.asm.org 9®
Dmitrijeva et al.
tial hypermutator mutations, we mapped reads to the six DNA repair genes known
to be affected in hypermutator strains: mutS, mutL, uvrD, mutM, mutY, and mutT
(35–38). We detected only one mutation that might disrupt gene function, a frame-
shift deletion in the mutS gene. However, this mutation was observed only in reads
corresponding to lineage variant 1 (not variant 2 or 3), and the mutation was posi-
tioned toward the 39 end of the gene, close to the stop codon of the predicted
open reading frame.
Detection of P. aeruginosa variant-specific structural genome differences. To
determine whether longitudinal metagenomics sequencing provides sufficient evi-
dence to detect large-scale genomic variation between lineage variants, we mapped
reads to the reference P. aeruginosa PAER4_119 genome and calculated the average
read coverage for windows of 1,000 bp along the genome. After normalizing for higher
read coverage around the origin of replication (39), any large-scale genomic differen-
Downloaded from http://mbio.asm.org/ on May 11, 2021 by guest
ces between lineage variants should become evident as time point-dependent devia-
tions in read coverage.
Indeed, the mean coverage in 70 windows was at least two standard deviations
from the overall mean coverage, combining into seven regions of the genome that
spanned more than two windows each (Fig. 5, circos diagram). Of these, the regions
located around 4.4 Mbp, 4.9 Mbp, and 5.5 Mbp coincided with predicted phage
sequences; structural variations at phage insertions are to be expected. A fourth region
around 2.7 Mbp showed inconsistent and overall low coverage in our sample data and
was not considered further. This left three regions of interest. Manual inspection
allowed us to pinpoint region borders more precisely at 1,639,504 bp to 1,649,747 bp
and 3,024,303 bp to 3,088,958 bp for two of the regions. The third region was revealed
to be composite, its borders at 3,228,483 bp to 3,235,055 bp and 3,241,118 bp to
3,243,808 bp. We further refer to these selected regions as regions 1, 2, and 3.
Each of the three regions showed significant correlations to the relative abundance
profiles of one of our inferred lineage variants (Fig. 5, line plots). Region 1 highly corre-
lated with the relative abundance profile of variant 1 (95% CI, 0.9731 , r , 0.9986;
P = 6.3E209), indicating that it was present in that lineage but absent from variants 2
and 3. The genes in region 1 included multiple metabolism-related genes, but its over-
all functional significance was difficult to assess. Region 2 correlated with the relative
abundance profile of variant 3 (95% CI, 0.8447 , r , 0.9913; P = 8.3E206). This region
contained pyoverdine synthetases and genes from the type VI secretion system. We
observed that two SNVs in the region mapped to variant 1, suggesting that it is present
in all three lineage variants but amplified at least 2-fold in variant 3. Several dozen
paired-end reads spanned from the end of the region back to its start, suggesting the
additional copies in variant 3 are either arranged as tandem duplications or form an
excised plasmid. Finally, the average coverage of region 3 correlated very well with the
combined relative abundance profile of variants 2 and 3 (95% CI, 0.9713 , r , 0.9985;
P = 8.2E209), indicating that it was absent from variant 1. This region contained multi-
ple genes of the psl operon, which plays a role in biofilm generation in P. aeruginosa.
Taken together, it becomes clear that the information contained in the relative read
coverage over time, when correlated with the relative proportions of SNVs, allows pre-
cise and confident mapping of large-scale genomic structure variants to their respec-
tive lineage variants.
DISCUSSION
In this study, we sought insights into the temporal dynamics of the lung micro-
biome in CF by using noninvasive DNA sequencing of lung sputum. By repeated sam-
pling of the lung microbiome over several months, we were able to distinguish persis-
tent pathogens from other, more transient community members. The taxonomic
identification of pathogens from sequencing data were generally in line with the clini-
cal microbiology laboratory reports, although in the case of Achromobacter and
Pseudomonas, the sequence-based identifications proved to be more precise.
March/April 2021 Volume 12 Issue 2 e02863-20 mbio.asm.org 10®
Strain-Resolved Microbiome Dynamics in Cystic Fibrosis
Downloaded from http://mbio.asm.org/ on May 11, 2021 by guest
FIG 5 Assessment of temporal variation in the coverage of specific regions in the genome of P. aeruginosa in patient CFR11. The circos diagram provides
an overview of the genome coverage profiles with chromosomal coordinates in kb. The dark gray outer circle depicts regions of the reference genome that
have a coverage of at least 5% from the average coverage at at least one time point. The second outermost circle depicts detected phage regions in
green. The remaining circles depict normalized coverage profiles for each of the 10 time points sampled for patient CFR11 (innermost, day 0; outermost,
day 496). Orange regions indicate lower than average coverage, and purple-blue regions indicate higher than average coverage. Insets highlight three
regions that display variant-specific coverage profiles. Each variant is depicted in a distinct color, and the average coverage of the selected region is
depicted in gray.
Moreover, with P. aeruginosa in patient CFR11, at least three distinct lineage variants
were observed. Importantly, distinguishing these variants would not have been possi-
ble without the longitudinal repeated samplings, showing that tracking patients over
time provides valuable added information. To our knowledge, only two other shotgun
metagenomics studies with multiple reference points per CF patient have been pub-
lished (20, 40). Both studies perform strain typing for recognized pathogens but do not
explore longitudinal genomic variation on a sublineage level.
March/April 2021 Volume 12 Issue 2 e02863-20 mbio.asm.org 11®
Dmitrijeva et al.
Longitudinal data from patient CFR11 allowed us to delineate at least three lineage
variants with distinct temporal dynamics for one of the best-covered pathogens, P. aer-
uginosa. Multiple studies have described genotypically and/or phenotypically distinct
P. aeruginosa subpopulations (38, 41–48) and provided insights into their abundance
fluctuations over time (43, 48) by sequencing cultured isolates from CF patients’ lungs.
Shotgun metagenomics sequencing approaches have indicated that P. aeruginosa is
polymorphic in some patients (17, 18), as are some other CF pathogens (17, 18, 49);
however, these studies were limited to a single time point for most patients, providing
no insight into subpopulation dynamics. Outside CF, in a more controlled in vitro set-
ting, a conceptually similar approach to ours has been used to study the molecular
evolution of E. coli populations over 60,000 generations, leading to the recognition of
coexisting clades (50). Here, we provide a proof of principle that this is also possible in
a clinical setting, in vivo, without prior knowledge of which pathogen strains to expect
Downloaded from http://mbio.asm.org/ on May 11, 2021 by guest
in a patient.
The emergence of phenotypically and genotypically distinct subpopulations of P.
aeruginosa in CF through lineage diversification has previously been shown to be
driven by spatial heterogeneity (44, 51). Lung regions differ in oxygen and carbon diox-
ide concentrations (52), patterns of ventilation and deposition (53), and disease burden
(54). General microbial community composition differs depending on lung region as
well (55, 56). Nevertheless, other studies have found no clustering of P. aeruginosa iso-
lates based on region of isolation (57) or have shown identical phenotypes and geno-
types in upper and lower airways (58, 59). Sputum sequencing does not provide us
with information on the spatial distribution of our lineage variants within the lung, but
we have observed strong temporal changes in the relative variant abundances over
the course of the study. These could be reflective of shifts in the lung compartments
sampled in the sputum or be indicative of general shifts in the complete lung, an inter-
esting question to explore in future research.
Lineage diversification within a patient makes infections in CF an unclear example
of strain mixing, as in the case of fecal microbiota transplantation (60). Thus, methods
that rely on all subpopulations being represented in a reference database would pro-
vide limited insights (61–63). Multiple tools, however, have been developed to recon-
struct haplotypes based on genetic variation with or without a reference (30, 60,
64–68). Tools assessing variation in a set of marker genes (60, 65, 67), while allowing
subpopulation identification when diagnostic SNVs happen to be present in these
markers, preclude insights into subpopulation-specific mutations in other genes that
could be of potential interest due to adaptation to the particular lung environment.
MetaPalette does use the entire genome (66), but it is unclear whether its “k-mer paint-
ing” approach would be able to discern and reconstruct distinct sublineages that differ
only by about 1 in 10,000 nucleotides. Of the remaining tools, to our knowledge only
EVORhA (64) has been used in a clinical setting (69). This tool explicitly reconstructs
haplotypes from reads mapped against a reference, but it does not use the information
in longitudinally related samples, instead focusing on abundance differences within
each single sample. Moreover, EVORhA has been criticized for artificially inflating the
number of haplotypes detected (68–70), including by a study that also used PacBio
sequencing for validation (70). Very recently, a promising new method for haplotype
reconstruction was published, displaying better performance on synthetic benchmarks
and strain mixtures than existing tools (71). This tool (mixtureS) likewise only works on
samples individually, but it does employ an expectation maximization algorithm for
the final step in strain identification. It has not yet been tested on highly similar line-
ages in a time course setting, however.
Our approach to longitudinal CF microbiome tracking using short-read metage-
nomics data still has a number of limitations. Linking SNVs from the whole genome
predominantly based on allele frequencies can be obscured by recombination events
and the presence of mobile genetic elements. Moreover, SNV linkage requires suffi-
cient data in terms of the number of time points and in terms of sequence read
March/April 2021 Volume 12 Issue 2 e02863-20 mbio.asm.org 12®
Strain-Resolved Microbiome Dynamics in Cystic Fibrosis
coverage depth. Although we have also performed variant calling and SNV clustering
on patients CFR07 and CFR09, the smaller number of time points prevented us from
performing lineage deconvolution on P. aeruginosa in a manner similar to that for
CFR11. In patient CFR06, Achromobacter was covered sufficiently for variant calling at
only one time point. Finally, although we had Achromobacter data from five time
points in patient CFR11, clustering of SNVs showed no apparent sublineages.
We could not perform subpopulation analysis of A. insuavis in a manner similar to that
with P. aeruginosa, but we could detect an apparent case of clinical species misidentifica-
tion in both patients CFR06 and CFR11. The observed pathogen lineage likely belongs to
A. insuavis, not A. xylosoxidans. The misidentification of Achromobacter species by conven-
tional clinical methods is not uncommon (26, 72, 73) due to the difficulty of distinguishing
species based on 16S rRNA sequence alone (26, 74, 75) and lack of representative spectra
in matrix-assisted laser desorption ionization–time-of-flight (MALDI-TOF) databases com-
Downloaded from http://mbio.asm.org/ on May 11, 2021 by guest
monly used by clinical microbiology laboratories (73, 76). Genotyping of several CF
patient cohorts using Achromobacter-specific marker sequences (26, 72) has revealed A.
insuavis was the second-most prevalent species after A. xylosoxidans (73, 77–80) or at least
accounted for a considerable fraction of Achromobacter infections (72). A. insuavis is also
one of the few Achromobacter species capable of chronic infection (77, 79, 80), and our
observations in patient CFR11 are in line with previous findings. Overall, our results from
P. aeruginosa and A. insuavis show that clear and reliable pathogen identification at vari-
ous taxonomic resolutions is possible without the need for cultivation based on commu-
nity-wide sequencing data alone.
The limited availability of genetic data for characterization was partly due to an
excess of human DNA; up to 93% of generated reads mapped to the human genome,
which is not unexpected in studies of lung sputum (17, 18). To enrich for nonhuman
material, we performed depletion of methylated DNA. The depletion worked to some
extent based on data from paired samples, and we obtained more than 25% nonhu-
man reads in some samples, which is more than a 2-fold improvement on the numbers
from previous studies (17, 18). However, it did not work equally well for each sample. A
recent assessment of human DNA depletion methods in human saliva samples showed
the limited effectiveness of currently available kits and introduced a new depletion
method that decreased the fraction of human reads to 8.53% (81). This method has yet
to be applied to sputum. Another recent study proposed a microfluidics-based method
to enrich microbial DNA in samples from human airways (82). The implementation of
methods enriching for nonhost material in oral and sputum samples looks promising,
as this would lead to a decrease in sequencing costs and provide more sequencing ma-
terial to study the less abundant bacteria.
In general, due to the lack of absolute abundance data, we also cannot be certain
whether the observed change in the relative abundance of a specific bacterium could
be in response to other bacteria growing and/or dying. In addition, as no explicit
dead cell depletion has been performed, some changes in relative abundance could
be influenced by the presence of DNA from dead cells, which have been known to
accumulate in CF mucus (83). Absolute quantification has already provided novel
insights into the gut microbiome (84), and, more recently, the application of quanti-
tative PCR for the absolute quantification of bacteria CF lung microbiome has chal-
lenged the existence of a CF lung microbiome in early childhood (85). Combined
with WGS, these quantitative approaches present a promising venue to increase
interpretability in future studies.
In conclusion, we have demonstrated how metagenomics sequencing of time series
data in CF patients can complement routine clinical diagnostics. Combined with recent
advances in targeted depletion of human material in samples (81, 82), sequencing
costs might sink soon to a point that would allow routine use of workflows such as
ours in the clinic; a recent case report estimated a similar procedure would take less
than 48 h (40). Noninvasive, whole-genome sequencing of sputum can provide better
taxonomic resolution for pathogens than the current methods routinely used in the
March/April 2021 Volume 12 Issue 2 e02863-20 mbio.asm.org 13®
Dmitrijeva et al.
clinic. Unlike 16S rRNA sequencing, classification can be made on a sublineage level. In
addition, by using data from multiple time points, multiple lineage variants of the
same species can be tracked within a given patient, including the assignment of vari-
ant-specific SNVs and variant-specific large-scale genomic changes. Coupled to a grow-
ing database of previously observed strains (ideally including the results of past antibi-
otics resistance tests as well as clinical outcomes), precise computational lineage
identification should enable continuous improvements in monitoring pulmonary infec-
tions in CF and assist in making decisions on disease management.
MATERIALS AND METHODS
Sputum sample collection. A cohort of 11 CF patients was monitored over the course of 2 years. All
study participants provided informed consent. The study was approved by the Cantonal Ethics
Committee, St. Gallen (EKSG 13/112). For the study, participants collected spontaneously produced spu-
Downloaded from http://mbio.asm.org/ on May 11, 2021 by guest
tum either at home on the same morning as their doctor consultation or directly at the hospital. All par-
ticipants have been trained since childhood on how to provide sputum for clinical analysis and were
particularly encouraged to brush their teeth and drink water prior to sputum collection. The sputum
samples were collected at the Cantonal Hospital St. Gallen, weighed, and aliquoted into sterile tubes.
Sputum samples from cohort patients who exhibited extreme clinical phenotypes during the course of
the study were selected to undergo shotgun metagenomics sequencing.
Clinical microbiology pathogen identification. All samples were subjected to standard clinical mi-
crobiology procedures used for CF sputum in an ISO 15089 certified laboratory. Sputum samples were
preprocessed with a liquefying agent (Copan SL-solution; RUWAG, Bettlach, Switzerland) before streak-
ing on agar plates. Columbia, chocolate, MacConkey, and CNA agars (Becton, Dickinson, Allschwil,
Switzerland) were streaked to support growth of the bacterial spectrum present in the upper airways.
For the specific detection of CF-associated pathogens, selective chromogenic plates (bioMérieux,
Geneva, Switzerland) were incubated: PAID agar for P. aeruginosa, SAID agar for S. aureus, and BCSA for
Burkholderia species (Achromobacter species usually grow well on this agar as well). All plates were visu-
ally inspected after 16 to 24 h of incubation at 36°C with or without 5% (vol/vol) CO2 per standard proto-
col (86), followed by a second inspection after another day of incubation. Colonies suggestive of CF-
associated pathogens or showing indicative growth on selective media were subjected to MALDI-TOF
analysis on a Bruker MALDI Biotyper (Bruker Daltonics, Bremen, Germany) using the standard direct
smear protocol. Per manufacturer recommendations, species identification was considered reliable at a
score above 2.000. In cases where no CF-associated pathogen was seen after both inspections, the cul-
ture was reported as respiratory tract flora.
DNA extraction, treatment, and sequencing. After dilution in Sputolysin (Calbiochem Corp., San
Diego, CA, USA), total DNA was extracted using the High Pure PCR template preparation kit (Roche,
Basel, Switzerland) per the manufacturer’s instructions. DNA concentration was measured using an
ACTgene UV99 spectrophotometer at a wavelength of 260 nm, and samples were stored at 220°C. As
the starting material was not limiting and sufficient amounts of DNA were available, no extra amplifica-
tion step was deemed necessary, and no extraction blanks for PCR/sequencing contamination control
were processed.
After DNA isolation, samples were subjected to methylated DNA depletion using the NEBNext micro-
biome enrichment kit (New England Biolabs Inc., Ipswich, MA, USA) to enrich for microbial DNA. As a
control, we included day 0 samples from all patients without performing depletion. Depletion of methyl-
ated DNA did not have a consistent effect on the total number of reads obtained (data not shown).
Relative microbial DNA content increased in three out of four patients by up to 2.3-fold but did not
exceed 27% (data not shown).
Next-generation sequencing libraries were prepared using the TruSeq DNA Nano library preparation
kit (Illumina, Inc., CA, USA) per the manufacturer’s instructions. The libraries were sequenced using the
Illumina HiSeq 4000 platform (Illumina, Inc., CA) in paired-end mode (2 125 bp). Reads were quality
checked with FastQC (87).
Removal of the host genome reads, contig assembly, and annotation. Reads were aligned to
human genome build 38 (88) using BowTie2 (version 2.3.1) (89), reporting at most one alignment per
read and writing read pairs that did not align concordantly to a separate file. Reads that did not align
concordantly to the human genome were used for downstream analysis and assembly. We assembled
reads into contigs using metaSPAdes (version 3.10.1) (90) with the metagenomic sample data flag. The
contigs were then searched against the NCBI nucleotide database (as of 24 June 2017) using BLASTn
(version 2.6.0) (91). During the search, an E value cutoff of 1E215 was used, and the five closest match-
ing sequences were retained. For taxonomic annotation, we only considered matching sequences that
had a bit score within a 10% range of the maximum scoring match. Contigs were assigned to the most
recent common ancestor of the considered matches. Assembly completeness and contamination were
assessed using the lineage workflow in CheckM (23). Phages and viruses were largely excluded from this
analysis due to their poor representation in databases and lack of a standardized taxonomy.
Taxonomic profiling and diversity estimation. Raw reads were trimmed and filtered based on
quality using sickle (version 1.33) (92). Trimmed and filtered reads were profiled using mOTUs (version
2.0.1) (profile at molecular operational taxonomic unit [mOTU], genus, and family taxonomic level; out-
put scaled read counts) (22) and MetaPhlAn (version 2.7.1) (profile at all taxonomic levels) (93). For
March/April 2021 Volume 12 Issue 2 e02863-20 mbio.asm.org 14®
Strain-Resolved Microbiome Dynamics in Cystic Fibrosis
MetaPhlAn input, all trimmed and filtered reads were pooled in the same file. The two methods exhib-
ited several disagreements in species delineation, but the generated taxonomic profiles (compared on a
sample-by-sample basis) highly correlated at the genus level (see Data Set S1 at https://string-db.org/
suppl/Dataset_S1_Strain-resolved_Microbiome_Dynamics_in_Cystic_Fibrosis.xlsx, mOTUs MetaPhlAn
comparison).
The amount of viral and fungal content was estimated with MiCoP (repository cloned August
2020) (21). The run-bwa.py script was used first to map trimmed and filtered reads to the viral and
fungal databases provided by the authors. Viral and fungal contents were then profiled using the
compute_abundances.py script with default detection thresholds to call organisms as present.
Results were output as raw counts.
To determine the aerobe and anaerobe content, detected species were mapped to oxygen tolerance
data from BacDive (as of August 2019) (94). Unclassified species from a known genus were labeled as
aerobe or anaerobe only when all species of this genus were labeled as aerobes or anaerobes.
Otherwise, the label “unknown” was assigned.
Diversity was calculated based on relative abundances obtained from mOTUs using Shannon’s diver-
sity index.
Downloaded from http://mbio.asm.org/ on May 11, 2021 by guest
Strain identification with PanPhlAn. For A. xylosoxidans, a total of 22 genomes and their annota-
tions were downloaded from the Integrated Microbial Genomes and Microbiomes Database (as of May
2018) (95). These genomes were used to create a pangenome using PanPhlAn (version 1.2.3.6) (28). We
used the pooled trimmed and filtered reads as input to the PanPhlAn software to generate gene family
presence/absence profiles for both sample and reference genomes, setting the strain similarity percent-
age threshold to zero to show results from all reference genomes. To call gene family presence, default
thresholds were used.
For P. aeruginosa, a total of 2,226 genomes were downloaded from the Pseudomonas Genome
Database (as of July 2018) (96). Because of the large number of genomes, we could not use the complete
set of genomes for PanPhlAn and had to generate a set of representative genomes. Pairwise genomic
distances were calculated using the Mash (version 2.0) sketch and dist commands (97). We discarded
outlier genomes with an average distance of more than 0.1 and with less than 90% estimated complete-
ness according to BUSCO (version 3.0.2), using the Gammaproteobacteria OrthoDB v9 database and the
Augustus E. coli gene prediction model (98, 99). Remaining genomes were clustered at a distance thresh-
old of 0.005. From each cluster, we selected the genome with the smallest average distance to all other
cluster members, yielding 359 representative genomes. The representative genomes were annotated
using Prokka (version 1.12) (100) and used to generate the pangenome using PanPhlAn (version 1.2.3.6)
(28) in the same manner as that for A. xylosoxidans.
Phylogenetic tree generation. A total of 145 genomes from the Achromobacter genus were down-
loaded from the NCBI Genome database (as of November 2018) (24) but one was discarded due to low
estImated completeness. We searched these genomes using BLASTn (version 2.6.0) (91) with an E value
cutoff of 1E215 against the mOTUs database (version 2.0.1) and against the PubMLST database of the
Achromobacter genus (as of July 2017). For our samples, we searched the contigs assigned to the
Achromobacter genus against the same databases. We used the coordinates output by the search to
extract the corresponding gene sequences from the genomes. If the extracted gene sequence was
shorter than the sequences of this gene in the databases, we padded the gene sequence with “X.” If a
gene was absent from the genome, we introduced a string of X’s that was the length of this gene.
We then produced two types of composite sequences. Based on the mOTUs database search,
sequences were created by concatenating the single-copy genes COG0012, COG0016, COG0018,
COG0172, COG0215, COG0495, COG0525, COG0541, COG0533, and COG0552. Based on the PubMLST data-
base search, sequences were created by concatenating the housekeeping genes eno, gltB, lepA, nrdA,
nuoL, nusA, and rpoB. Composite sequences that were more than half X’s were omitted from further
analysis. The remaining sequences were aligned using MUSCLE (version 3.8.1551) (101). Based on the
alignments, maximum likelihood trees were constructed using RAxML (version 8.2.10) (102) under the
GTRCAT model (random seed 1234). Bordetella pertussis (NC_002929.2) was used as an outgroup to root
the trees. One hundred bootstraps (random seed 1234) were performed on the trees to estimate branch
confidence.
For the third tree, the downloaded Achromobacter genomes and/or sample contigs were annotated
using Prokka (version 1.12) (100). The obtained gene sequences were used as the input for the
ANIcalculator (version 1.0) (103). Genes annotated as rRNA, tRNA, or tmRNA were excluded from the cal-
culation. Based on the calculated pairwise average nucleotide identities, a distance matrix was created
and genomes were clustered using the unweighted pair group method with arithmetic mean (UPGMA)
function in the R package phangorn (104). The number of monophyletic clades was calculated using the
check_monophyly function in the ETE Toolkit (version 3.0) (105).
For the 16S rRNA Achromobacter tree, rRNA sequences were predicted using barrnap (version 0.9)
for the Bacteria kingdom, using the default E value of 1E206 and rejecting all sequences that were less
than 80% of the length threshold (106). In genomes with multiple predicted 16S rRNA sequences, we
selected the sequence that had the highest average alignment score across all predicted singleton 16S
rRNA sequences. Furthermore, we discarded the sequences from Achromobacter sp. strain KAs 3-5 and
Achromobacter sp. strain BFMG1, as a quick search revealed these sequences were from a different fam-
ily. A total of 127 sequences (including B. pertussis) were used to generate the alignment and tree using
the same procedure as that for the Achromobacter mOTUs tree. The Robinson-Foulds metric was calcu-
lated using the compare function in the ETE toolkit (version 3.0) (105). Only genomes present in all trees
were considered for the comparison.
March/April 2021 Volume 12 Issue 2 e02863-20 mbio.asm.org 15You can also read