Status Quo Report Open Data Almanac for Cities - South African Cities Network (SACN) - SA Cities
←
→
Page content transcription
If your browser does not render page correctly, please read the page content below

South African Cities Network (SACN)

Open Data Almanac for Cities
Status Quo Report

14 September 2015

                            FINAL DRAFT
Glossary

SACN       South African Cities Network

CoJ        City of Johannesburg

CoT        City of Tshwane

NMBM       Nelson Mandela Bay Municipality

EM         eThekwini Municipality

CBA        Cost Benefit Analysis

SoCR       State of the Cities Report

CoGTA      Department of Cooperative Governance and
           Traditional Affairs

SALGA      South African Local Government Association

MFMA       Municipal Finance Management Act

B2BIS      Back to Basics Information Systems

MOU        Memorandum of Understanding

StatsSA    Statistics South Africa

DoBE       Department of Basic Education

DEA        Department of Environmental Affairs

SAWS       South African Weather Service

SAAQIS     South African Air Quality Information System

                                                          1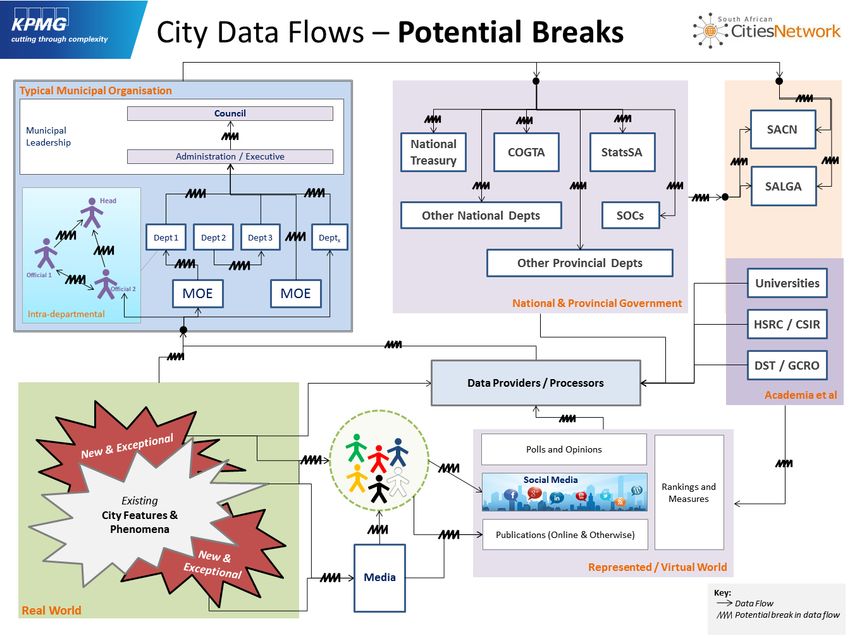
Contents
1        Executive Summary                                                                     1
2        Engagement and scope of work                                                          2

2.1      Objectives                                                                             2

2.2      Scope                                                                                  2
2.2.1    Phase 1: Project initiation                                                            2
2.2.2    Phase 2: Preparation                                                                   2
2.2.3    Phase 3: Pilot cities data capture                                                     3
2.2.4    Phase 4: Cost Benefit Analysis                                                         3
2.2.5    Phase 5: Concept SACN Urban Indicators Program                                         4

2.3      Restrictions and qualifications                                                        4
3        Backgound                                                                             5

3.1      The Environment for City Data                                                          5
3.1.1    City Data Flows                                                                        5
3.1.2    Local Government Reporting                                                             8

3.2      Indicators and Data Points                                                           10
3.2.1    SACN Indicators                                                                      10
3.2.2    Profile of Indicators and Data Points                                                12
3.2.3    Other Indicators – The ISO 37120, the World Council on City Data (WCCD) and the Global
         City Indicator Facility (GCIF)                                                       13

3.3      Comparison of SACN, ISO and GCIF Indicators                                           20
4        Methodology and approach                                                              23

4.1      Benchmark Study                                                                       23
4.1.1    Change in focus                                                                       23

4.2      Data canvassing and collection                                                        23
4.2.1    Key respondents                                                                       23
5        Research Findings                                                                     25

5.1      Benchmark study                                                                       25
5.1.1    The status quo                                                                        25
5.1.2    Concerns and realities                                                                26

5.2      Data canvassing and collection                                                        27
5.2.1    Canvassing                                                                            27
5.2.2    Survey                                                                                30
5.2.3    Data capturing                                                                        31
5.2.4    Urban Indicator Dashboard (updated 18 June 2015)                                      38
5.2.5    Municipal Involvement                                                                 39
5.2.6    Concurrent similar studies                                                            39
5.2.7    Different initiatives from inter and intra departmental Government                    39
5.2.8    Types of reporting                                                                    40
5.2.9    Our experience                                                                        40
5.2.10   Risk Mitigating Behaviour                                                             40
5.2.11   Capacitation                                                                          41
6        Conclusions and Recommendation                                                        42

                                                                                           2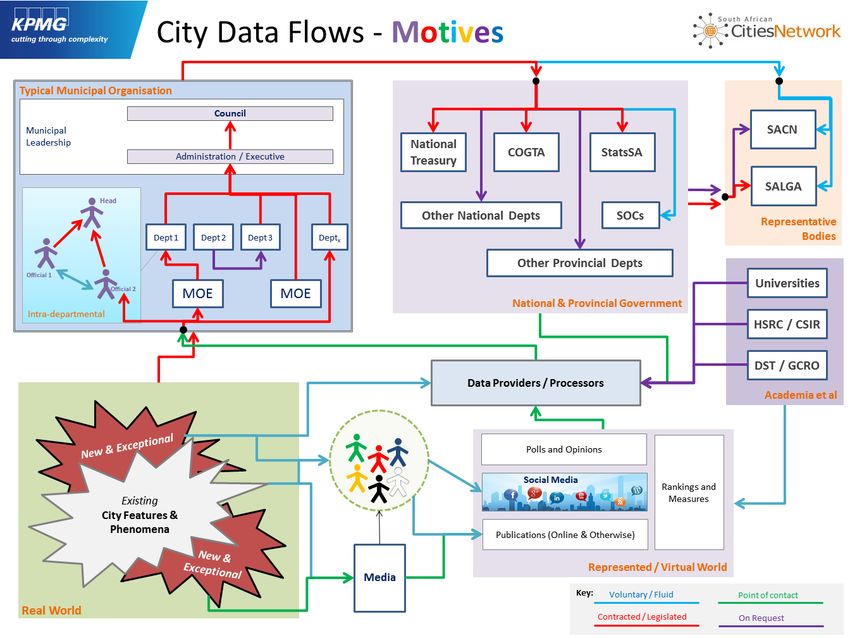
6.1            Conclusions                                                                                                                                    42

   6.2            Recommendations                                                                                                                                43
   6.2.1          Step 1: Co-ordinate mandate                                                                                                                    43
   6.2.2          Step 2: Determine the impact the South African Cities Network should have                                                                      43
   6.2.3          Step 3: Co-opt partnership from existing initiatives                                                                                           44
   6.2.4          Step 4: Take advantage of the agreement on a Central Database                                                                                  44
   6.2.5          Step 5: Define Open database as “Open to Those who Need it”                                                                                    44
   6.2.6          Step 6: Undertake some Specific Data and Indicator Related Interventions                                                                       45
   7              References and sources                                                                                                                         50
APPENDIX 1        COMPLETED SACN URBAN INDICATORS SPREADSHEET AS PER 18 JUNE 2015                                                                                52
APPENDIX 2        SURVEY TEMPLATES                                                                                                                               53
APPENDIX 3        RESULTS OF CANVASSING AND SURVEYS                                                                                                              54
APPENDIX 4        LOCAL GOVERNMENT REPORTING AND SUBMISSIONS                                                                                                     62
APPENDIX 5        THE DATA UNIVERSE                                                                                                                              64
APPENDIX 6        INFORMATION REQUEST LOG TO 13 MARCH 2015                                                                                                       66

   Figures
   Figure 1: City Data Flows - Status Quo .................................................................................................. 5
   Figure 2: City Data Flows – Motives ....................................................................................................... 6
   Figure 3: City Data Flows – Potential Breaks ......................................................................................... 7
   Figure 4: City Data Flows – Challenges .................................................................................................. 8
   Figure 5: List of key respondents .......................................................................................................... 24
   Figure 6: Reliability Rating System ...................................................................................................... 33
   Figure 7: Demographic Quality Dashboard ........................................................................................... 33
   Figure 8: Productive Quality Dashboard ............................................................................................... 34
   Figure 9: Sustainable Quality Dashboard ............................................................................................. 35
   Figure 10: Inclusive Quality Dashboard ................................................................................................ 36
   Figure 11: Well-Governed Quality Dashboard ...................................................................................... 37

   Tables
   Table 1: Number, frequency and type of returns submitted by municipalities to national agencies
   ................................................................................................................................................................ 9
   Table 2: List of 103 urban indicators ..................................................................................................... 10
   Table 3: International Standards Organisation (ISO) 37120 Standard on City Indicators Listed ......... 13
   Table 4: GCIF Profile Indicators ................................................................................................................ 16
   Table 5: GCIF Performance Indicators ...................................................................................................... 17
   Table 6: GCIF Core and Supporting Indicators..................................................................................... 19
   Table 7: Core and Secondary/Supporting Indicators of SACN, ISO and GCIF .................................... 20
   Table 8: Comparison of SACN, ISO and GCIF Indicators by theme .................................................... 20
   Table 9: Assessment of Similar Indicators across SACN, ISO and GCIF Standards........................... 21
   Table 10: 103 Indicator Summary ......................................................................................................... 32
   Table 11: Total Indicator Summary ....................................................................................................... 32
   Table 12: LG Reporting by Month ......................................................................................................... 62
   Table 13: LG Reporting by Period ........................................................................................................ 63

                                                                                                                                                             3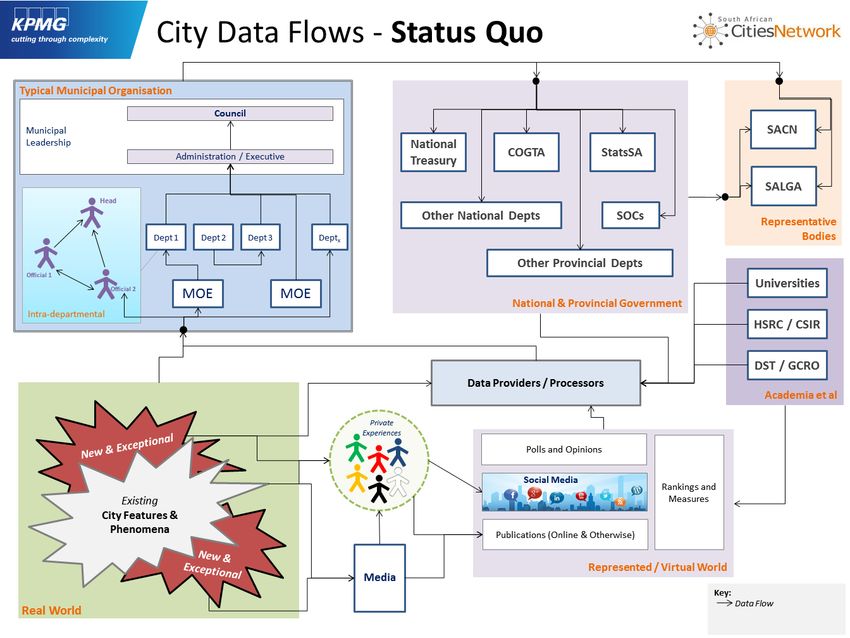
SACN Open Data Almanac for Cities: Status Quo Report
Final Draft
1 Executive Summary
A summary of this research study can be found here.
The result of this study have found that there is a deeply complex environment for data collection,
collation and management with regards to cities across South Africa. The different motives behind
monitoring and reporting in government, the public at large and in academia distort the subject,
substance and emphasis of what is being reported about cities.
Further, metropolitan municipalities in South Africa have a significant reporting burden to manage
beyond a complex monitoring and reporting environment to work within with well over 100 reports per
year that must be submitted to national and provincial departments, regulators and other entities.
Over and above the reporting burden, a limited and lack of capacity to undertake the monitoring and
do the required reporting is evident. This is compounded by the lack of systems (both organisational
process and platforms) that make it difficult for municipalities to provide data.
Whilst metropolitan municipalities are progressing towards developing outcome indicators, the SACN,
ISO and GCIF are focused on impact indicators that are not a significant focus for metropolitan
municipalities.
The impact indicators of SACN, ISO and GCIF are also not consistent, posing a threat of
municipalities diluting their focus and proceeding in on divergent tracks to developing their indicator
standards.
This study found that there are pressing gaps in the mandating of SACN to be the custodian for
collating free and available government information on cities – a matter that can be addressed by key
players, namely National Treasury, COGTA, SACN, StatSA and DPME among others.
There are challenges with the establishment of coordinators at the metropolitan municipality level that
will oversee the collection of data for submission to national departments, agencies and regulators.
There is a need to identify people at the level of municipal departments who would champion to
consistent collection and collation of specific data on indicators.
An SACN’s web portal is proposed to coordinate access to the data kept by national and provincial
department, regulators and other agencies as SACN is viewed as best placed to manage these
relationship and service level agreements. It is believed the main need and role of the SACN is to
institutionalise the coordination mechanisms for managing indicators and proposing pragmatic
methods for the regular collecting of credible data.
It is clear that the SACN has an important role to play. The recommendations included illustrate how
the SACN can facilitate alongside metropolitan municipalities the conducting of an independent
impact surveys that champion issues affecting cities, by doing the following:
Step 1: Co-ordinate mandate
Step 2: Determine the impact the South African Cities Network should have
Step 3: Co-opt partnership from existing initiatives
Step 4: Take advantage of the agreement on a Central Database
Step 5: Define Open database as “Open to Those who Need it”
Step 6: Undertake some Specific Data and Indicator Related Interventions
Refer to South Africa’s Best Practice for Data Management
Develop a Data collection mechanisms for impact indicators
Select a smaller, more practicable and manageable number of indicators that we think are necessary and
have valid data attached to them.
1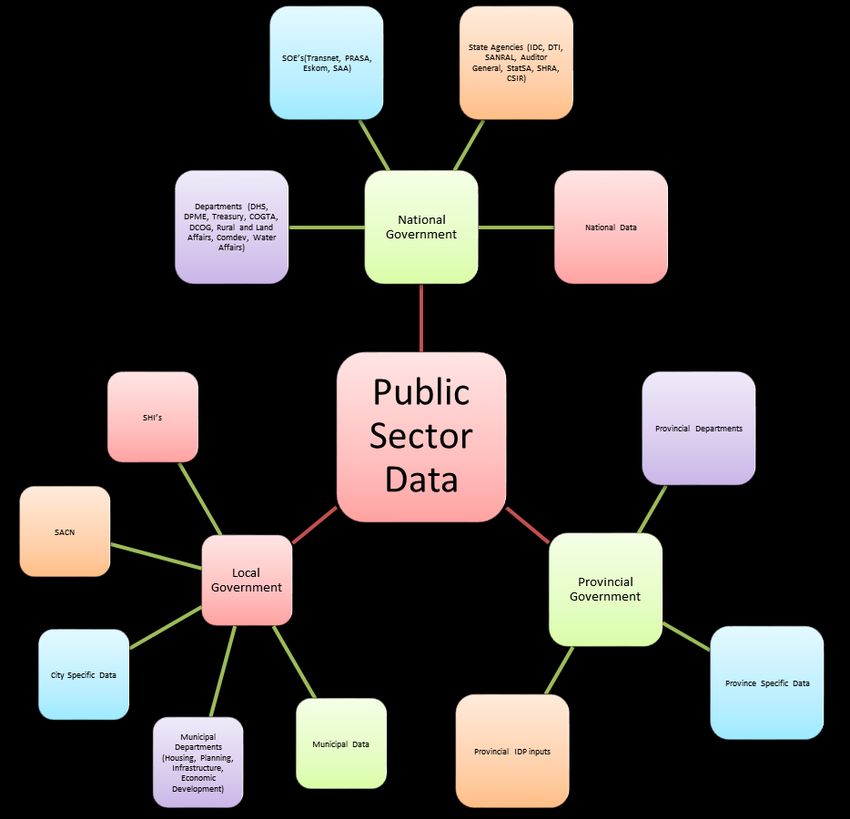
SACN Open Data Almanac for Cities: Status Quo Report
Final Draft
2 Engagement and scope of work
The project scope is detailed hereunder.
2.1 Objectives
The objectives of this engagement were to assist South African Cities Network with:
Undertaking data collection and collation of 103 urban indicators for four (4) pilot cities;
Conducting a qualitative Cost Benefit Analysis (CBA) on individual city versus collective
arrangements for urban data and indicators mechanisms; and
Developing a New City Data System Concept Paper.
This report captures the status quo understanding of the city data, the KPMG experience and
reflections with regards to the undertaking data collection and collation of 103 urban indicators for four
(4) pilot cities.
2.2 Scope
Our scope focused on the objectives detailed above in parallel. The level and depth of these
procedures performed by KPMG has been determined by SACN in coordination with the KPMG team,
and was dependent on time or other constraints, where applicable. The scope of the engagement
was:
2.2.1 Phase 1: Project initiation
Hold a project inception meeting with SACN project leaders and KPMG project team
Deliverable: Agreed Project Plan
Outcome: Project plan was agreed upon during the kick-off meeting on Monday 19 January 2015
2.2.2 Phase 2: Preparation
The KPMG project team designed an appropriate survey for obtaining urban indicator data. This was
supported by a questionnaire that identified and captured concerns relating to the CBA and Concept
Paper in Phases 4 and 5.
An MS Excel database was designed for capturing the data and metadata of 103 urban indicators as
it may relate to each of the four pilot cities. The design of these databases was submitted to SACN for
comment and confirmation before commencement with the data capture process. The KPMG project
team conducted internal survey and questionnaire testing and reported accordingly to the SACN at
the first Project Update Meeting.
Whilst this preparation did take place, the survey questionnaire was not completed by respondents
thus requiring a change in survey process. The KPMG project team include a record of the capture
process as designed to obtain urban indicator data.
KPMG was led by SACN with introductions to the relevant official in the pilot cities and in obtaining an
SACN Authority Letter for surveyors to undertake the survey.
Deliverable: Survey Questionnaire; Survey Approach & Methodology; Data & Metadata Capture
Templates; CBA Structure and Approach
Outcome:
2SACN Open Data Almanac for Cities: Status Quo Report
Final Draft
The KPMG project team has drawn up the survey questionnaire that was sent to the key
respondents identified. An additional questionnaire was drawn up and used during the KPMG
1
project team’s interaction with the four pilot cities .
The KPMG project team has set-up and populated an excel based indicator dashboard with all
available information.
2.2.3 Phase 3: Pilot cities data capture
KPMG will undertake City Data Surveys in four pilot cities, namely Johannesburg, Tshwane, Nelson
Mandela Bay and eThekwini.
We will collate and compile data and metadata in the databases as sanctioned by SACN and compile
a set of survey reflections to capture the lessons that may be relevant in the CBA and/or the concept
New City Data System.
The initial results and reflections will be shared with the SACN in a Project Update Meeting.
Deliverable: Four Pilot Cities Data Captured with Updated metadata Spreadsheets; Emerging
Descriptions of Data Use Processes and Transactions
Outcome: Data captured for the eight (8) metropolitan municipalities with metadata where available.
Descriptions of the data use process and transactions as provided by the various national and
municipal entities.
2.2.4 Phase 4: Cost Benefit Analysis
KPMG compiled an ‘as complete as possible’ set of actual and transactional costs as baseline costing
for obtaining current city data for 103 Urban Indicators, and also for current city data/reporting
systems.
A Cost Benefit Analysis for obtaining current city data will be undertaken using the four pilot Cities as
a sample and inferring – as is relevant –to all other cities. During the Cost Benefit Analysis, KPMG will
use the information that is available to cost and – where no financial measures exist – best estimate
the collection and cost estimation of the current city data/reporting data.
This analysis use the information above to provide the best approach for the collection and cost
estimation of a new city data/reporting system. The Cost Benefit Analysis will help to determine the
feasibility of the decisions required to achieve a new city data/reporting system and provide the basis
for comparison of the total expected actual and transactional costs against the expected benefits.
Due to the unknown extent and nature of the actual and transactional costs applicable, KPMG will use
actual numbers where available and make informed estimates based on qualitative information
gathered during the initial phases.
The CBA report will be delivered to the SACN and presented during another Project Update Meeting.
Deliverable: Qualitative Cost benefit Report for Obtaining Current City Data
Outcome: Due to the lack of/minimal amount of data received from the key respondents, a very high-
level and theoretical analysis and design was performed to contribute to a sensible Cost Benefit
Analysis of the two systems.
1
Please see Appendix
3SACN Open Data Almanac for Cities: Status Quo Report
Final Draft
2.2.5 Phase 5: Concept SACN Urban Indicators Program
The KPMG project team will detail the value proposition required from a New City Data System. The
expectation is that this new city data system will function to measure, capture, collate and report on,
at least, the 103 Urban Indicators captured for the four pilot cities. The report outlining the value
proposition will:
1) Specify the high-level business functionality and compile the appropriate motivation for addressing
prevailing City Data shortcomings;
2) Outline optimal organizational, management and operational requirements for the envisaged
system. This will include:
The detailing of the SACN Value Capture Options for the New City Data System;
Undertaking preliminary costing of the minimum value proposition, i.e. a possible prototype 1.
The New City Data System Concept Paper will be delivered to the SACN and presented during a
Project Update Meeting.
Deliverable: New City Data System Concept Paper
Outcome: to be advised
2.3 Restrictions and qualifications
The scope of our engagement be restricted in any way, such restriction may require us to qualify our
report accordingly.
We confirm that there are no legal opinions are provided in the contained report and that any
references to relevant laws and/or legislation, contained in our report, are not to be construed as
providing legal advice.
4SACN Open Data Almanac for Cities: Status Quo Report
Final Draft
3 Backgound
3.1 The Environment for City Data
3.1.1 City Data Flows
Data about cities flows in various ways that are captures in the City Data Flows Status Quo diagram
below. Whereas, the city features and phenomena experienced by users and the relevant entities is
largely the same and evidenced in the real world. The process by which data about these is captured,
manipulated, understood and represented is widely variable to the point of being unpredictable at
times.
Figure 1: City Data Flows - Status Quo
Source: KPMG
The real world incidence and/or triggers for reporting by either municipalities and/or other
stakeholders can be categorised into two types of features and phenomena, namely existing on the
one hand and new & exceptional on the other.
This distinction is critical in understanding how a typical municipal organisation may view, select and
process data about the city they manage. The focus of municipalities and other public organisation is
distinctly different from that of data providers and processors; the media and the recordings of
individual private experiences.
Key to why different data may flow from largely the same real world phenomena and experiences is
largely guided by the motives that inform why and what data is gathered. In the diagram below we
characterise these CITY data flows into four groups of motives.
5SACN Open Data Almanac for Cities: Status Quo Report
Final Draft
“Voluntary/fluid” data flows tend to be the most unstructured and unregulated, meaning that they
usually serve very specific purposes and the formats for this data transfer is inconsistent, irregular
and organic. These data flows are hardest to track and enforce and may rely heavily on relationships
between individuals in various organisations.
“On request” data flows are similar to those that are voluntary/fluid in nature in that they are ad hoc
requests and may be subject to power politics between the requester and data provider. These
relationships remain largely unstructured and unregulated even though there may be a formal request
between two entities. For example, much of the data canvassing done for this project took the form of
data flows that may fall into the “on request” category.
“Point of contact” data flows are distinguished below as those where an agent or organisation may
specifically seek out data for a stated purpose or to achieve a certain goals. This agent or
organisation likely commits resources and contracts individuals to collect this data for this purpose
and uses this accordingly. Whilst the data itself may be objective, the scope, scale and processing of
this data is limited for this specific purpose of the agent or organisation collecting this data.
Lastly, “contract/legislated” data flows are regulated and structured although their content and
purpose may not necessarily be. These requirements tend to follow the oversight role played by
national and provincial spheres of government to local government – making them heavily biased
toward compliance data. Whilst, within the municipality these data flows are those of accountability
between municipal entities and their accounting departments; or, between Heads of Departments and
officials who report to them; or, between the municipal executives and the Council members. These
data linkages are heavily impacted upon by the power and performance dynamic – making
information strongly skewed to aligning with municipal direction and objectives of accounting officers
or organisations. This is rarely a reflection of the objective data about the real world.
Figure 2: City Data Flows – Motives
Source: KPMG
6SACN Open Data Almanac for Cities: Status Quo Report
Final Draft
There are potential breaks in communication and processing of data. These breaks pose some
specific challenges to the data cycle and affects the quality of data being evaluated at the various
levels.
Figure 3: City Data Flows – Potential Breaks
Source: KPMG
7SACN Open Data Almanac for Cities: Status Quo Report
Final Draft
Figure 4: City Data Flows – Challenges
Source: KPMG
The above challenges are to be borne in mind in discussions about the indicators and data collection.
3.1.2 Local Government Reporting
Adding to the complexity of the discussion about indicators and data collection is the specific
challenge presented by South Africa’s prevailing local government reporting regime.
Metropolitan municipalities in South Africa face a significant burden of reporting. Even larger, more
established municipalities like Johannnesburg and eThekwini, it is clear that the pressures to produce
data for indicators and reporting are significant. The table below provides a list of the more recognized
questionnaires/returns that metros in any one-year have to submit,which are required by different
legislative and policy mandates (National Treasury, 2007).
The actual number when one includes reports to other departments (e.g. Dept. of Human Settlement,
parastatals and national regulators) can exceed the 127 reports listed hereunder. This includes the
production of reports to national departments and agencies, Annual Reports and other reports such
as the State of City Reports for individual Metros.
Below are a table listing the reports counted and the local government reporting calendar by month
and reporting period.
8SACN Open Data Almanac for Cities: Status Quo Report
Final Draft
Table 1: Number, frequency and type of returns submitted by municipalities to national agencies
Number of
Stakeholder / Frequency of
Title of Questionnaire / Return Submission
Role Player Submission
s
National
Treasury Capital Acquisition and Sources of Annually / Annually (3)
(National Finance Monthly Monthly (12)
Treasury)
Asset Management Information Annually 1
Grants and Subsidies Received Annually 1
Grants and Subsidies Given Annually 1
Annually / Annually (1)
Cash Flow Statement Monthly Monthly (12)
Statement of Financial Position Annually 3
Strategic Plan / IDP to Budget Annually 1
Age Analysis of Creditors Monthly 12
Age Analysis of Debtors Monthly 12
External Debt Schedule Quarterly 4
Budget Evaluation Checklist Annually 1
MFMA Implementation and
Monitoring Quarterly 4
MFMA – Corporate Entity Quarterly 4
MFMA – Long Term Contracts Quarterly 4
MFMA – PPP Quarterly 4
MFMA – Financial Management
Grant Monthly 12
MFMA – Restructuring Grant Monthly 12
Stats SA Financial Census of Municipalities Annually 1
Non-Financial Census of
Municipalities Annually 1
Survey of Capital Expenditure Annually 1
Survey of Statistics of Levies Quarterly 4
Survey of Quarterly Financial
Statistics Quarterly 4
SALGA Payroll Deduction Survey Annually 1
Basis Service Delivery
Questionnaire Annually 1
Local Government Capital Budget
Table A Annually 1
Local Government Operating
Budget Table B Annually 1
the DPLG Municipal Monitoring
Questionnaire Quarterly 4
9SACN Open Data Almanac for Cities: Status Quo Report
Final Draft
Number of
Stakeholder / Frequency of
Title of Questionnaire / Return Submission
Role Player Submission
s
Department
of Water WSA Regulatory Performance
Measure Annually 1
Affairs
Benchmark Indicators Annually 1
Water Service Quality Assessment Annually 1
Municipal
Demarcation
Capacity Assessment Annually 1
Board (MDB)
TOTAL REPORTS 127
Source: Africa Scope
Each of the spheres of government play a different role with regards to how and when the data is
collected and used. For national and provincial government the data is a reporting and compliance
requirement for local government intended for outcomes based measurement. Due to the nature of
the current reporting framework, there are a number of time consuming duplication processes. It has
also become apparent during this study that too many data points are being asked for measurement.
The cities/municipalities imply do not have the capacity to regularly provide data that is reliable.
This process needs to be defined and refined by all spheres of government in order to ensure the
most effective and efficient collection and use of the data required and collected by the various
stakeholders. The data missions of the various departments inform the indicators that are contained in
the data requests of cities. Since the eventual use of the data is not the same, this translates into a
duplication and apparent repeated request for the same data. This is reflected as a frustration with the
wide breadth of indicators that are required to be tracked without formalised and agreed methods and
resources being dedicated to collect this information on a regular basis. Often we assume other
should be collecting or capturing such information when this is, in fact, not taking place on the ground.
3.2 Indicators and Data Points
3.2.1 SACN Indicators
Of the total list of urban indicators, 103 of the 217 were selected as part of this pilot study. This list
was predetermined by SACN and provided to the KPMG project team. The final list of indicators
required is as follows.
Table 2: List of 103 urban indicators
Demographic Productive Inclusive Sustainable Well Governed
Municipal
Gross Value Add Learner enrolment-
Population size Water availability management
(GVA) primary
vacancies
Population density
Learner enrolment-
(persons per Labour productivity Water losses Municipal posts
secondary
square km)
Learner-educator Municipal staff
Households Household Income Risk Score
ratio vacancies
Population growth Learner-classroom River and wetland Electricity
Cost of living
rate (1996 - 2001 ratio health interruptions
10SACN Open Data Almanac for Cities: Status Quo Report
Final Draft
Demographic Productive Inclusive Sustainable Well Governed
and 2001 -2011)
Population Economically active Completion rate -
Energy supply Water interruptions
projections population primary school
Employment
Completion rate - Energy Voter registration -
Net migration rate Absorption Rate
secondary school consumption national & local
(EAR)
International Unemployment Voter turnout -
Literacy rates Energy intensity
immigrants rate Rate national & local
Vulnerable
Batho Pele
Indigent population Matric pass rate Green energy
principles
unemployment
Human
Mortality - under 5
Poverty rate Development Index Renewable energy Citizen satisfaction
years
(HDI)
Number of Fixed- Access to free
landline telephone Multiple deprivation Alternative energy basic services to all
Gini coefficient
connections per index use qualifying people in
100,000 population the municipality
Number of mobile % allocated and
telephone spent of capital and
Life expectancy Dwelling type Energy losses
connections per maintenance
100,000 population budgets
Number of internet Greenhouse gas Capital and
connections per Dwelling tenure (GHG) emissions maintenance
100,000 population (carbon footprint) budgets
Informal shelter
Waste generation External audit
growth
New Housing Informal
Landfill availability
delivery settlements
Dwelling tenure Waste recycling Residential rates
Housing
Waste to energy Business rates
Affordability Index
Household cost Ambient air quality Services levy
Service Account Residential fuel Capital grants &
Arrears combustion transfers
Housing market Land
Spending profile
transformation
Sustainable Human
Coastal land
Settlement (SHS) Capital expenditure
transformation
Land
Passenger travel
Open Space Debt collection
costs
Public transport
Hunger Debtors
rezoning
Public transport
Bad Debt
building plans
Transportation
Acid test ratio
spend
11SACN Open Data Almanac for Cities: Status Quo Report
Final Draft
Demographic Productive Inclusive Sustainable Well Governed
Transport Debt to income
passenger trips ratio
Transport
Current ratio
passengers
Private transport Debt ratio
Public transport
Budget funding
vehicles
Motor vehicle Wasteful
ownership expenditure
Transport operating
costs
Travel time to work
Passenger waiting
times
Source: SACN
3.2.2 Profile of Indicators and Data Points
The profile of data points indicates that the bulk of the custodians of data and indicators about cities
are indeed not cities themselves. Cities are directly responsible for 16% of the indicators collected
here, however the reporting burden and complexity of the data flows are a direct result of the
custodians still requiring municipalities to generate the bulk of this data in some way, shape or form.
Number of Indicators /
Data Custodian % of 103 Selected
Data Points
Stats SA 41 40%
Metro's 16 16%
Subscription 1 1%
Industry 3 3%
Dept of Edu 8 8%
Health 0 0%
NHTS 6 6%
DEA 2 2%
Dept of Health 1 1%
National Treasury 8 8%
HAD 1 1%
IEC 2 2%
AG(SA) 2 2%
DWA 4 4%
NERSA 6 6%
12SACN Open Data Almanac for Cities: Status Quo Report
Final Draft
SANBI 2 2%
103
In the process of collecting the data for the list above, the data was also collected and collated data
for the total 217 list of indicators where it was available.
3.2.3 Other Indicators – The ISO 37120, the World Council on City Data (WCCD)
and the Global City Indicator Facility (GCIF)
3.2.3.1 The ISO 37120 Standard on City Indicators
ISO 37120:2014 is a standard published in 2014 that can be used by any city, municipality or local
government wishing to measure its performance in a comparable and verifiable manner, irrespective
of size and location or level of development. ISO 37120:2014 is the first ISO standard for city
indicators and is being developed as part of an integrated suite of standards for sustainable
development in communities.
The scope of ISO/TC 268 - Sustainable development in communities include requirements, guidance
and supporting techniques and tools to help all kind of communities, their related subdivisions and
interested and concerned parties become more resilient and sustainable and demonstrate
achievements in that regard.
The proposed series of International Standards will thus encourage the development and
implementation of holistic, cross-sector and area-based approaches to sustainable development in
communities. It will include Management System Requirements, Guidance and Related standards.
Table 3: International Standards Organisation (ISO) 37120 Standard on City Indicators Listed
ISO indicators Core/secondary
Economy City's unemployment rate Core
Assessed value of commercial and industrial properties as
a percentage of total assessed value of all properties Core
Percentage of city population living in poverty Core
Percentage of persons in full-time employment Secondary
Youth unemployment rate Secondary
Number of businesses per 100 000 population Secondary
Number of new patents per 100 000 population per year Secondary
Education Percentage of female school-aged population enrolled in
schools Core
Percentage of students completing primary education:
survival rate Core
Percentage of students completing secondary education:
survival rate Core
Primary education student/teacher ratio Secondary
Percentage of male school-aged population enrolled in
schools Secondary
Percentage of school-aged population enrolled in schools Secondary
Number of higher education degrees per 100 000
population Secondary
Energy Total residential electrical energy use per capita (kWh/year) Core
Percentage of city population with authorized electrical
service Core
Energy consumption of public buildings per year (kWh/m 2) Core
13SACN Open Data Almanac for Cities: Status Quo Report
Final Draft
ISO indicators Core/secondary
The percentage of total energy derived from renewable
sources, as a share of the city's total energy consumption Core
Total electrical energy use per capita (kWh/year) Secondary
Average number of electrical interruptions per customer per
year Secondary
Average length of electrical interruptions (in hours) Secondary
Environment Fine particulate matter (PM2.S) concentration Core
Particulate matter (PMlO) concentration Core
Greenhouse gas emissions measured in tonnes per capita Core
N 02 (nitrogen dioxide) concentration Secondary
S02 (Sulphur dioxide) concentration Secondary
03 (Ozone) concentration Secondary
Noise pollution Secondary
Percentage change in number of native species Secondary
Finance Debt service ratio (debt service expenditure as a
percentage of a municipality's own- source revenue) Core
Capital spending as a percentage of total expenditures Secondary
Own-source revenue as a percentage of total revenues Secondary
Tax collected as a percentage of tax billed Secondary
Fire and Number of firefighters per 100 000 population Core
emergency Number of related deaths per 100 000 population Core
response Number of natural disaster related deaths per 100 000
population Core
Number of volunteer and part-time firefighters per 100 000
population Secondary
Response time for emergency response services from
initial call Secondary
Response time for fire department from initial call Secondary
Governance Voter participation in last municipal election (as a
percentage of eligible voters) Core
Women as a percentage of total elected to city-level office Core
Percentage of women employed in the city government
workforce Secondary
Number of convictions for corruption and/or bribery by city
officials per 100 000 population Secondary
Citizens' representation: number of local officials elected to
office per 100 000 population Secondary
Number of registered voters as a percentage of the voting
age population Secondary
Health Average life expectancy Core
Number of in-patient hospital beds per 100 000 population Core
Number of physicians per 100 000 population Core
Under age five mortality per 1000 live births Core
Number of nursing and midwifery personnel per 100 000
population Secondary
Number of mental health practitioners per 100 000
population Secondary
Suicide rate per 100 000 population Secondary
Recreation Square meters of public indoor recreation space per capita Secondary
Square meters of public outdoor recreation space per
capita Secondary
Safety Number of police officers per 100 000 population Core
Number of homicides per 100 000 population Core
Crimes against property per 100 000 Secondary
Response time for police department from initial call Secondary
Violent crime rate per 100 000 population Secondary
14SACN Open Data Almanac for Cities: Status Quo Report
Final Draft
ISO indicators Core/secondary
Shelter Percentage of city population living in slums Core
Number of homeless per 100 000 population Secondary
Percentage of households that exist without registered
legal titles Secondary
Solid waste Percentage of city population with regular solid waste
collection (residential) Core
Total collected municipal solid waste per capita Core
Percentage of the city's solid waste that is recycled Core
Percentage of the city's solid waste that is disposed of in a
sanitary landfill Secondary
Percentage of the city's solid waste that is disposed of in
an incinerator Secondary
Percentage of the city's solid waste that is burned openly Secondary
Percentage of the city's solid waste that is disposed of in
an open dump Secondary
Percentage of the city's solid waste that is disposed of by
other means Secondary
Hazardous Waste Generation per capita (tonnes) Secondary
Percentage of the city's hazardous waste that is recycled Secondary
Telecommun Number of internet connections per 100 000 population Core
ication and Number of cell phone connections per 100 000 population Core
innovation Number of landline phone connections per 100 000
population Secondary
Transportati Kilometres of high capacity public transport system per 100
on 000 population Core
Kilometres of light passenger public transport system per
100 000 population Core
Annual number of public transport trips per capita Core
Number of personal automobiles per capita Core
Percentage of commuters using a travel mode to work
other than a personal vehicle Secondary
Number of two-wheel motorized vehicles per capita Secondary
Kilometres of bicycle paths and lanes per 100 000
population Secondary
Transportation fatalities per 100 000 population Secondary
Commercial air connectivity (number of non-stop
commercial air destinations) Secondary
Urban
planning Green area (hectares) per 100 000 population
Core
Annual number of trees planted per 100 000 Secondary
Areal size of informal settlements as a percentage of city
area Secondary
Jobs/housing ratio Secondary
Waste water Percentage of city population served by wastewater
collection Core
Percentage of the city's wastewater that has received no
treatment Core
Percentage of the city's wastewater receiving primary
treatment Core
Percentage of the city's wastewater receiving secondary
treatment Core
Percentage of the city's wastewater receiving tertiary
treatment Core
Water and Percentage of city population with potable water supply
Sanitation service Core
Percentage of city population with sustainable access to an
improved water source Core
Percentage of population with access to improved
sanitation Core
Total domestic water consumption per capita Core
15SACN Open Data Almanac for Cities: Status Quo Report
Final Draft
ISO indicators Core/secondary
Total water consumption per capita (litres/day) Secondary
Average annual hours of water service interruption per
household Secondary
Percentage of water loss (unaccounted for water) Secondary
The benefits of using this and any other standard can be surmised as follows:
More effective governance and delivery of services
International benchmarks and targets
Local benchmarking and planning
Informed decision making for policy makers and city managers
Learning across cities
Leverage for funding and recognition in international entities
Leverage for funding by cities with senior levels of government
Framework for sustainability planning
Transparency and open data for investment attractiveness
Comparable data for city decision making, insight and global benchmarking
ISO 37120:2014 is implemented through the World Council on City Data (WCCD) which hosts a
network of cities with open city data and provides a consistent platform for standardized urban
metrics.
The WCCD aims to be a global hub for creative learning partnerships across cities, international
organizations, corporate partners, and academia to further innovation, envision alternative futures,
and build better and more liveable cities.
The WCCD is implementing ISO 37120 Sustainable Development of Communities: Indicators for City
Services and Quality of Life. The WCCD has developed the first ISO 37120 certification system and
the Global Cities Registry™.
3.2.3.2 The Global City Indicators Facility (GCIF)
In recognition of this need, the Global City Indicators Facility (GCIF) was established to provide cities
with a standardized system for data collection. The GCIF includes a set of indicators that are
standardized, consistent, and comparable over time and across cities. Paired with a web-based
platform for sharing data across a global network, GCIF indicators become an invaluable tool for
exchange of reliable information and learning between cities. The GCIF has developed into a growing
global network of over 250 cities reporting on this standard across the world.
The GCIF Indicators are structured around 20 themes and measure a range of city services and
quality of life factors which supports and provides a framework for sustainability planning. The current
set of global city indicators was selected based on a pilot phase with nine cities and from significant
input from the current member cities, ensuring that these indicators reflect city information needs,
interests, and data availability. The indicators are easy to gather, most cities are already collecting
this information, therefore they are also inexpensive to collect by cities.
Table 4: GCIF Profile Indicators
Profile Indicator
People Total city population
16SACN Open Data Almanac for Cities: Status Quo Report
Final Draft
Profile Indicator
Population density (per square kilometer)
Percentage of country's population
Percentage of population that are children (0-14)
Percentage of population that are youth (15-24)
Percentage of population that are adult (25-64)
Percentage of population that are senior citizens (65+)
Male to female ratio (# of males per 100 females)
Annual population change
Population Dependency Ratio
Percentage of population that are new immigrants
Percentage of population that are migrating from elsewhere in the country
Housing Total number of households
Total number of occupied dwelling units (owned & rented)
Persons per unit
Dwelling density (per Square Kilometer)
Economy Average household income (US$)
Annual inflation rate based on average of last 5 years
Cost of living
Income distribution (Gini Coefficient)
Country's GDP (US$)
Country’s GDP per capita (US$)
City Product per capita (US$)
City Product as a percentage of Country's GDP
Total employment
Employment percentage change based on the last 5 years
Number of Businesses per 1000 Population
Annual average unemployment rate
Commercial/industrial assessment as a percentage of total assessment
Government Type of government (e.g. Local, Regional, County)
Gross operating budget (US$)
Gross operating budget per capita (US$)
Gross capital budget (US$)
Gross capital budget per capita (US$)
Geography and Region
Climate Climate Type
Land Area (Square Kilometers)
Percentage of non-residential area (square kilometers)
Annual average temperature (Celsius)
Average annual rain (mm)
Average annual snowfall (cm)
Table 5: GCIF Performance Indicators
Core Indicator Supporting Indicator
City Services
Education Student/teacher ratio Percentage of school-aged population
enrolled in schools
Percentage of students completing primary and Percentage of male school-aged
secondary education: survival rate population enrolled in schools
Percentage of students completing primary Percentage of female school-aged
education population enrolled in schools
17SACN Open Data Almanac for Cities: Status Quo Report
Final Draft
Core Indicator Supporting Indicator
City Services
Percentage of students completing secondary
education
Fire and Number of firefighters per 100,000 population Response time for fire department from
Emergency initial call
Response Number of fire related deaths per 100,000
population
Health Number of in-patient hospital beds per 100,000 Number of nursing and midwifery
population personnel per 100,000 population
Number of physicians per 100,000 population
Average life expectancy
Under age five mortality per 1,000 live births
Recreation Square metres of public indoor recreation
space per capita
Square metres of public outdoor
recreation space per capita
Safety Number of police officers per 100,000 population Violent crime rate per 100,000 population
Number of homicides per 100,000 population
Solid waste Percentage of city population with regular solid Percentage of the city’s solid waste that is
waste collection disposed of in an incinerator
Percentage of city’s solid waste that is recycled Percentage of the city’s solid waste that is
burned openly
Percentage of the city’s solid waste that is
disposed of in an open dump
Percentage of the city’s solid waste that is
disposed of in a sanitary landfill
Percentage of the city’s solid waste that is
disposed of by other means
Transportation Km of high capacity public transit system per Number of two-wheel motorized vehicles
100,000 population per capita
Km of light passenger transit system per 100,000 Commercial Air Connectivity (number of
population nonstop commercial air destinations)
Number of personal automobiles per capita Transportation fatalities per 100,000
population
Annual number of public transit trips per capita
Wastewater Percentage of city population served by Percentage of the city’s wastewater
wastewater collection receiving primary treatment
Percentage of the city’s wastewater that has Percentage of the city’s wastewater
received no treatment receiving secondary treatment
Percentage of the city’s wastewater
receiving tertiary treatment
Water Percentage of city population with potable water Total water consumption per capita
supply service (litres/day)
Domestic water consumption per capita (litres/day) Percentage of water loss
Percentage of city population with sustainable Average annual hours of water service
access to an improved water source interruption per household
Energy Percentage of city population with authorized Total electrical use per capita (kWh/year)
electrical service
18SACN Open Data Almanac for Cities: Status Quo Report
Final Draft
Core Indicator Supporting Indicator
City Services
Total residential electrical use per capita (kWh/year) The average number of electrical
interruptions per customer per year
Average length of electrical interruptions
(in hours)
Finance Debt service ratio (debt service expenditure as a Tax collected as percentage of tax billed
percent of a municipality’s own-source revenue)
Own-source revenue as a percentage of
total revenues
Capital spending as a percentage of total
expenditures
Governance Percentage of women employed in the
city government workforce
Urban Planning Jobs/Housing ratio Areal size of informal settlements as a
percent of city area
Green area (hectares) per 100,000
population
Table 6: GCIF Core and Supporting Indicators
Core Indicator Supporting Indicator
Quality of Life
Civic Engagement Voter participation in last municipal election (as a Citizen’s representation: number of local
percent of eligible voters) officials elected to office per 100,000
population
Culture Percentage of jobs in the cultural sector
Economy Percentage of persons in full time
employment
Environment PM10 concentration Greenhouse gas emissions measured in
tonnes per capita
Shelter Percentage of city population living in slums Percentage of households that exist
without registered legal titles
Number of homeless people per 100,000
population
Social Equity Percentage of city population living in
poverty
Technology & Number of internet connections per 100,000 Number of new patents per 100,000 per
Innovation population year
Number of higher education degrees per
100,000
Number of telephone connections
(landlines and cell phones) per 100,000
population
Number of landline phone connections
per 100,000 population
Number of cell phone connections per
100,000 population
19SACN Open Data Almanac for Cities: Status Quo Report
Final Draft
3.3 Comparison of SACN, ISO and GCIF Indicators
When looking at the three sets of indicator standards that South African cities are faced with, there
appears to be a few correlations and several divergences that are important to note.
Firstly, all the indicator sets are structured as sets of core and secondary/supporting indicators. Below
is a table showing how each indicator set compares. The assumption is that the core indicators are
based on data points gathered, whilst the secondary and supporting indicators may be calculated
and/or analysed through applying known methodologies.
Table 7: Core and Secondary/Supporting Indicators of SACN, ISO and GCIF
Total Number of
Core Secondary
Indicators
SACN 66 37 103
ISO 45 55 100
GCIF 72 43 115
Secondly, whilst broadly the indicators sets may seem to cover the same themes, there are marked
difference in emphases and focus. The three sets of indicators standards are compared below by
theme.
Table 8: Comparison of SACN, ISO and GCIF Indicators by theme
Indicator SACN GCIF ISO
Economy 7 14 7
Education 8 7 7
Energy 9 5 7
Environment 5 2 8
Finance 18 4 4
Fire and emergency response 0 3 6
Governance 1 6
Health 1 5 7
Recreation 0 2 2
Safety 0 3 5
Shelter 0 3 3
Solid waste 5 7 10
Technology and innovation 0 6 3
Transportation 10 7 9
Urban planning 0 3 4
Waste water 0 5 5
Water and sanitation 6 6 7
People 11 12 0
Housing 11 4 0
Government 7 5 0
Geography and climate 0 7 0
Civic engagement 0 2 0
Culture 0 1 0
Social equity 0 1 0
Development 5 0 0
103 115 100
20SACN Open Data Almanac for Cities: Status Quo Report
Final Draft
Lastly, the GCIF standard has 64 similar indicators with ISO 37120 standard showing a high level of
correlation. However, approximately one third of indicators are unique to each standard. This
represents the gap in data or the additional work cities would have to do to comply to both these
standards.
The SACN list of indicators has 18 similar indicators when compared to the GCIF standard, whilst it
also has 14 similar indicators with the ISO 37120 standard. The relatively low level of correlation is
possibly a function of the long history of the SACN indicator set and the breadth of argument that
these indicators provide in the State of Cities Report. Below is an assessment of Similar indicators
across the SACN, ISO and GCIF standards.
Table 9: Assessment of Similar Indicators across SACN, ISO and GCIF Standards
SACN and SACN and GCIF and
Similar indicators Notes Notes Notes
GCIF ISO ISO
Note: actually
4 but
Economy 3 1 3 calculation
method differs
Note: actually 5 Note: actually 7 Note: actually
but 2 are but elements are 5 but 1 of
Education 3 calculated
0 calculated
4 indicators is
differently differently combined
Note: actually 3 Note: actually 3
but they are but 2 are
Energy 0 calculated
1 calculated
5
differently differently
Note: actually 2
but they are are
Environment 2 0 calculated
1
differently
Note: actually 3 Note: actually 2
but 1is but they are are
Finance 2 calculated
2 calculated
4
differently differently
Fire and
emergency 0 0 3
response
Note: actually 2
but they are are
Governance 0 1 calculated
1
differently
Health 0 0 5
Recreation 0 0 2
Safety 0 0 3
Shelter 1 1 3
Note: actually 4 Note: actually
but 1 is 6 but 1 is
Solid waste 1 calculated
2 6 calculated
differently differently
Note: actually 2
Technology and but they are
3 calculated
3 3
innovation
differently
Transportation 2 3 7
Urban planning 0 0 3
Waste water 0 0 5
Note: actually 2
Water and but they are
1 calculated
0 6
sanitation
differently
21SACN Open Data Almanac for Cities: Status Quo Report
Final Draft
SACN and SACN and GCIF and
Similar indicators Notes Notes Notes
GCIF ISO ISO
People 0 0 0
Housing 0 0 0
Government 0 0 0
Geography and
0 0 0
climate
Civic engagement 0 0 0
Culture 0 0 0
Social equity 0 0 0
Development 0 0 0
Total 18 14 64
22SACN Open Data Almanac for Cities: Status Quo Report
Final Draft
4 Methodology and approach
This section outlines the approach and methodologies utilised to undertake the research project.
4.1 Benchmark Study
4.1.1 Change in focus
During the initial planning phases of the benchmark study, it was envisaged that a questionnaire
would be developed to obtain all relevant information relating to both indicators, as well as the
associated costs from the four pilot cities. However, after some consultation with the SACN, Africa
Scope and other stakeholders it became clear that cities are already overburdened and that a change
in our benchmarking approach was needed. The focus of the benchmarking study therefore changed
from the cities themselves to the external institutions/departments/entities collecting and compiling the
data.
The amended methodology adopted was used to try and obtain all the available indicators from
external sources, such as Statistics South Africa (StatsSA), National Department of Basic Education
(DoBE), National Department of Environmental Affairs (DEA), by using the contact details included in
the matrix developed by Arica Scope for the various external sources, requests for applicable
indicator datasets, as well as a consultation meetings. All the relevant findings and summaries of
these meetings are included under Section 4.
2
For a large portion of the financial indicators the available annual financial statements of the cities
were used as basis for the applicable amounts and calculations required.
4.2 Data canvassing and collection
4.2.1 Key respondents
The identification of key respondents for this study involved a targeted and referral based process.
The key departments across the spheres of government and other public and private institutions were
identified as key centres that may assist in providing the relevant data and information.
The KPMG project team approached the key respondents telephonically and via email to canvass
their willingness and ability to provide the relevant data. In cases where the first recipient of the
request was unable to assist, the KPMG project team allowed for referrals to alternate personnel,
which worked as the base of the referral process.
The respondents were initially approached to provide key information pertaining to the frequency of
reporting, the process of data collection and collation, the legislative or agreement reporting, the
custodianship of received data and the accessibility of the data. Given the focused nature of the study
and pilot cities, the KPMG project team also approached the National, Provincial Government
department’s national institutions and private firms.
The respondents contacted included:
2
As published on National Treasury’s website
23SACN Open Data Almanac for Cities: Status Quo Report
Final Draft
Figure 5: List of key respondents
Source: KPMG
24SACN Open Data Almanac for Cities: Status Quo Report
Final Draft
5 Research Findings
This section captures the key findings and lessons from each of the exercises that have been
undertaken for this project.
5.1 Benchmark study
5.1.1 The status quo
The purpose of the benchmark study was to understand the status quo around the collection and
collation of urban indicators in terms of the effort, time and cost involved in obtaining the relevant
data. In addition to the status quo, the benchmark study also focused on the future state and any
potential requirements, as well as alternative ways of obtaining, processing and reporting data in the
most cost effective and efficient manner.
The status quo focused mainly on the people, processes, systems/technology and cost of obtaining
the “who”, “what”, “when”, “where”, “why” and how of data collection, processing and reporting of
urban indicators. Throughout the duration of the study it was important to ensure that the correct
individuals at the selected cities, departments, institutions, and entities were being consulted and any
duplication effort identified.
The initial stages of this study dealt with the “people aspect” from which a host of responses were
elicited that focused on the effort required to obtain data, the systems used to store data, and the use
of the data. These result were captured in a way that ensured comparability between the various
metros, departments and entities and that the qualitative inputs were captured and assessed correctly
in order to add value/feedback to this report.
In July 2013 Africa Scope issued the findings on their study into the urban indicators used by the
SACN for the SoCR. The aim of this study was to conduct a scoping and planning exercise with key
stakeholders to develop a business plan for SACN to enable the systematic sourcing of data for
agreed indicators that would underpin the SoCR and other outputs.
The key findings included in the report that are reiterated by the KPMG project team include:
The feedback from cities that they have a significant reporting burden regarding outcomes based
indicators for internal purposes and a number of national departments, agencies and regulators.
The lack of capacity and inadequate set of systems to provide the data increases the reporting
burden. The cities again made a request to the SACN to avoid further burdening them with the
collection of new data.
Various stakeholders also felt that the SACN should use available data from existing data
collection mechanisms such as National Treasury and Stats SA to conduct detail analysis and that
the SACN should link with these and other institutions to access available data. This was
highlighted again in the interactions the KPMG project team had with the key respondents.
It was also suggested that SACN should develop a suite of knowledge products such as policy
briefs and a web portal to disseminate information for a range of purposes (concept of open
central database).
A User Requirements Assessment was also proposed by stakeholders to determine requirements
for knowledge products. In addition it was suggested that SACN engage with the National
Evaluation Policy Framework to ensure that the SoCR is institutionalised as an implementation
evaluation.
Based on the consultations with stakeholders, Africa Scope also developed a business plan
(issued as a separate report in July 2013). The goal of the plan was to develop an institutional
mechanism for conducting of an implementation evaluation including:
A coordination mechanism for the development and management of performance
indicators;
25You can also read