Spermine-Related DNA Hypermethylation and Elevated Expression of Genes for Collagen Formation are Susceptible Factors for Chemotherapy-Induced ...
←
→
Page content transcription
If your browser does not render page correctly, please read the page content below
ORIGINAL RESEARCH
                                                                                                                                         published: 01 September 2021
                                                                                                                                        doi: 10.3389/fphar.2021.746910

                                            Spermine-Related DNA
                                            Hypermethylation and Elevated
                                            Expression of Genes for Collagen
                                            Formation are Susceptible Factors for
                                            Chemotherapy-Induced Hand-Foot
                           Edited by:
                                            Syndrome in Chinese Colorectal
                     Nan-Hung Hsieh,
   California Department of Pesticide
                                            Cancer Patients
             Regulation, United States
                      Reviewed by:
                                            Mingming Li 1†, Jiani Chen 1†, Shaoqun Liu 2†, Xiaomeng Sun 3, Huilin Xu 4, Qianmin Gao 5,
                           Hua Chai,        Xintao Chen 5, Chaowen Xi 3, Doudou Huang 6, Yi Deng 1, Feng Zhang 1, Shouhong Gao 1,
       Sun Yat-sen University, China        Shi Qiu 6, Xia Tao 1, Jingwen Zhai 1, Hua Wei 1,7*, Houshan Yao 5* and Wansheng Chen 1,6*
                      Shicheng Guo,         1
                                              Department of Pharmacy, Second Affiliated Hospital of Naval Medical University, Shanghai, China, 2Department of Gastric
    University of Wisconsin-Madison,
                                            Intestinal Surgery, Minhang Hospital, Fudan University, Shanghai, China, 3Research Institute, GloriousMed Clinical Laboratory
                       United States
                                            Co., Ltd., Shanghai, China, 4Institutes of Biomedical Sciences, Fudan University, Shanghai, China, 5Department of General
                  *Correspondence:          Surgery, Second Affiliated Hospital of Naval Medical University, Shanghai, China, 6Traditional Chinese Medicine Resource and
                            Hua Wei         Technology Center, Shanghai University of Traditional Chinese Medicine, Shanghai, China, 7Department of Pharmacy, 905th
                weihua@smmu.edu.cn          Hospital of PLA Navy, Naval Medical University, Shanghai, China
                        Houshan Yao
                   58853993@qq.com
                     Wansheng Chen
                                            Hand-foot syndrome (HFS) is a common capecitabine-based chemotherapy-related
          chenwansheng@smmu.edu.cn          adverse event (CRAE) in patients with colorectal cancer (CRC). It is of great
     †
         These authors have contributed     significance to comprehensively identify susceptible factors for HFS, and further to
                    equally to this work
                                            elucidate the biomolecular mechanism of HFS susceptibility. We performed an
                                            untargeted multi-omics analysis integrating DNA methylation, transcriptome, and
                      Specialty section:
           This article was submitted to    metabolome data of 63 Chinese CRC patients who had complete CRAE records
                   Predictive Toxicology,   during capecitabine-based chemotherapy. We found that the metabolome changes for
                 a section of the journal
              Frontiers in Pharmacology
                                            each of matched plasma, urine, and normal colorectal tissue (CRT) in relation to HFS were
            Received: 25 July 2021
                                            characterized by chronic tissue damage, which was indicated by reduced nucleotide
        Accepted: 13 August 2021            salvage, elevated spermine level, and increased production of endogenous cytotoxic
     Published: 01 September 2021
                                            metabolites. HFS-related transcriptome changes of CRT showed an overall suppressed
                            Citation:
                                            inflammation profile but increased M2 macrophage polarization. HFS-related DNA
   Li M, Chen J, Liu S, Sun X, Xu H,
Gao Q, Chen X, Xi C, Huang D, Deng Y,       methylation of CRT presented gene-specific hypermethylation on genes mainly for
Zhang F, Gao S, Qiu S, Tao X, Zhai J,       collagen formation. The hypermethylation was accumulated in the opensea and shore
   Wei H, Yao H and Chen W (2021)
              Spermine-Related DNA
                                            regions, which elicited a positive effect on gene expression. Additionally, we developed
      Hypermethylation and Elevated         and validated models combining relevant biomarkers showing reasonably good
    Expression of Genes for Collagen
                                            discrimination performance with the area under the receiver operating characteristic
Formation are Susceptible Factors for
  Chemotherapy-Induced Hand-Foot            curve values from 0.833 to 0.955. Our results demonstrated that the multi-omics
     Syndrome in Chinese Colorectal         variations associated with a profibrotic phenotype were closely related to HFS
                      Cancer Patients.
       Front. Pharmacol. 12:746910.
                                            susceptibility. HFS-related biomolecular variations in CRT contributed more to the
     doi: 10.3389/fphar.2021.746910         relevant biomolecular mechanism of HFS than in plasma and urine. Spermine-related

Frontiers in Pharmacology | www.frontiersin.org                                     1                                     September 2021 | Volume 12 | Article 746910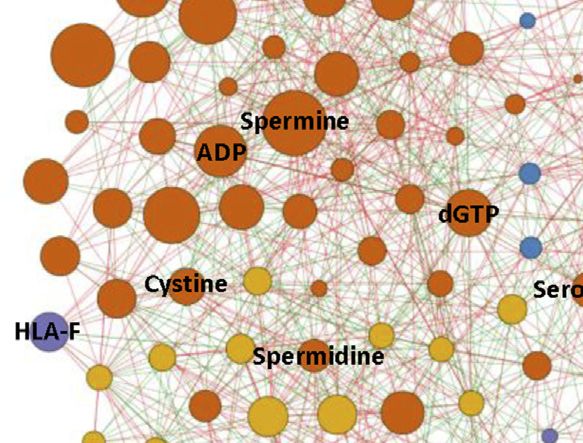
Li et al.                                                                                         Biomarkers for Chemotherapy-Induced Hand-Foot Syndrome

                                           DNA hypermethylation and elevated expression of genes for collagen formation were
                                           closely associated with HFS susceptibility. These findings provided new insights into the
                                           susceptible factors for chemotherapy-induced HFS, which can promote the
                                           implementation of individualized treatment against HFS.
                                           Keywords: adverse effects, chemotherapy, DNA methylation, hand-foot syndrome, immune response, multi-omics,
                                           spermine, susceptible factors

INTRODUCTION                                                                     methylation, plus the metabolome data for CRT, plasma, and
                                                                                 urine samples. Dietary intake data were also recorded during
According to the National Comprehensive Cancer Network                           flow-up. The results advance our understanding of HFS
(NCCN) guidelines and routine clinical practice, the                             biochemistry and provide better biomarkers, which can further
capecitabine-based chemotherapy XELOX (capecitabine plus                         facilitate individualized treatment against HFS.
oxaliplatin) is the most recommended and adopted treatment
(Benson et al., 2018) for types of solid tumors, including
colorectal cancer (CRC) (Bray et al., 2018). Owing to the                        MATERIALS AND METHODS
cytotoxicity of capecitabine, however, XELOX can cause
various chemotherapy-related adverse events (CRAEs), one of                      Patient Selection and Sample Collection
the most common of which is the hand-foot syndrome (HFS, also                    Figure 1A illustrates the study design. Patients were selected from
called palmar-plantar erythrodysesthesia). It ranks within the top               a registered ongoing clinical trial (registered at www.clinicaltrials.
3 CRAEs with an incidence rate of up to 70% (Lou et al., 2016;                   gov, NCT03030508) carried out at Shanghai Changzheng
Yap et al., 2017; Deng et al., 2020; Li et al., 2021). HFS symptoms              Hospital from January 2018 to April 2019. The study protocol
include redness, swelling, as well as pain on the palms of the                   was approved by the Biomedical Research Ethics Committee of
hands and the soles of the feet. Consequently, HFS can influence a                Shanghai Changzheng Hospital, and written consent was
patient’s adherence to a chemotherapy regimen and adversely                      obtained from each patient. Inclusion criteria were: 1) over
affect his/her quality of life.                                                  18 years old; 2) CRC confirmed by biopsy; 3) the first
    Personalized medicine can help prevent CRAEs because a                       treatments were resection followed by capecitabine-based
personalized approach ensures the proper selection of drugs and                  adjuvant chemotherapy. CRAEs were recorded according to
their dosages. One of the prerequisites for personalized medicine                Common Terminology Criteria for Adverse Events (CTCAE,
is predictive markers. However, the CRAE biomarkers need to be                   Version 4.0), based on which patients were divided into three
optimized in at least two aspects. First, the currently available                groups: grade 0 HFS (HFS0), grade 1 HFS (HFS1), and grade 2/3
HFS biomarkers focus mainly on capecitabine metabolism.                          HFS (HFS2/3) (Additional file 2: Supplementary Table S1).
Germline polymorphisms of genes controlling drug                                    Fasting urine samples were collected into 15-ml Falcon tubes,
metabolism (Lam et al., 2016) and each drug’s                                    and plasma samples were collected into 15-ml EDTA tubes
pharmacokinetic parameters (Daher Abdi et al., 2014) are                         1–3 days before resection. CRT was collected during resection.
related to HFS. Nonetheless, the response to a particular                        Immediately after resection, samples were taken from the CRC
cytotoxic substance (including a drug) may vary amongst                          tumor and the adjacent CRT (approximately 5–10 cm away from
individuals, which can also contribute to the sensitivity to                     the tumor site), and the entire CRT was then separated from the
CRAEs. Notably, our preliminary study has revealed potential                     tumor. All samples were stored at −80°C for later analysis. A total
valuable CRAE biomarkers derived from both endogenous urine                      of 63 cases with stored frozen tissue samples and complete CRAE
metabolites (Deng et al., 2020) and germline DNA methylation                     records were selected for subsequent analyses, which included 21
(M et al., 2021). Second, the pathological mechanism of HFS                      grade 0 HFS, 33 grade 1 HFS, and 9 grade 2/3 HFS patients.
requires further investigation. Although the most widely accepted
mechanism involves inflammation mediated by cyclooxygenase 2                      Metabolome Assays
(COX2) overexpression (Lou et al., 2016), a prospective study                    The metabolome assays were completed on a UHPLC system
reported that pyridoxine, which suppresses inflammation, cannot                   coupled to a quadruple time-of-flight mass spectrometer. Each
effectively prevent HFS (Yap et al., 2017). Our limited                          prepared sample was screened under both positive and negative
understanding of the HFS mechanism may be partially                              ionization modes (see the detailed descriptions of these methods
attributable to the lack of any apparent linkage between HFS-                    in Additional file 1: Supplementary Material). Metabolite data
related alterations in cell biochemistry as assessed with multi-                 were processed through multiple steps, including 1) best-matched
omics datasets.                                                                  internal standard correction for peak areas, with an additional
    To further address the mechanism underlying HFS, we                          creatinine correction for the urine metabolome, 2) 80% filtering
conducted an integrated multi-omics analysis of 63 CRC                           rule and cutoff for >40% coefficient of variation, outlier detection,
patients before they received adjuvant chemotherapy. The                         and imputation, and 3) normalization and transformation:
analysis integrated matched multi-omics data for normal                          quantile normalization, log10 transformation, Pareto scaling
colorectal tissue (CRT), including transcriptome and DNA                         (Bijlsma et al., 2006).

Frontiers in Pharmacology | www.frontiersin.org                              2                                 September 2021 | Volume 12 | Article 746910
Li et al.                                                                                                              Biomarkers for Chemotherapy-Induced Hand-Foot Syndrome

  FIGURE 1 | Study design and differential analyses on multi-omics datasets. (A) Sample collection and the experimental design. (B) The weighted average proportion
  variance of each clinical covariate effect in each omics dataset (CRT methylation, CRT transcriptome, CRT/plasma/urine metabolome). (C) Data analysis plan. (D) Distributions of
  differentially expressed features (DEFs) related to HFS susceptibility in each omics dataset. (E) Overview of intra- and inter-group variations. A principal components analysis (PCA)
  plot was generated using DEFs from each omics dataset. The metabolome data were acquired under positive (pos) and negative (neg) modes and are plotted separately. The
  circle of each group represents the 75% confidence interval. Abbreviations: CRC, colorectal cancer; CRAE, chemotherapy-related adverse event; CRT, normal colorectal tissue;
  DEF, differentially expressed feature; Meta, metabolome; Trans, transcriptome; P._Island, promoter-island region; P._Shore, promoter-shore region; P._Shelf, promoter-shelf
  region; P._Opensea, promoter-opensea region. Here, we focused on DMPs mapped to a specific gene, and thus DMPs in intergenic regions are not displayed here.

Frontiers in Pharmacology | www.frontiersin.org                                              3                                          September 2021 | Volume 12 | Article 746910
Li et al.                                                                              Biomarkers for Chemotherapy-Induced Hand-Foot Syndrome

DNA Methylation Assays                                                  Assessment of the Nutritional Status of
DNA was extracted from frozen tissue samples using the Takara           Patients
Genomic DNA Purification Kit. DNA was quantified using a                  To evaluate the contribution of dietary intake to any observed
Qubit 2.0 fluorometer (Invitrogen, Waltham, MA, United States).          variations in metabolite levels, a simple food-frequency
Bisulfite conversion of DNA was conducted using the Zymo                 questionnaire (FFQ25) for Shanghai residents was
bisulfite D5005 kit. Microarray assays were performed according          administered to each of the enrolled patients during
to Illumina’s standard protocol with the EGMK91396 kit.                 chemotherapy (Gao et al., 2011).
Processed methylation chips were scanned using an iScan
reader (Illumina, San Diego, CA, United States).
   Methylation data were analyzed using the ChAMP package               Integrated Analysis of Multi-Omics
(Tian et al., 2017). The extent to which each probe was                 Datasets
methylated was calculated as the β-value: β  intensity                 We carried out a multi-omics factor analysis (MOFA) (v1.2.0) by
(methylated) ÷ intensity (methylated + unmethylated).                   integrating differentially expressed features (DEFs) of five omics
Probes were accepted if they had significantly higher                    datasets for CRT DNA methylation, CRT transcriptome, and
intensity (p ≤ 0.05, compared with negative controls on each            metabolomes (in both positive and negative modes) from CRT,
chip) and higher frequency (≥95% amongst all samples).                  plasma, and urine with partially shared samples. The following
Exclusion of probes from non-CpG sites, sex chromosomes,                parameters      were      used:    1)    #tolerance,   0.01;   2)
and those containing a known SNP(s) yielded 753,722 probes              #DropFactorThreshold, 0.02; and 3) other parameters were set
that were subsequently normalized with respect to beta-mixture          to default (Argelaguet et al., 2018). Based on the weighted DEFs
quantile, and probes having a coefficient of variation value of          determined by MOFA, the DEFs at different developmental
>20% were excluded.                                                     stages of HFS were further studied by pathway enrichment
                                                                        analyses using the Reactome Database (online available:
RNA Sequencing                                                          https://reactome.org/) (Fabregat et al., 2016).
RNA sequencing was performed on 54 normal CRT samples.
Libraries were prepared using the Illumina TruSeq stranded
mRNA sample preparation kit, starting with 2 μg RNA.
                                                                        Construction and Validation of Potential
Oligo(dT) magnetic beads were used to reduce the abundance              Marker Systems for Hand-Foot Syndrome
of ribosomal RNA. The ribosomal RNA–depleted RNA samples                Prediction
were then randomly cleaved into ∼200-bp fragments, where were           To develop and evaluate the performance of the HFS prediction
then reverse transcribed into strand-specific complementary              model based on each omics dataset (except for the transcriptome)
DNA (cDNA) using random primers. Second-strand cDNA                     separately, we randomly divided the samples into training and
was then synthesized, with dTTP being replaced by dUTP.                 validation sets (7:3). While developing the model, a univariate
The resulting double-stranded cDNAs were purified using                  logistic analysis was performed using features with consistent
AMPure XP beads and then subjected to end repair and                    change in both the HFS1 and HFS2/3 groups compared with the
A-tailing. Finally, each cDNA was ligated to an index adaptor.          HFS0 group to identify features significantly associated with HFS.
The products then underwent PCR amplification (15 cycles)                To further narrow the candidate metabolome marker lists,
using an Illumina cBot system to create the final cDNA                   LASSO (least absolute shrinkage and selection operator)
libraries that were competent for cluster generation and                analysis with 10-fold cross-validation and randomForest
sequencing using the Illumina NovaSeq 6,000 platform with a             analysis with 1,000 trees were performed. Based on the
paired-end protocol.                                                    intersection of the top 10 features according to the non-zero
    Adapter sequences were removed from reads, and low-quality          coefficients in LASSO and mean decrease of accuracy in
3′-end fragments were excluded using Skewer (v0.2.2) (Jiang             randomForest, these important HFS-related features were
et al., 2014). After quality control using FastQC (v0.11.5,             combined to establish a HFS prediction model for the multiple
http://www.bioinformatics.babraham.ac.uk/projects/fastqc/), the         combined-marker systems using multivariate logistic regression.
reads were mapped to reference genome GRCh38 using STAR                 To further narrow down DNA methylation makers, a slightly
(v2.5.3a) (Dobin et al., 2013) with default parameters (Dobin and       different route was applied. The randomly sampling, LASSO-
Gingeras, 2015). Software RseQC (v2.6.4) (Wang et al., 2012) was        logistic and randomForest modeling was repeated 5,000 times,
used to check alignment quality, including total mapped reads,          and then the fibrosis-related DMPs from the top10 most
reads mapped ratio, and the number of uniquely mapped reads.            frequently selected DMP markers were enrolled for DNA
Read counts for each sample were calculated using HTseq                 methylation model construction. At last, by using our
(Anders et al., 2015). The FPKM value, i.e., fragments per              preliminary data as an independent validation dataset, which
kilobase of transcript per million fragments mapped, was                contained DNA methylation data from 21 CRC patients (M et al.,
calculated using StringTie (v1.3.1c) (Pertea et al., 2016). Genes       2021)           (https://www.ncbi.nlm.nih.gov/geo/query/acc.cgi?
for which FPKM was >0 in ≥50% of samples were retrained, and            accGSE149282), we tested our DNA methylation model.
outlier detection and imputation were employed, and the                 Unfortunately, so far there is no other public dataset available
log2(FPKM + 1) transformation was used for further analysis.            for further validation. ROC curves were analyzed to evaluate the

Frontiers in Pharmacology | www.frontiersin.org                     4                               September 2021 | Volume 12 | Article 746910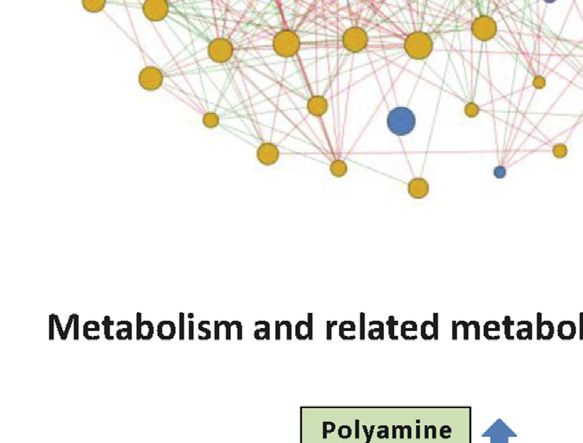
Li et al.                                                                              Biomarkers for Chemotherapy-Induced Hand-Foot Syndrome

predictive performance of each model. A flow chart for the model         transcriptome, 467 for the CRT metabolome, 327 for the
development and validation is presented in Figure 8A.                   plasma metabolome, and 442 for the urine metabolome
                                                                        (Additional file 2: Supplementary Table S2). The results
Statistical Analysis                                                    indicated that DNA hypermethylation was the most common
We eliminated the effects of baseline and potential confounding         susceptibility marker for HFS. The number of hypermethylated
factors of sex, age, weight, height, body mass index (BMI), CRC         DMPs correlated positively with HFS severity (Figure 1D).
location, and CRC stage (Combat method in ChAMP for                     Most of the hypermethylated DMPs were in the CpG-shore
methylation, removeBatchEffect method in limma for all                  and opensea regions. Overall, most HFS-related transcriptome
others). Differential expression analyses were performed to             features were downregulated. However, the number of
identify HFS-related features in each omics dataset (ChAMP              downregulated transcriptome features correlated negatively
for methylation and limma for transcriptome/ metabolome                 with HFS severity. For the HFS-related metabolome data, the
data) (Ritchie et al., 2015; Tian et al., 2017). DEFs for the           majority of the metabolites in CRT were downregulated.
methylation, the transcriptome, and the metabolome were                 Principal component analysis (PCA) for each omics dataset
filtered based on the following respective criteria: |Δ β-values|        revealed that the DEFs could be reasonably categorized into the
> 0.1; |log2 FC| > [mean ± 2 SD]; |log10FC| > 0. The “pvca”             three HFS grades (Figure 1E). The smallest sum of the first two
package was used for exploring the variation of the covariate           principal components was 27.8% [plasma metabolome profile
effect. The “CIBERSORT” package was employed for the analysis           (pos)], and the largest sum was 41.2% (CRT genomic DNA
of the abundance of 22 infiltrating immune cells for                     methylation profile).
transcriptome data (Newman et al., 2019). The “glmnet” and
“randomForest” packages were respectively applied for LASSO             Integrated Multi-Omics Response Profiles
and randomForest analyses to select features. The “pROC”                We further adopted MOFA to integrate the DEFs of the multi-
package was used for the analysis and visualization of                  omics datasets with partially matched samples in an unsupervised
AUROC. Gephi software (v0.9.2) was used to generate a                   manner (Figure 2A). MOFA can accommodate missing
network based on the results of the correlation analysis                values and provide more rigorous statistics than other
(Bastian et al., 2009). All statistical analyses were performed         statistical tools for multi-omics datasets (Argelaguet et al.,
using R software (v3.6.3), and p < 0.05 was considered                  2018). MOFA captured a total of 11 latent factors (LFs). All
statistically significant.                                               LFs explained 66.8% of the variation in DNA methylation
                                                                        data, followed by 36.0% in the RNA transcriptome, 23.4%
                                                                        in the CRT metabolome, 16.5% in the plasma metabolome,
RESULTS                                                                 and 15.1% in the urine metabolome. LF1 explained the
                                                                        greatest percentage of variations across all five datasets and
Patient Characteristics                                                 yielded the best categorization of the three HFS grades
The 63 CRC patients all received capecitabine-based                     (Figures 2B,C). According to the MOFA weight given by LF1,
chemotherapy on a 3-weeks cycle after resection surgery. The            the CRT metabolome profile had the greatest number of
study design is illustrated in Figure 1A. Patient samples of CRT,       features having a high value of MOFA weight (Figures 2D,E).
plasma, and urine were collected before chemotherapy. During            Within these top-weighted CRT features, spermine had the
each cycle, patients received oxaliplatin (0.16–2 g/d)                  highest MOFA weight. Spermine, spermidine, and serotonin
intravenously on day one and capecitabine (1.5 g/d) orally for          were enriched in pathways such as amine oxidase reactions,
the first two weeks. These patients received chemotherapy for at         organic cation transport, and polyamine oxidase reactions
least three cycles, and the median number of chemotherapy cycles        (Figure 2F).
was eight. These multi-omics datasets collected from those
patients were affected by several covariates, the variation
proportion of which are shown in Figure 1B using principal              Hand-Foot Syndrome-Related Metabolome
variance component analysis (PVCA) (Bushel, 2020); and the              in Colorectal Tissue, Plasma, and Urine
influence of these covariates were adjusted before the subsequent        To further investigate the LF1 results from the MOFA model,
analysis (Figure 1C).                                                   pathway enrichment was analyzed based on MOFA weighted
                                                                        features. For the CRT metabolome, the most significantly altered
                                                                        pathways shared between HFS1 and HFS2/3 were nucleobase
Differentially Expressed Features                                       catabolism, nucleotide salvage, and nucleotide metabolism, all of
Generated on the Multi-Omics Datasets                                   which were downregulated in HFS1 and HFS2/3 compared with
To comprehensively explore the mechanism of HFS                         HFS0 (Figure 3A). Also, the downregulation of nucleotide
development from different perspectives, we initially                   salvage in HFS2/3 was observed in the plasma metabolome
performed differential expression analysis for each omics               profile (Figure 3B). The development of HFS resulted in
dataset between any two of the three HFS grades, namely                 decreased levels of free nucleotides and co-factors involved in
HFS0, HFS1, and HFS2/3 (Figure 1D). The following                       DNA synthesis in CRT and plasma (Figure 3D). The most
numbers of DEFs were identified: 15,152 DEFs for                         significantly enriched pathway was organic cation transport in
methylation of CRT genomic DNA, 1,449 for the CRT                       HFS2/3 (Figure 3A). Several organic cations, including spermine,

Frontiers in Pharmacology | www.frontiersin.org                     5                               September 2021 | Volume 12 | Article 746910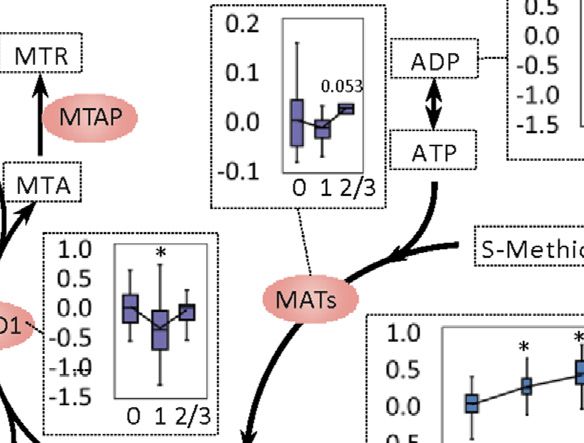
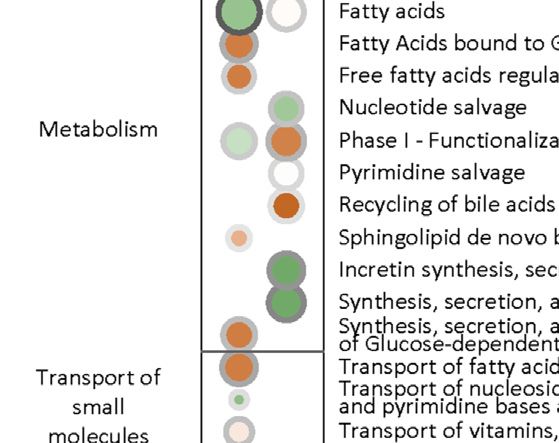
Li et al.                                                                                                       Biomarkers for Chemotherapy-Induced Hand-Foot Syndrome

  FIGURE 2 | Multi-omics factor analysis (MOFA). MOFA captured 11 latent factors (LFs) from the multi-omics datasets. (A) MOFA overview listing the number of
  samples and differentially expressed features (DEFs) from each omics dataset. (B) Explained variance (R2) by each LF (left) and the cumulative proportion of total variance
  explained (right) for each omics dataset of the MOFA model. (C) Score plots for the 11 LFs. The y-axis represents the each LF score for each sample. Colors denote
  sample groups. (D) The distribution of features based on the LF1 weight of the MOFA model. (E) The distributions of features with LF1 MOFA weight above the
  threshold of 0.06 from each omics dataset. (F) Pathway enrichment analysis of DEFs with LF1 MOFA weight > 0.06 (in HFS2/3), including CRT metabolome and CRT
  transcriptome. Cutoff: the minimum number of DEFs enriched in the pathway was set as 2, the p-value was set as 0.05, and –log10(P) was used for visualization.
  Pathway weight is defined as: (Enrichment ratio) × (sum of absolute value of DEF MOFA L1 weight in the pathway), and the dot size represents pathway weight. Pathway
  direction is the median fold change (FC) of DEFs for each dataset in the pathway (red, upregulated; green, downregulated). Abbreviations: LF, latent factor; MOFA, Multi-
  omics Factor Analysis.

serotonin, spermidine, and choline, correlated positively with                             Amongst all DEFs in the plasma metabolome, deoxycholic acid
HFS susceptibility (Figure 3E).                                                            had the highest MOFA weight (Figure 3F). These findings
   For the plasma metabolome, two pathways, namely, those                                  indicated that a significant change in lipid metabolism in
involving fatty acids and free fatty acid receptors, were the most                         plasma correlated with HFS susceptibility.
significantly altered pathways, reflecting the characteristics of                               For the urine metabolome, the most significantly altered
HFS 1 and HFS2/3, respectively. In these two pathways,                                     pathways shared between HFS1 and HFS2/3 were amino acid
docosapentaenoic acid (DPA) had the highest MOFA weight.                                   conjugation and conjugation of carboxylic acids (Figure 3C).

Frontiers in Pharmacology | www.frontiersin.org                                        6                                        September 2021 | Volume 12 | Article 746910
Li et al.                                                                                                         Biomarkers for Chemotherapy-Induced Hand-Foot Syndrome

  FIGURE 3 | Metabolome changes related to HFS susceptibility. Pathway enrichment analysis of differentially expressed features (DEFs) in CRT metabolome (A),
  plasma metabolome (B), and urine metabolome (C). Cutoff: the minimum number of DEFs enriched in the pathway was set as 4 (A), 2 (B), and 2 (C), and the p-value was
  set as 0.05. The dot border color represents the –log10(p) of pathway significance. Pathway weight is defined as: (Enrichment ratio) × (sum of absolute value of DEF
  MOFA L1 weight in the pathway), and the dot size represents pathway weight. Pathway direction is the median log10 fold change (FC) of DEFs in the pathway (red,
  upregulated; green, downregulated). Boxplots in (D), (E), (F), (G), and (H) show the relative metabolite levels of the related features enriched in the significantly important
  pathways in groups HFS0, HFS1, and HFS2/3 (from left to right). Statistical significance was set as: *p < 0.05 for HFS1 vs HFS0, HFS2/3 vs HFS0; #p < 0.05 for HFS2/3
  vs HFS1 by differential expression analysis using limma.

Frontiers in Pharmacology | www.frontiersin.org                                          7                                        September 2021 | Volume 12 | Article 746910
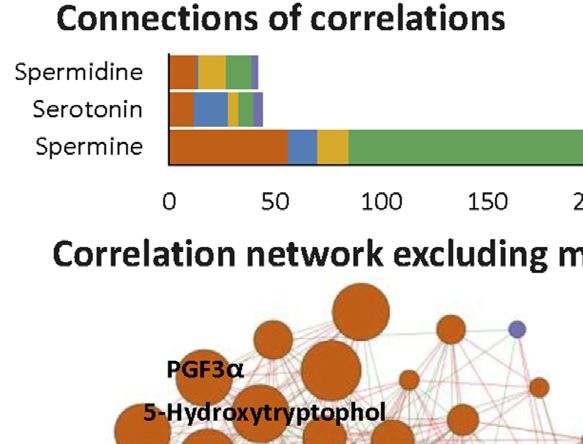
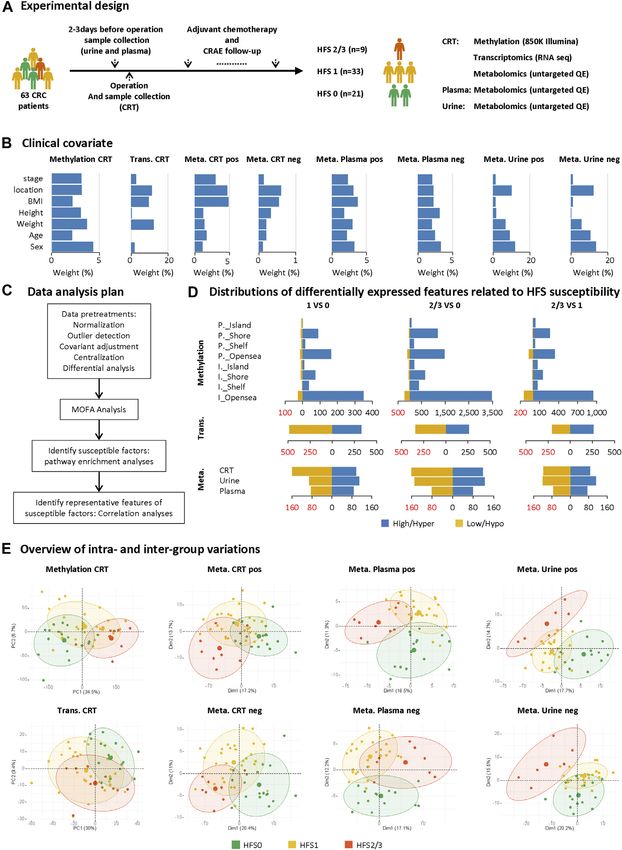
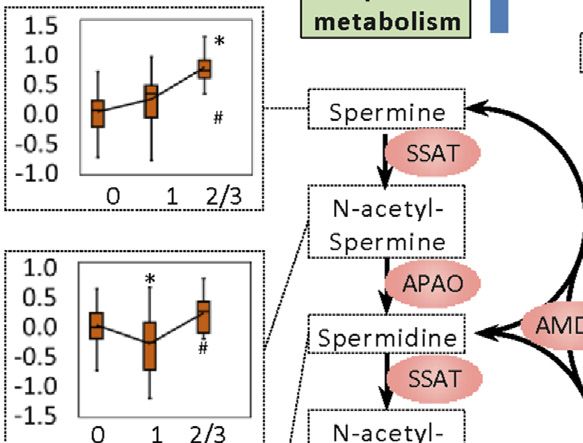
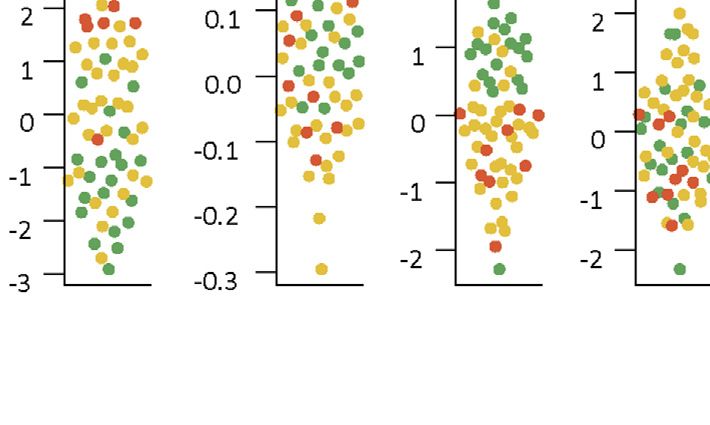
Li et al.                                                                                                               Biomarkers for Chemotherapy-Induced Hand-Foot Syndrome

  FIGURE 4 | Changes in spermine metabolism related to HFS susceptibility. (A) Connections of correlations. The stacked bar charts show the connections between differentially
  expressed features (DEFs) from all omics datasets with spermine, serotonin, and spermidine (selected based on MOFA LF1 weight and pathway enrichment analysis). (B) Correlation
  network with spermine, serotonin, and spermidine, excluding DNA methylation. A spermine-spermidine-serotonin metabolite-gene correlation network was constructed. The network
  included only paired DEFs with significant correlations (Spearman correlation, p < 0.05) in all omics datasets, excluding DNA methylation. The relatively important DEFs are labeled
  with feature names. Visualization was achieved with Gephi software (v0.9.2). Node colors represent the type of omics, and node sizes represent the strength of connections between
  features. Red edges represent positive correlations, and green edges represent negative correlations. (C, D) Metabolism and related metabolic processes of spermine (C) and serotonin
  (D). Boxplots show the relative expression levels of the relevant DEFs in groups HFS0, HFS1, and HFS2/3 (from left to right). Statistical significance was set as: *p < 0.05 for HFS1 vs
  HFS0, HFS2/3 vs HFS0; #p < −0.05 for HFS2/3 vs HFS1 by differential expression analysis using limma.

Frontiers in Pharmacology | www.frontiersin.org                                              8                                           September 2021 | Volume 12 | Article 746910
Li et al.                                                                                 Biomarkers for Chemotherapy-Induced Hand-Foot Syndrome

From DEFs implicated in these pathways, urine salicylic acid and          Spermine, Spermidine, and
its conjugation product salicyluric acid correlated positively with       Serotonin-Related Dietary Intake
HFS susceptibility (Figure 3G). Apart from this, HFS2/3 was also          In order to find the possible origin of the difference in the HFS-
characterized by increased melanin biosynthesis. The level of each        related amines (namely, spermine, spermidine, and serotonin),
urine pyroglutamic acid and L-Dopa correlated positively with             we performed the correlation analysis between each amine and
HFS susceptibility (Figure 3H).                                           each dietary intake (Figure 5A). The intake level of manufactured
                                                                          meat was positively related to both spermine and spermidine in
                                                                          CRT. The intake levels of seafood and zinc positively correlated
Spermine, Spermidine, and Serotonin                                       with both spermidine and serotonin in CRT. Interestingly,
Metabolism and Their Related Metabolic                                    although the spermidine levels in plasma were similar to that
Processes                                                                 in CRT, none of the dietary intake was associated with the plasma
Notably, for the CRT metabolome, a high MOFA weight was                   spermidine levels. Subsequently, we also found that the intake
apparent for each of spermine, spermidine, and serotonin                  levels of the majority of these amine-related food and nutrition
involved in organic cation transport (Figures 2E,F). Spermine             factors were not significantly different amongst the three HFS
had the highest MOFA weight amongst all input multi-omics                 grades (Figure 5B). Taken together, these results suggested that
features. Next, correlations between these three features and the         dietary food and nutrition intake were possible contributing
rest of the multi-omics features were examined, revealing the             factors for the variation of the HFS-related amines in CRT;
strongest connections with methylation, followed by CRT                   however, they were less likely to be the main contributing factors.
metabolome features, urine metabolome features, plasma
metabolome features, and transcriptome features (Figures
4A,B). The metabolomes for the three features and their                   Hand-Foot Syndrome-Related
related metabolic processes were further examined in detail.              Transcriptome in Colorectal Tissue
   Levels of spermine and spermidine increased gradually with             Overall, the HFS-related upregulated transcriptome features were
the development of HFS severity (Figure 4C). However, the level           mainly enriched in pathways governing protein metabolism,
of their precursor, ornithine, was not elevated in HFS1 but was           development, muscle contraction, RNA metabolism, gene
elevated in HFS2/3 compared with HFS0. The expression level of            expression, and signal transduction. The most significantly
adenosylmethionine decarboxylase 1 (AMD1) was even                        altered pathways shared between HFS1 and HFS2/3 were two
significantly suppressed in HFS1 but was recovered in HFS2/3               HOX-related pathways for development (Figure 6A). On the
compared with HFS0. The rate-limiting enzyme ornithine                    other hand, the downregulated transcriptome features were
decarboxylase (ODC) was not significantly changed in neither               primarily enriched in pathways governing immunity, protein
the HFS1 nor HFS2/3 group (Additional file2: Supplementary                 metabolism, signal transduction, and hemostasis. Interestingly,
Table S3). Moreover, the increase in the fold change (FC) of              the number of pathways that were enriched by downregulated
spermine level in HFS2/3 (compared with HFS0) was greater than            transcriptome features correlated positively with the severity of
that of its precursor ornithine. Therefore, the de novo synthesis         HFS. Genes with a high MOFA weight and connections to other
was not the reason for the elevated spermine level and it may even        omics data are presented in Figure 6B. In addition, CIBERSORT
be repressed as the HFS severity increased. This may lead to the          analysis based on the HFS-related transcriptome in CRT revealed
accumulation of SAM. SAM is the methyl-donor for the                      that M0 macrophages were significantly negatively associated
subsequent methylation. An expected upregulation of SAM                   with HFS grade (Additional file 2: Supplementary Table S4).
may also be contributed by the activated methionine cycle.                For macrophages M1 and M2, which are the downstream
With the elevated supply of methionine and consumption co-                polarization product of M0, M1 demonstrated a negative trend
factors ADP, the synthesis of enzyme methionine                           with HFS grade, while M2 showed a positive trend with
adenosyltransferase (MAT) had a trend of elevation. Plus, the             HFS grade.
decreased level of dihydrofolate (DHF) may also contribute to
SAM formation through the folate cycle.
   The same pattern was also observed for serotonin biosynthesis          Hand-Foot Syndrome-Related DNA
(Figure 4D). Levels of serotonin and its metabolite 5-                    Methylation in Colorectal Tissue
hydroxytryptophol were elevated gradually with the increased              HFS-related methylation changes were mainly enriched in the
HFS severity. However, the level of their upstream precursor 5-           pathway for extracellular matrix (ECM) organization
hydroxytryptophan was significantly suppressed in HFS1 but was             (Figure 7A). Collagen formation correlated positively with
recovered in HFS2/3 compared with HFS0 (Figure 4D). Also, the             HFS susceptibility. In HFS2/3, more pathways within the ECM
rate-limiting enzyme dopa decarboxylase (DDC) level was not               pathway were upregulated than in HFS1. A total of 15 genes that
remarkably changed. Therefore, the de novo synthesis was not the          were differentially methylated were also differentially expressed
reason for the elevated serotonin and 5-hydroxytryptophol. In             in the CRT transcriptome (Figures 7B,C). These genes were
parallel with the upregulation of serotonin and spermine                  hypermethylated in the CpG-shore and opensea regions of their
metabolism, the catabolism of the immunosuppressant vitamin               promoter and intragenic regions, and most of these genes were
B6 (VB6) was also upregulated.                                            upregulated in HFS samples.

Frontiers in Pharmacology | www.frontiersin.org                       9                                September 2021 | Volume 12 | Article 746910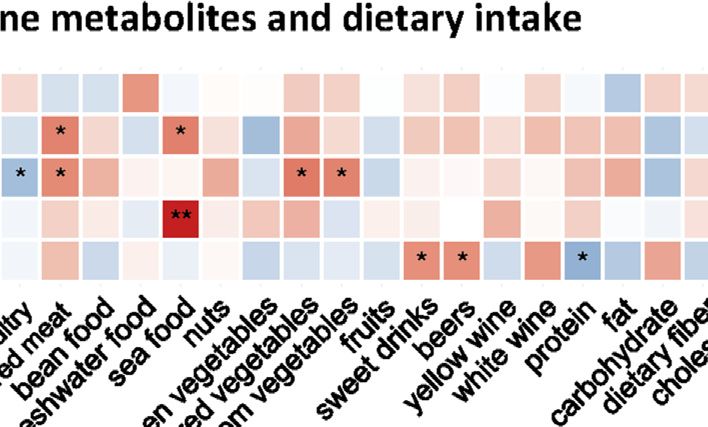
Li et al.                                                                                                    Biomarkers for Chemotherapy-Induced Hand-Foot Syndrome

  FIGURE 5 | Contribution of dietary intake to the levels of HFS-related amines in CRT. (A) Heatmap showing the correlations between HFS-related amine
  metabolites and dietary intake. Statistical significance was set as: *p < 0.05, **p < −0.01 (Spearman correlation). Red boxes represent positive correlations, and blue
  boxes represent negative correlations. (B) Boxplots show the relative levels of amine-related dietary intake. The Student’s t-test was used to examine the relationship
  between dietary intake for groups HFS0, HFS1, and HFS2/3, and significance was set as: *p < 0.05, **p < −0.01.

Potential Biomarkers for Hand-Foot                                                        DISCUSSION
Syndrome                                                                                  Differences in Multi-Omics Profiles Predict
Multiple screening steps (Figure 8A) of our datasets (except
for transcriptome data) yielded the following number of                                   the Hand-Foot Syndrome Susceptibility
DEFs: 4 for CRT metabolome, 5 for plasma metabolome, 4                                    Our results constituted the first demonstration that variations in multi-
for urine metabolome, and 3 for DNA methylation data; these                               omics profiles could predict the HFS susceptibility (Figures 1D,E, 2).
constituted potential biomarkers for HFS (Additional file 2:                               This was consistent with our previous report that variations in the
Supplementary Table S5). We further combined these                                        endogenous urine metabolome correlated positively with HFS (Deng
features to construct a prediction model for each omics                                   et al., 2020). As the CRT metabolome bears more similarities to that of
dataset (Additional file 2: Supplementary Table S6). All                                   skin than of plasma and urine in terms of their chemical composition,
the prediction models showed reasonably good                                              histology pattern, and cell developmental programs, changes in the CRT
discrimination performance, with relatively high AUROC                                    metabolome afford the best correlation with the HFS susceptibility.
values ranging from 0.833 to 0.955 (Figure 8B). Other                                         Since HFS does not occur in CRT, and CRT had more HFS-related
evaluation indices in the validation set also demonstrated                                metabolome changes compared with plasma and urine, the HFS-
relatively good predictive performance (Additional file 2:                                 related metabolomic alteration in CRT was less likely to be caused by
Supplementary Table S6). In addition, the AUROC for                                       diffusion or transportation from the skin through plasma to CRT. The
the DNA methylation model was 0.713 when examined by                                      more possible scenario was that the hazard factors inducing the
an independent testing dataset.                                                           susceptibility to HFS could also trigger a profound metabolic

Frontiers in Pharmacology | www.frontiersin.org                                      10                                      September 2021 | Volume 12 | Article 746910
Li et al.                                                                                                    Biomarkers for Chemotherapy-Induced Hand-Foot Syndrome

  FIGURE 6 | Transcriptome changes related to HFS susceptibility. (A) Pathway enrichment analysis of upregulated differentially expressed features (DEFs) (the
  upper left) and downregulated DEFs (the bottom left) on differential transcriptome. Cutoff: the minimum number of DEFs enriched in the pathway was set as 2, and the
  p-value was set as 0.05. The dot border color represents the –log10(p) of pathway significance. Pathway weight is defined as: (Enrichment ratio) × (sum of absolute value
  of DEF MOFA L1 weight in the pathway), and the dot size represents pathway weight. Pathway direction is the median log2 fold change (FC) of DEFs in the pathway
  (red, upregulated; green, downregulated). (B) Heatmaps (z-score) and boxplots show the expression profiles for representative transcriptome features for groups HFS0,
  HFS1, and HFS2/3. Statistical significance was set as: *p < 0.05 for HFS1 vs HFS0, HFS2/3 vs HFS0; #p < −0.05 for HFS2/3 vs HFS1 by differential expression analysis
  using limma.

Frontiers in Pharmacology | www.frontiersin.org                                      11                                      September 2021 | Volume 12 | Article 746910
Li et al.                                                                                                           Biomarkers for Chemotherapy-Induced Hand-Foot Syndrome

  FIGURE 7 | HFS-related DNA methylation changes and a proposed mechanism of chemotherapy-induced HFS. (A) Pathway enrichment analysis of differentially methylated
  genes (containing differentially methylated probes, DMPs). DMPs in opensea or shore regions were selected for the pathway enrichment analysis. Cutoff: the minimum number of
  DMPs enriched in the pathway was set as 5, and the p-value was set as 0.05. The dot border color represents the –log10(P) of pathway significance. Pathway weight is defined as:
  (Enrichment ratio) × (sum of absolute value of DMP MOFA LF1 weight in the pathway), and the dot size represents pathway weight. Pathway direction is the median Δβ of
  DMPs in the pathway (red, hypermethylated; green, hypomethylated). Notes: As for pathway direction, in the case of DMPs mapped to multiple regions (nine types of GDMR, gene-
  function-DMR: three gene-function, and three CpG-island-based regions), pathway direction is based on the direction of the region with the highest sum of absolute DMP MOFA
  L1 weight in the pathway. (B, C) Differential methylation–related transcriptional changes. Number of DMPs associated with significantly altered gene expression (B) and heatmap of
  significantly altered gene expression that associated with DMP (HFS 2/3 vs 0) (C). (D) Proposed mechanism of HFS. Abbreviation: DMPs, differentially methylated probes. Notes:
  The nine types of GDMR were: 1) promoter-island regions, 2) promoter-shore/shelf regions, 3) promoter-opensea regions, 4) intragenic-island regions, 5) intragenic-shore/shelf
  regions, 6) intragenic-opensea regions, 7) intergenic-island regions, 8) intergenic-shore/shelf regions, and 9) intergenic-opensea regions.

Frontiers in Pharmacology | www.frontiersin.org                                           12                                        September 2021 | Volume 12 | Article 746910
Li et al.                                                                                                     Biomarkers for Chemotherapy-Induced Hand-Foot Syndrome

  FIGURE 8 | Construction of potential marker systems for HFS prediction. (A) Flow chart for model construction. The entire set was used to identify differentially
  expressed features (DEFs) in each omics dataset. During model development, we randomly divided the samples into training and validation sets (7:3). Models were
  developed to discriminate CRC patients who did not experience HFS (HFS0) from those with HFS (HFS:HFS1, HFS2/3). Models were constructed based on CRT
  metabolome, plasma metabolome, urine metabolome, and CRT methylation, respectively. (B) Respective ROC (receiver operating characteristic) curves for the
  developed models in the training set, validation set, and entire set. Note: Independent validation was performed for CRT methylation only. Abbreviation: Sper, spermine.

change in CRT. In another word, the HFS-related metabolic changes                         depletion of the nucleotide pool (Figures 3A,B,D), which can
in CRT may infer the biomolecular mechanism of HFS susceptibility.                        cause DNA replication stress (Forrer Charlier and Martins, 2020).
The HFS-related changes in the CRT metabolome may provide clues                           These factors can cause damage to cells such as neurons that
to the biomolecular mechanism of HFS. Consistently, the barrier                           regenerate continuously (Fasullo and Endres, 2015), and cells that
surface tissues, including the gut and skin, share similar mechanisms in                  mediate the neuro-immune response. These cells are one of the
regulating neuro-immune response (Veiga-Fernandes and Mucida,                             main cell types of the barrier tissues such as skin and gut.
2016) to potential hazards (Lou et al., 2016).                                            Consistently, capecitabine-based chemotherapy can induce
                                                                                          chronic peripheral-nerve damage and hence cause increased
Hand-Foot Syndrome-Related Alterations                                                    sensitivity to pain sensation (Banach et al., 2018). In response
                                                                                          to inflammatory stimuli, injured cells release spermine into the
in the Metabolomes of Colorectal Tissue,                                                  extracellular space, which is a sign of upregulated tissue repair
Plasma, and Urine Indicate Potential                                                      along with the consequent increase in cell proliferation (Zhang
Chronic Tissue Damage                                                                     et al., 1999).
The reduced metabolite levels in pathways (metabolism of                                     Consistent with the signs of HFS-associated damages to CRT,
nucleotides, nucleotide salvage, and nucleotide catabolism) in                            the HFS-related plasma (Figures 3B,D,E) and urine (Figures
CRT and plasma of CRC patients indicated an imbalance or                                  3C,H) metabolomes were also characterized with signs of

Frontiers in Pharmacology | www.frontiersin.org                                      13                                       September 2021 | Volume 12 | Article 746910
Li et al. Biomarkers for Chemotherapy-Induced Hand-Foot Syndrome
elevated cytotoxicity. In plasma, DPA is an essential omega-3 tissues (Soda, 2018). Based on our data for dietary intake of study
fatty acid, which is a component of phospholipids found in all participants, spermine level correlated positively with high
animal cell membranes. DPA deficiency can lead to lesions of skin intakes of manufactured meat and seafood; however, no
and connective tissues, causing atherosclerosis, coronary significant association between excessive intake of either
thrombosis, and multiple sclerosis (Kaur et al., 2011). DPA is product type and HFS susceptibility was found (Figure 5B).
a precursor of anti-inflammatory mediators, and it can also Therefore, dietary habits were not the main reason for the
inhibit COX2 activity. Choline and deoxycholic acid are bile observed differences in spermine levels among the various
acids that facilitate the uptake of dietary fats and excretion of HFS groups.
cholesterol. Chronic exposure to elevated levels of bile acids can Upregulated spermine can lead to a series of metabolic
induce the generation of reactive oxygen species and reactive changes which were associated with substantial changes in the
nitrogen species, resulting in damages to cellular membrane and transcriptome. Spermine itself can be converted to spermidine
DNA (Ghonem et al., 2015). In urine, salicylic acid is a cytotoxic (Hesterberg et al., 2018). Because the expression of the rate-
microbial metabolite (Madan and Levitt, 2014). We found that limiting enzyme in this conversion (SAT1) did not correlate with
the levels of both salicylic acid and its conjugation product HFS susceptibility (Additional file 2: Supplementary Table S3),
correlated positively with HFS susceptibility. Pyroglutamic increased spermidine level may be a consequence of increased
acid, which is found in substantial amounts in the skin, can spermine level. Spermine also stimulated the release of serotonin
act as another metabotoxin that causes acidosis (Emmett, 2014). from mast cell granules (Figure 4D), which was in line with its
L-Dopa is the precursor of dopamine, the accelerated excretion of function (Kanerva et al., 2009; García-Faroldi et al., 2010). All
which through urine is an indicator of potential neuronal damage these amine molecules (spermine, spermidine, and serotonin)
(Lane, 2019). themselves serve as important immune function regulators in
Overall, our observed changes in metabolome datasets activating M2 macrophage polarization (Coates et al., 2017;
indicate that patients who are susceptible to HFS are likely to Latour et al., 2020).
suffer from chronic tissue damage. We expect that this damage Spermine can also induce DNA methylation by suppressing
probably exists in their hands as well, contributing to HFS the expression of AMD1 (Soda, 2018). Since the substrate of
susceptibility. However, we could not identify the origin of AMD1 is SAM, its level may be elevated subsequently. SAM is
this damage yet. Therefore, we focused on discussing the HFS- the methyl-donor for the DNA methyltransferase DNMT1.
related metabolites from the enriched pathway with the highest DNA methylation is controlled by the relative expression of
MOFA weight, namely, spermine, serotonin, and spermidine, genes encoding pro-methylation and demethylation enzymes
which were engaged in the organic cation transportation (Greenberg and Bourc’his, 2019). Because the transcriptional
pathway. We then moved on to discuss the multi-omics expression of DNMT1 and most of the other genes controlling
changes that might be caused by these damages. We believe DNA methylation correlated negatively with HFS
that features with a high MOFA weight can point to the most susceptibility (Figure 4C and Additional file 2:
fundamental biomolecular changes of HFS susceptibility. The Supplementary Table S7), the observed upregulation of
potential molecular pathological mechanism of HFS development DNA methylation could be mainly ascribed to an increase
can be refined by carefully interpreting these biomolecular in available SAM brought about by suppression of AMD1
changes in the background of the current understanding of expression. On the other hand, since the elevated supply of
these biomolecules. methionine and consumption co-factors ADP as the HFS
grade increased, plus MAT had a trend of increase in HFS2/
Chronic Tissue Damage Increases the 3, it was likely that the methionine cycle also contributed to an
increased SAM level. This process might contribute more to
Cellular Level of Spermine Which can Alter the overall DNA hypermethylation profile.
Immune Function and the Cellular DNA
Methylation Profile Variations in the Colorectal Tissue
The elevated level of spermine that we observed in HFS
susceptible patients was a consequence of leakage from
Transcriptome Correlate With Relative
damaged tissues as well as upregulated spermine biosynthesis Proliferation or Suppression of Immune
as the damage persisted. The de novo biosynthesis of spermine Cells
and spermidine was not upregulated in the HFS1 group In line with the well-established function of spermine (Latour
(Figure 4C). Ongoing tissue damage requires additional et al., 2020), the overall downregulation of immune function and
spermine, and therefore the HFS2/3 group exhibited increased induction of some immune-cell proliferation in patients with HFS
de novo biosynthesis of both spermine and spermidine was noticed. Depending on environmental factors, macrophages
(Figure 4C). Was this caused by increased uptakes of these generally can be stimulated to develop into either pro-
two metabolites? In healthy adults, polyamines are mainly inflammatory M1 or M2 macrophages (Murray and Wynn,
derived from foods or are synthesized by the intestinal 2011). M2 macrophages with the immunosuppressive function
microbiota. It is known that polyamines in the intestinal tract are involved in tissue repair. Spermine suppresses the polarization
are absorbed quickly, thereby rapidly increasing their levels in the of M1 macrophages yet activates the polarization of M2
portal vein, after which they are distributed to all organs and macrophages.
Frontiers in Pharmacology | www.frontiersin.org 14 September 2021 | Volume 12 | Article 746910Li et al. Biomarkers for Chemotherapy-Induced Hand-Foot Syndrome
Upregulated genes in CRT of HFS susceptible patients (HFS1 or for 20 types of collagens were all hypermethylated in CRT of
HFS2/3 groups) indicated an induced proliferation phenotype. patients susceptible to HFS (Karsdal et al., 2017). It is noteworthy
HOXA4 belongs to the HOX (homeobox) family of transcription that, in our study, changes in the expression of genes that govern
factors (Li et al., 2020). Serotonin plays multiple important roles in the methylation pattern did not correlate well with the overall
the immune system such as the activation of M2 macrophages (Wu DNA hypermethylation. Therefore, other mechanisms may
et al., 2019). Consistently, HOXA4 also induces the IL-6/STAT3 account for the observed dynamics of DNA methylation in
signaling pathway (Yang et al., 2011), which further activates M2 response to the increased spermine level and the consequent
macrophage polarization (Yin et al., 2018). M2 macrophages are hypermethylation of targeted genes. Our results support the
profibrotic, and their abundance are increased in the skin and notion that the effects of DMPs on gene expression are
plasma of patients afflicted with systemic sclerosis (Higashi- dependent on functional gene regions (gene body, promoter),
Kuwata et al., 2010). HOXA4 deficiency is related to the and intergenic regions (Greenberg and Bourc’his, 2019) as well as
downregulation of muscle contraction-related genes such as the relative distance between CpG islands (Klett et al., 2018). The
MYH11 that are expressed only in smooth muscle (Kimura et al., hypermethylated promoter-shore and intragenic opensea regions
2020). Elevated levels of HOXA4 may activate the expression of the may elicit positive effects on gene expression. The upregulated
genes encoding MYH11 (Gomez and Owens, 2012) and MYLK collagen genes, such as PCOLCE2 (Ulmasov et al., 2013),
(Yang et al., 2016), which are critical in transforming cells from a ADAMST4 (Lu et al., 2018), DES (Torricelli et al., 2016), and
contractile phenotype to a proliferative state for ECM production TPM1 (Huang et al., 2020), participate in ECM organization and
(Kimura et al., 2020). Elevated ECM production is a risk factor for collagen formation. Prolonged remodeling of the ECM and
developing fibrosis-related tissue damage (Karsdal et al., 2017; collagen formation can further lead to a profibrotic
Asano, 2018; Weiskirchen et al., 2019). phenotype—and even fibrosis-related tissue damage (Asano,
Downregulated genes in CRT of HFS susceptible patients 2018).
(HFS1 or HFS2/3 groups) indicated an overall suppressed
immune response. HLA-F can bind to ILT2, ILT4, resulting in
the presentation of antigens to the T cells; the HLA-F/ILT2/ILT4
Proposed Mechanism for the
trimer also serves as a ligand for receptors expressed on natural Chemotherapy-Induced Hand-Foot
killer (NK) cells (Lin and Yan, 2019). In parallel, downregulated Syndrome
IL-17A (Additional file 2: Supplementary Table S8) can reduce On the basis of our multi-omics data and published information
CXCL1 expression (Figure 6B), thereby preventing neutrophils on HFS, we proposed a mechanism for chemotherapy-induced
recruitment (Furue et al., 2020). CXCL1 is a secreted growth HFS (Figure 7D). Specifically, damage to tissues, including
factor that signals through the G-protein coupled receptor, CXC those harboring neurons and mast cells with essential neuro-
receptor 2. In HFS2/3, the decreased levels of immune cytokines immune functions, can initially cause localized changes to the
caused profound suppression of the immune system (Figure 6A). metabolome including a decrease in the nucleotide pool and an
Consistently, downregulated SLAMF6 suppresses NK-cell increase in spermine release. An acceleration of changes to the
activation (Ma et al., 2007), and downregulated ZAP70 metabolome may lead to a profibrotic phenotype characterized
suppresses TCR signaling response (Gaud et al., 2018). by the suppressed immune function, elevated cellular
SLAMF6 belongs to the CD2 subfamily of the proliferation, and tissue fibrosis. Once Capecitabine-based
immunoglobulin superfamily, which is expressed on NK, T, chemotherapy is administrated, it adds to the existing hazard
and B lymphocytes. ZAP70 belongs to the protein tyrosine factors and causes severe tissue damage (Tsai et al., 2020).
kinase family, and it plays roles in T-cell development and Finally, the accumulated molecular changes lead to severe
lymphocyte activation. The overall suppressed immune cellular proliferation and fibrosis of tissues, and ultimately
response was not expected, as the most widely accepted to HFS.
mechanism of HFS is the COX2 overexpression-mediated The resident profibrotic cells in organs can develop to
inflammation (Lou et al., 2016). We did find evidence myofibroblasts, which are the key players in the damage
suggesting that COX2 was activated, such as the reduced level progression related to fibrosis. The resident profibrotic cells
of DPA in plasma (DPA is a potent COX2 inhibitor) (Kaur et al., include epithelial cells from the skin and CRT (Weiskirchen
2011) and the elevated level of prostaglandin F3α (PGF3α). In our et al., 2019). Fibrosis is also the main characteristic of systemic
study, COX2 was not expressed in CRT (Additional file 2: sclerosis, damaging the skin and various internal organs (Asano,
Supplementary Table S9). Therefore, HFS treatments that 2018). This partially explained why the multi-omics variation in
focus on the suppression of the immune response may not CRT was closely related to HFS susceptibility. Based on the
have the expected benefits. similarity between skin where the HFS happened and CRT from
where the experimental tissue was acquired and screened, the
HFS-related metabolome in CRT was more likely a reflection or
Hand-Foot Syndrome-Related DNA an indicator of what was happening in the skin at a biomolecular
Methylation in Colorectal Tissue Favors a level. With the current data and knowledge, we could not further
Profibrotic Phenotype tell how the HFS-related metabolome affects skin. However,
The human genome contains 42 different collagen genes for 28 spermine, which was recognized as the most important HFS-
different types of collagens. Here we found that 25 collagen genes related metabolite in CRT, can cause overall DNA
Frontiers in Pharmacology | www.frontiersin.org 15 September 2021 | Volume 12 | Article 746910Li et al. Biomarkers for Chemotherapy-Induced Hand-Foot Syndrome
hypermethylation, especially on genes from collogen formation. cause myocardial infarction-related fibrosis (Yesilaltay et al.,
Spermine can also cause overall downregulated genes related to 2009). On the other hand, MIR130A promotes collagen
M2 macrophage activation and suppressed immune response. secretion, myofibroblast transformation through CYLD,
These biomolecular changes were important signs of systematic enhancing Akt activity (Zhang et al., 2019). The level of
fibrosis. Therefore, suppression of systematic fibrosis may MIR130A positively correlated with both skin and cardiac
provide an alternative treatment target in the prevention of HFS. fibrosis (Li et al., 2017). At last, mutation in PLEKHA7 is
negatively related to perivascular fibrosis in the heart and
kidney (Endres et al., 2014).
The major strengths of this study include the first use of
Prediction Models for metabolome and DNA methylation markers to predict HFS
Chemotherapy-Induced Hand-Foot susceptibility, various datasets, and the adjustments for
Syndrome potential confounding factors. However, our models also had
To assist clinical practice for CRC patients undergoing limitations. First, the sample size was relatively small. Second, the
capecitabine chemotherapy, we additionally developed prediction model for HFS2/3 patients is also of greater
prediction models for HFS. Samples of cellular mRNA are importance. Owing to the limited number of HFS2/3 patients
relatively difficult to preserve, and the use of mRNA for who were enrolled in our study; however, we were unable to
routine screening is relatively costly; moreover, produce a specific prediction model for HFS2/3 alone. Therefore,
models using biomarkers from other omics data also further validation promises better applicable results.
show good enough predictive abilities. Therefore, we
developed a set of prediction models only using
metabolome and DNA methylation data (Figure 8 and CONCLUSION
Additional file 2: Supplementary Table S5 and
Supplementary Table S6). In summary, our results demonstrated that a multi-omics
Considering the significance of spermine, we combined it with profibrotic phenotype was closely associated with
the three biomarkers, including N-octanoyl-d-sphingosine (C8- chemotherapy-induced HFS. On top of this, the
ceramide), O-phosphoethanolamine, adenylosuccinic acid into metabolome variation in CRT showed a tighter correlation
the CRT metabolome model, and a slight increase in AUROC in with HFS susceptibility than in plasma and urine. The
the validation set was shown (Figure 8B and Additional file 2: metabolome changes for each of matched plasma, urine,
Supplementary Table S6). Both C8-ceramide and and CRT in relation to HFS were characterized by chronic
O-phosphoethanolamine are implicated in sphingolipid tissue damage, which was indicated by reduced nucleotide
metabolism, the alternation of which plays different regulatory salvage, elevated spermine release, and increased production
functions in multiple cell events. Ceramides serve as a localized of endogenous cytotoxic metabolites. HFS-related
cytokines milieu to regulate inflammatory function at barrier transcriptome changes of CRT showed an overall
organs such as skin and their levels are directly related to disease suppressed inflammation profile but increased M2
severity (Toncic et al., 2020). Ceramides can also modulate the macrophage polarization. HFS-related DNA methylation of
serotonin release from mast cells (Ji et al., 2011). CRT presented gene-specific hypermethylation on genes
Adenylosuccinic acid participates in purine metabolism. In mainly for collagen formation. The hypermethylation was
line with biomarkers in the CRT metabolome, most of the plasma accumulated in the opensea and shore regions, which elicited
metabolite biomarkers, including PC[14:1(9Z)/24:1(15Z)], a positive effect on gene expression. Additionally, we
PC(35:2), PC(34:2), and cis-8,11,14,17-eicosatetraenoic acid are developed and validated models combining multiple
lipid metabolism-related, which suggested that patients biomarkers to predict HFS, with reasonably good
susceptible to HFS had a remarkable disturbed lipid discrimination. Our findings provide novel insights into
metabolism. In addition, an elevated level of dodecanoic acid the susceptible factors contributing to HFS, and advance a
plays roles in fatty acid biosynthesis. better understanding of the molecular mechanism underlying
For the urine prediction model, 4 potential biomarkers, HFS, which can promote the implementation of
including 4-pyridoxolactone, PA(27:6), glycodeoxycholic acid, individualized treatment against HFS. Nonetheless, further
and 5,6-dihydrothymine generally reflected different alterations studies based on large cohorts to verify our findings are
of VB6 metabolism, fatty acid and lipid metabolism, pyrimidine warranted.
metabolism.
All of the three DNA methylation biomarkers were associated
with the profibrotic phenotype. SMIM24 (previously termed DATA AVAILABILITY STATEMENT
C19orf77) is a member of the small integral membrane
protein family, the downregulation of which is related to The datasets presented in this study can be found in online
steatosis, glucose intolerance, inflammation, and fibrosis in repositories. The names of the repository/repositories and
high-fat diet-, high-fat-high-cholesterol diet-, and methionine- accession number(s) can be found below: https://www.ncbi.
choline-deficient diet feed mice (Song et al., 2021). SMIM24 has nlm.nih.gov/geo/, GSE171468; https://www.ncbi.nlm.nih.gov/
an important paralog PDZK1, the downregulation of which can geo/, GSE171550.
Frontiers in Pharmacology | www.frontiersin.org 16 September 2021 | Volume 12 | Article 746910You can also read