Specific Refractory Gold Flotation and Bio-Oxidation Products: Research Overview
←
→
Page content transcription
If your browser does not render page correctly, please read the page content below

minerals
Review
Specific Refractory Gold Flotation and Bio-Oxidation Products:
Research Overview
Richmond K. Asamoah

                                          Minerals and Resource Engineering, Future Industries Institute, University of South Australia, Mawson Lakes,
                                          SA 5095, Australia; richmond.asamoah@unisa.edu.au

                                          Abstract: This paper presents a research overview, reconciling key and useful case study findings,
                                          towards uncovering major causes of gold refractoriness and maximising extraction performance
                                          of specific gold flotation and bio-oxidation products. Through systematic investigation of the ore
                                          mineralogical and gold deportment properties, leaching mechanisms, and kinetic behaviour and
                                          pulp rheology, it was observed that the predominant cause of the poor extraction efficacy of one
                                          bio-oxidised product is the presence of recalcitrant sulphate minerals (e.g., jarosite and gypsum)
                                          produced during the oxidation process. This was followed by carbonaceous matter and other
                                          gangue minerals such as muscovite, quartz, and rutile. The underpining leaching mechanism and
                                          kinetics coupled with the pulp rheology were influenced by the feed mineralogy/chemistry, time,
                                          agitation/shear rate, interfacial chemistry, pH modifier type, and mechano-chemical activation. For
                                          instance, surface exposure of otherwise unavailable gold particles by mechano-chemical activation
                                          enhanced the gold leaching rate and yield. This work reflect the remarkable impact of subtle deposit
                                          feature changes on extraction performance.

                                          Keywords: refractory gold ores; ore mineralogy; secondary minerals; rheology and leaching kinetics;
                                          mechano-chemical activation


Citation: Asamoah, R.K. Specific
Refractory Gold Flotation and             1. Introduction
Bio-Oxidation Products: Research                The economic significance of gold to the development of several nations (e.g., Aus-
Overview. Minerals 2021, 11, 93.          tralia, South Africa, USA, China, Canada, and Ghana), owing to its coveted qualities and
https://doi.org/10.3390/min1101           unique applications, can be traced back to the dawn of civilization [1–6]. In a recent global
0093                                      gold mine reserve estimation [7], Australia hosts 16% of the world’s total 56,700 t gold
                                          (Figure 1) worth AUD$ 542.48 billion, at gold price of AUD$ 1690/oz. With record high
Received: 3 December 2020
                                          gold prices in 2020 (AUD$ 2670/oz), the 16% gold deposit represents a higher value of
Accepted: 13 January 2021
                                          about AUD$ 857.05 billion. A number of developing countries (e.g., Ghana), blessed with
Published: 19 January 2021
                                          gold deposits, have substantially achieved poverty alleviation by exploiting their gold
                                          reserves in an eco-friendly manner. Gold extraction continue to represent a major livelihood
Publisher’s Note: MDPI stays neutral
                                          and economic support in recent time.
with regard to jurisdictional claims in
                                                Currently, a greater percentage of gold is extracted from low grade, refractory gold
published maps and institutional affil-
                                          ores, following depletion of most high grade deposits [8]. Increasing complexity of these
iations.
                                          refractory ores warrants improvement in our fundamental and applied knowledge under-
                                          pinning sustainable, cost-effective, commercial gold extraction process and commodity
                                          production. Despite numerous reported studies on improved gold extraction (by cyanide
                                          leaching) from complex low grade ores [9–16], there is still a lack of fundamental knowl-
Copyright: © 2021 by the author.
                                          edge and understanding on the interplay between refractory ore-specific primary and
Licensee MDPI, Basel, Switzerland.
                                          secondary mineral phases, solution chemistry, and the particle-solution interfacial species,
This article is an open access article
                                          particle interactions, and chemical/electrochemical reactions which underpin the mech-
distributed under the terms and
                                          anisms and kinetics of the leaching process. How these factors interact synergistically
conditions of the Creative Commons
Attribution (CC BY) license (https://
                                          to produce fast kinetics and high gold recovery or antagonistically (e.g., low leach rate,
creativecommons.org/licenses/by/
                                          passivation/encapsulation, poor gold recovery, and high reagent consumption) during
4.0/).                                    alkaline cyanide leaching process is as yet not clearly established.

Minerals 2021, 11, 93. https://doi.org/10.3390/min11010093                                                  https://www.mdpi.com/journal/minerals
Minerals 2021, 11,
Minerals 2021, 11, 93
                   x FOR PEER REVIEW                                                                                                                   22 of
                                                                                                                                                          of 14
                                                                                                                                                             13

      Figure 1. Global gold mine reserves in 2015. Total mine gold reserve was 56,700 metric tons whilst total monetary estimate
      was AUD$ 3380.06 billion [7].

                                          Currently, a greater percentage of gold is extracted from low grade, refractory gold
                                    ores, following depletion of most high grade deposits [8]. Increasing complexity of these
                                    refractory ores warrants improvement in our fundamental and applied knowledge un-
                                    derpinning sustainable, cost-effective, commercial gold extraction process and commod-
                                    ity production. Despite numerous reported studies on improved gold extraction (by cya-
                                    nide leaching) from complex low grade ores [9–16], there is still a lack of fundamental
                                    knowledge and understanding on the interplay between refractory ore-specific primary
                                    and secondary mineral phases, solution chemistry, and the particle-solution interfacial
                                    species, particle interactions, and chemical/electrochemical reactions which underpin the
                                    mechanisms and kinetics of the leaching process. How these factors interact synergisti-
                                    cally to produce fast kinetics and high gold recovery or antagonistically (e.g., low leach
     Figure 1. Global gold mine reserves     in 2015. Total
                                                        Total mine gold reserve
                                    rate, passivation/encapsulation,
                                                                                      was 56,700 metric
                                                                                 poor gold recovery, tons
                                                                                                                   whilst total monetary estimate
                                                                                                              and high reagent consumption)               dur-
     was AUD$
     was AUD$ 3380.06
                 3380.06 billion
                         billion [7].
                                 [7].
                                    ing alkaline cyanide leaching process is as yet not clearly established.
                                          Of relevance
                                         Currently,          to the present
                                                         a greater     percentagework is a technological          conundrum         associated      with gold
                                         Of relevance       to the present      workofisgold      is extractedconundrum
                                                                                            a technological        from low grade,         refractory
                                                                                                                                   associated     with gold
                                    extraction
                                  ores,   following
                                   extraction      from    two
                                                  fromdepletion   biologically
                                                          two biologically         oxidised
                                                                        of most oxidised
                                                                                   high grade   (BIOX   ®
                                                                                                         ®) flotation concentrates obtained from
                                                                                                   deposits
                                                                                               (BIOX            [8]. Increasing
                                                                                                          ) flotation               complexity
                                                                                                                         concentrates       obtained of these
                                                                                                                                                        from
                                    the same
                                   the  same low
                                  refractory      oresgrade
                                                 low   grade    (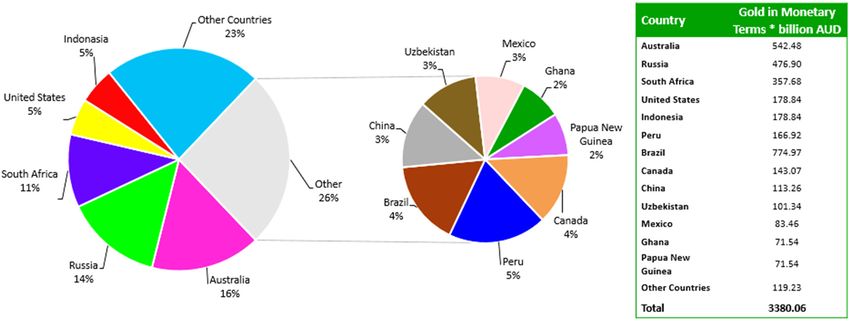
Minerals 2021, 11, 93                                                                                              3 of 14

                             In our previous papers, the ore mineralogical and physico-chemical characteristics,
                        gold mineralisation and deportment in host gangue minerals, effect of selected process
                        variables on the kinetics and mechanism of alkaline cyanide leaching and temporal rheo-
                        logical behaviour, and refractory attenuation capability of mechano-chemical activation
                        technique have been investigated, attempting to address critical questions and aspects of
                        poor process performance [17–23]. This paper, therefore, aims at
                        1.   Reconciling and discussing all the key findings emerging from the comprehensive,
                             investigations presented;
                        2.   Determining the overall impact of process variables on the leaching behaviour and
                             rheological behaviour; and
                        3.   Summarise the different mechanisms and kinetics which underpin the leaching be-
                             haviour with links to extant literature.
                             This provides overarching discussions, highlighting how the new knowledge and
                        greater understanding gleaned may be useful in designing ore mineralogy-specific, cus-
                        tomised approach and strategies for improved, cost-effective gold extraction from complex,
                        refractory, sulphidic ores.

                        2. Ore Mineralogy and Physico-Chemistry
                              Ore mineralogy coupled with physico-chemical characteristics play a critical role
                        in their response to mineral processing and extraction techniques. The comprehensive
                        mineralogy and physico-chemistry of the two different gold ores alongside their flotation
                        and bio-oxidation products have been investigated. It was evident that the two gold
                        ores comprise common minerals such as quartz, chamosite, albite, ephesite, clinozoisite,
                        larnite, illite, muscovite, rutile, pyrite, arsenopyrite, apatite, dolomite, and siderite. The key
                        difference observed of the two ores was the variation in the percentages of some common
                        minerals.
                              The characteristic differences between the two ores reflected two types of flotation
                        concentrates, uniquely distinguished by two different minerals. Arsenopyrite, muscovite,
                        and pyrite were upgraded for the two flotation concentrates to different extents. One
                        concentrate was predominated by dolomite (hereafter referred to as dolomite-containing
                        flotation concentrate—DC) whilst the other was predominated by apatite (hereafter re-
                        ferred to as apatite-containing flotation concentrate—AC). Both dolomite and apatite were
                        initially present in the two flotation feed ores, however, their variable, complex associations
                        with other hydrophobic minerals defined their rejection or inclusion in the flotation concen-
                        trate. DC comprised more amount of hydrophobic, sulphide minerals than the AC which
                        contained higher ephesite, illite, and albite as well. Quantitative Evaluation of Minerals by
                        Scanning Electron Microscopy (QEMSCAN) investigation revealed smaller mineral grain
                        size in AC compared with DC (Table 1). This observation agrees with the different mineral
                        response of the two refractory gold ores to flotation.
                              Subsequent to bio-oxidation, AC yielded jarosite-containing bio-oxidation prod-
                        uct (hereafter referred to as JC) with greater bassanite content whereas DC produced
                        jarosite-free bio-oxidation product (hereafter referred to as JF) with bassanite and gypsum
                        present in lower and higher amounts, respectively. This result agrees with some previous
                        works [24–26] which showed that phosphate ions facilitate precipitation of jarosite at the
                        typical bio-oxidation conditions (e.g., pH 1.0–1.8). Although phosphorus are required by
                        the chemolithothrophic bacteria for oxidising the flotation concentrates, the amount added
                        by the apatite-bearing flotation concentrates (7.3 kg/t) are by far more than prescribed
                        BIOMIN rates of 0.9 kg/t. Table 2 shows the potassium and sodium content before and after
                        bio-oxidation. Evidently, potassium and sodium was concentrated in the bio-oxidation
                        products with little difference between JF and JC in terms of percentage of upgrade. A
                        further studies will characterise the jarosite found in JC to determine whether it is H, Na, K
                        or NH4 .
Minerals 2021, 11, 93                                                                                                                                                                    4 of 14

      Table 1. Mineral mass (%) and average grain size (µm) of studied flotation and bio-oxidation products using QEMSCAN. Modified after Asamoah et al, 2019 [1]. DC—Dolomite containing
      flotation concentrate, AC—Apatite-containing flotation concentrate, JF—Jarosite-free bio-oxidised product, JC—Jarosite-containing bio-oxidised product.

                                                                 Mineral Mass (%)                                                          Average Grain Size (µm)
           Mineral Phases
                                           DC                  AC                  JF                 JC                 DC                 AC                  JF                 JC
              Pyrite                       36.0                24.2               0.7                 1.0               35.1                13.7               13.9               6.4
          Arsenopyrite                      7.5                 5.0                0.1                0.1               11.2                 8.6               6.9                 5.9
           Pyrrhotite                       1.1                 0.3                0.0                0.1                4.5                 4.6               2.9                 3.1
        Other Sulphides                     0.2                 0.2               0.2                 0.4                8.0                 7.1                3.9               4.9
             Quartz                        17.1                27.3               35.7               33.3               16.2                 9.8               9.1                10.4
            Feldspar                       4.0                  4.6               4.9                 5.1               13.2                8.4                8.7                8.8
    Muscovite/Illite/Biotite               20.2                23.2               32.8               32.6               15.3                 8.2                7.4               9.1
    Other silicates (chlorites,
                                            6.2                7.9                7.1                 5.7                4.3                4.7                3.9                 3.7
  amphibole, kaolinite, pyroxene)
            Dolomite                        5.2                0.8                 0.0                0.0               14.0                9.6                 3.7                5.5
       Other Carbonates                     0.1                0.1                 0.1                0.2               4.6                 4.2                 5.8                5.2
             Apatite                        0.1                3.8                0.0                 0.1                7.9                7.4                 5.5               6.4
        Rutile/Ilmenite                     1.2                1.4                 2.6                2.0                7.1                7.7                 7.2                6.8
  Magnetite/Hematite/Goethite               0.5                0.7                2.5                2.2                12.0                8.1                 6.6               10.1
             Jarosite                        -                  -                  0.0                5.5                 -                  -                  2.9                3.2
           Anhydrite                         -                  -                 13.1               11.5                 -                  -                 20.9               18.6
              Others                        0.6                0.5                 0.2                0.2                4.8                5.0                 3.3                3.4
Minerals 2021, 11, 93 5 of 14
Table 2. Potassium and sodium content before and after bio-oxidation for samples AC and DC. 95%
Confidence Interval.
Elements Unit DC AC JF JC
K 1.2 1.6 2.1 2.0
%
Na 0.8 1.0 1.3 1.6
The percent sulphide–sulphur oxidation for JF was greater than that of JC. The mineral
association results made evident by photomicrographs showed greater surface coating
of unreacted and partially reacted sulphide minerals in JC than JF. The surface coating
behaviour of the jarosite minerals attenuated the liberation of gold after the bio-oxidation
for subsequent alkaline cyanide leaching. The observations were consistent with the
sulphur speciation data.
The bulk chemistry data also showed that the concentration of gold in the refractory
Minerals 2021, 11, x FOR PEER REVIEW
gold ore, before flotation, producing DC (~2.3 g/t) was more than that yielding5 of AC13
(~1.3 g/t). The gold grade was increased by ~14 and ~15 times after flotation for DC
and AC, respectively. Breakdown in the mineral structures after bio-oxidation led to
~1.4
creasetimes increase
in the in theofgold
gold grade bothgrade
JF andofJC.
both JF andchemistry
Surface JC. Surface chemistry investigations
investigations by EDTA ex-
by EDTA extraction showed that jarosite minerals coated the surfaces
traction showed that jarosite minerals coated the surfaces of both soluble of both soluble
and and
insoluble
insoluble[20].
minerals minerals [20]. Forupon
For instance, instance, uponthe
extracting extracting the EDTA iron
EDTA extractable extractable
species iron
whichspecies
were
which were
insoluble insoluble
in water only,inother
water only, mineral
soluble other soluble
phasesmineral phases were
(e.g., gypsum) (e.g., dissolved.
gypsum) werePho-
dissolved. Photomicrographs
tomicrographs showing complex showing complex
association association
between between
jarosite jarositeconfirmed
and gypsum and gypsum the
confirmed the EDTA results [20]. Figure 3 shows a schematic diagram of
EDTA results [20]. Figure 3 shows a schematic diagram of the influential role of jarositethe influential
role of
and jarositefollowing
gypsum and gypsum following bio-oxidation.
bio-oxidation. Evidently,
Evidently, subtle subtle
variations in variations in the ore
the ore mineral oc-
mineral occurrence and characteristics defined the mineral processing and
currence and characteristics defined the mineral processing and pre-treatment product pre-treatment
product features
features which underpin
which underpin downstream downstream gold extraction
gold extraction performance.
performance.
Figure 3. Schematic diagram showing the influential role of secondary sulphate minerals (gypsum, jarosite) formed after
bio-oxidation on gangue minerals, auriferous
auriferous sulphides,
sulphides, and
and gold
gold grains.
grains.
Carbon speciation
Carbon speciation ofof the
the two
two ore
ore types,
types, before
before and
and after
after flotation
flotation and
and bio-oxidation,
bio-oxidation,
showed presence of graphitic, organic, and other inorganic (e.g., carbonate) carbons.
showed presence of graphitic, organic, and other inorganic (e.g., carbonate) carbons. The
The
total carbon content also increased after flotation of the comminuted
total carbon content also increased after flotation of the comminuted ores. Although ores. Although
sta-
statistically
tistically thethe
samesame graphitic
graphitic content
content wasnoted
was notedininthetheflotation
flotationconcentrates,
concentrates, the
the graphitic
graphitic
content after
content after bio-oxidation
bio-oxidationwere weremore
moreininJFJF
compared
compared with JC.JC.
with On Onthe the
contrary, the organic
contrary, the or-
carbon
ganic content
carbon of JC of
content wasJCgreater than that
was greater thanof JF, of
that suggesting that the
JF, suggesting thatorganic carbon
the organic was
carbon
acid-soluble. Studies on the preg-robbing capacity of the bio-oxidation
was acid-soluble. Studies on the preg-robbing capacity of the bio-oxidation products products showed
showed greater values for JF than JC. This was confirmed by spectroscopic studies which
also showed greater Raman ratio for JF (1.1) than JC (0.8). The higher the Raman ratio, the
greater the gold preg-robbing capability of the ore. The lower gold absorption capability
of the graphitic carbon in JC may be due to possible surface coatings on adsorption sites.
The flotation concentrates and bio-oxidised products’ particle size distribution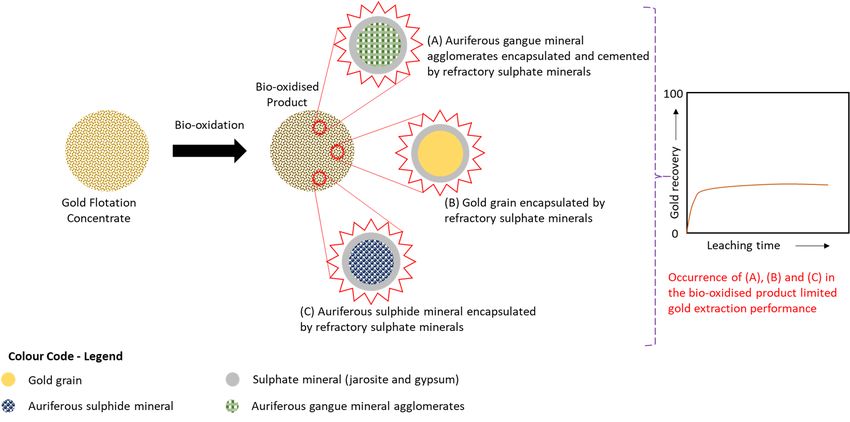
Minerals 2021, 11, 93                                                                                           6 of 14

                        greater values for JF than JC. This was confirmed by spectroscopic studies which also
                        showed greater Raman ratio for JF (1.1) than JC (0.8). The higher the Raman ratio, the
                        greater the gold preg-robbing capability of the ore. The lower gold absorption capability of
                        the graphitic carbon in JC may be due to possible surface coatings on adsorption sites.
                              The flotation concentrates and bio-oxidised products’ particle size distribution showed
                        two different trends after bio-oxidation. Whilst the DC and AC showed particle size distri-
                        bution, the JF and JC showed finer and coarser particle sizes, respectively. The breakdown
                        of mineral structure during bio-oxidation suggests reduction in the particle size as observed
                        between DC and JF. The increase in the particle size after bio-oxidation of AC was due to
                        the formation of jarosite minerals which facilitated ore particle agglomeration [27,28].
                              In addition, the particle specific surface area of AC was greater than that of DC.
                        These data indicated greater porosity of the AC than DC. After bio-oxidation, however,
                        the formation of jarosite minerals on the surfaces of porous gangue minerals and the
                        attenuation of sulphide oxidation led to a lower specific surface area in JC compared with
                        the flotation concentrate feed and JF, contrary to expectations.
                              It is worth mentioning that the processing plant from which the samples were derived
                        initially treat an apatite-free flotation concentrate (e.g., dolomite-containing concentrates—
                        DC) and hence no jarosite is observed in their bio-oxidised products. Emergence of the
                        complex associated, AC feed ores under equal processing strategies yielded deleterious
                        jarosite phases, impacting the bio-oxidised product mineralogy, and physico-chemistry.

                        3. Gold Mineralisation and Deportment
                             The mine that provided the samples nominally observes that the jarosite-bearing bio-
                        oxidised product (~70 wt.%) invariably display lower gold recovery relative to the jarosite-
                        free bio-oxidised product (~90 wt.%) after 24 h of carbon-in-leach. The mineralogical and
                        physico-chemical characteristics showed differences in the products following flotation
                        and bio-oxidation which could be responsible for gold refractoriness and the lower gold
                        recovery noted for JC. It was, however, crucial to obtain a quantitative information on
                        the percent of cyanide-insusceptible gold for extraction due to a given ore-specific cause
                        of refractoriness.
                             Both visible and invisible gold occurred in the flotation concentrates and bio-oxidation
                        products. Invisible gold particles include solid solution and nano-sized gold grain in
                        gangue mineral hosts such as arsenopyrite and pyrite. The average visible gold grain size
                        and distribution data of the flotation concentrates, and bio-oxidation products, showed
                        presence of coarser gold grains in AC and JF compared with DC and JF, respectively. Sample
                        JF showed gold grain size range of 0.2 to 20.7 µm whilst that of JC was 0.1 to 30.6 µm. This
                        observation also makes evident the key differences between the two refractory gold ores.
                        Although they both originate from a common deposit, the gold grain sizes are significantly
                        different and hence may display different leaching trends even if all the gold particles were
                        liberated and available.
                             Liberation and locking statistics data from QEMSCAN analysis showed that all the
                        gold particles in the flotation concentrates displayed liberation
Minerals 2021, 11, 93                                                                                            7 of 14

                        exist in JC cannot be identified by QEMSCAN. All such particles will be therefore reported
                        as liberated.
                              The QEMSCAN investigation revealed that visible gold particles found in DC were
                        associated with arsenopyrite, pyrrhotite, muscovite, galena, pyrite, chalcocite, digenite,
                        sphalerite, illite, biotite, feldspar, magnetite, geothite hematite, and rutile. AC also showed
                        similar gold associations coupled with gold-quartz association. Overall, the two flotation
                        concentrates showed greater association between the visible gold particles and arsenopyrite.
                        Unlike the flotation concentrates, greater amount of the visible gold particles, observed in
                        JF, were in association with pyrite whilst those of JC were in association with arsenopyrite.
                              The greater gold-pyrite association in JF, despite the higher gold-arsenopyrite associa-
                        tion in its corresponding flotation concentrate (DC) is consistent with the literature [29]. For
                        instance, it is well known that bio-oxidation is more effective in oxidising arsenopyrite min-
                        erals which display ease for oxidation by the chemolithotrophic bacteria. On the contrary,
                        the observed greater gold-arsenopyrite association in JC confirms the sulphur speciation
                        results which showed poor sulphide-sulphur oxidation evidenced by the surface coated,
                        sulphide mineral, and photomicrographs [20]. Poor arsenopyrite oxidation prevented the
                        release of gold particles in their unoxidised mineral matrix.
                              Furthermore, gold particles were hosted by agglomerates of gangue minerals (e.g., pyrite,
                        monazite, muscovite, and quartz) that were noted in the jarosite-bearing bio-oxidised prod-
                        uct [21]. Backscattered electron (BSE)/energy dispersive X-ray (EDX) investigations revealed
                        that some visible gold were encapsulated by sulphate minerals in the bio-oxidised products.
                        Whilst gold encapsulation by gypsum and jarosite were noticeable in JC, only gypsum en-
                        capsulation of gold was noticeable in JF. The observed gold coatings thickness was variable;
                        however, finer surface coatings were noticeable in JC. In addition, the invisible gold were
                        mostly hosted by arsenopyrite and arsenian pyrite minerals. The solid-solution gold was
                        more pronounced than the nano-sized gold particles that were hosted by the gangue
                        minerals. Arsenopyrite minerals hosted majority of the invisible gold grains. The gold
                        concentration in the arsenian pyrite was defined by the concentration of arsenic. As the
                        arsenic content increased in the pyrite mineral, so did the invisible gold content. The
                        invisible gold content of DC was more pronounced compared with AC. This further shows
                        that most of the gold particles that were liberated from DC after bio-oxidation (JF) were
                        invisible that cannot be detected by the QEMSCAN method of analysis. These complex
                        associations and causes of refractoriness warranted the study of gold deportment per
                        mineral group in the flotation concentrates and the bio-oxidised products.
                              Gold deportment studies, using diagnostic leaching, showed that after cyanidation of
                        the flotation concentrates and bio-oxidation products, ~79 and ~77 wt.% of gold in DC and
                        AC were, respectively, unextractable. On the other hand, ~31 wt.% and ~78 wt.% of gold in
                        JF and JC were unrecovered by cyanide leaching. The sulphide minerals are the major cause
                        of refractoriness in the flotation concentrates. For the bio-oxidation products, different
                        dominant refractory causing components were observed between the two samples. JF
                        showed carbonacoues matter as the major cause of refractoriness whilst JC showed sulphate
                        minerals as the major cause of refractoriness.
                              JF and JC comprised both gypsym and bassanite minerals; however, the presence of
                        jarosite was exclusive to AC only. The negative secondary sulphate mineral impact could
                        therefore be ascribed to the jarosite minerals that were associated with JC only. The jarosite
                        minerals may have encapsulated the gold particles completely or partially where other
                        gangue minerals are also in association with gold. Partial removal of the jarosite minerals
                        could enhance galvanic leaching of gold particles that are in association with minerals with
                        higher rest potentials (e.g., galena).
                              Although the refractory causing behaviour in JF, where the major cause of refrac-
                        toriness is the presence of carbonaceous matter, is well documented in literature, those
                        associated with JC, showing secondary sulphate minerals such as jarosite as the main
                        cause of refractoriness is now known. Figure 4 illustrates the various gold occurrences in
                        the investigated flotation concentrates and bio-oxidation products. The gold extraction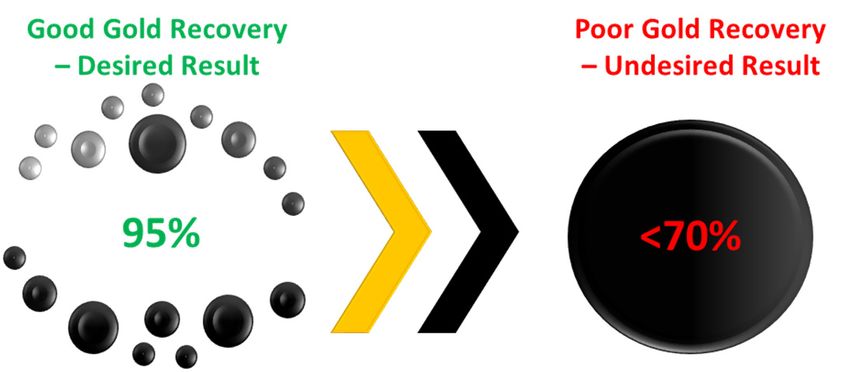
Minerals 2021, 11, 93 8 of 14
Minerals 2021, 11, x FOR PEER REVIEW
limiting 8 of 13
potential of the jarosite phases could reflect significant losses in mine productivity
and sustainability.
Figure
Figure 4. Illustration
4. Illustration of the
of the occurrence
occurrence of gold
of gold in the
in the investigated
investigated flotation
flotation concentrates
concentrates andand bio-oxidation
bio-oxidation products.
products.
4.
4. Effect
Effect ofof Process
Process Variables
Variables on on Cyanide
Cyanide Leaching
Leaching Mechanism
Mechanism and and Kinetics
Kinetics
The effect of
The effect of process
processvariables
variables(e.g.,
(e.g.,mineralogy,
mineralogy, time,
time, agitation
agitation rate,
rate, andand
pHpH modi-
modifier)
fier) on the mechanism and kinetics of batch isothermal leaching
on the mechanism and kinetics of batch isothermal leaching cyanide susceptible gold from cyanide susceptible gold
from the flotation concentrates and bio-oxidised products
the flotation concentrates and bio-oxidised products was investigated. was investigated.
Cyanidation
Cyanidation of of the
the flotation
flotation concentrates
concentrates did did not show noticeable
not show noticeable variation
variation in feed
in feed
ore
ore mineralogy
mineralogy and and chemistry
chemistry (except
(except gold
gold content),
content), irrespective
irrespective of of the
the pHpH conditioner
conditioner
type.
type. In In case
case ofof the
the bio-oxidised
bio-oxidised products, however, pronounced mineralogy changes
were evident
evident when causticsoda
when caustic sodawaswasused.
used. Bassanite
Bassaniteandandgypsum
gypsum minerals which
minerals are usu-
which are
ally
usually soluble in aqueous solution leached out from JF following 8 h of cyanidation using
soluble in aqueous solution leached out from JF following 8 h of cyanidation
sodium
sodium hydroxide as pH conditioner. When quicklime was deployed, only gypsum was
dissolved from JF following 8 h of cyanidation. The results showed gypsum as refractory
in JC alongside jarosite. This observation is consistent with the complex jarosite–gypsum
association observed in the product.
In
In addition
addition to shear-induced breakage of gangue mineral agglomerates which was
more evident
more evident in inthe
thejarosite-bearing
jarosite-bearingbio-oxidised
bio-oxidisedproduct,
product,the the particle
particle size
size distribution
distribution of
of all
all leachleach
feedsfeeds
andand ripiosripios
were were substantially
substantially the same.
the same. Brunner-Emmett-Teller
Brunner-Emmett-Teller (BET)(BET)
spe-
specific
cific surface
surface areaarea results
results were were
the the
samesamefor for
the the flotation
flotation concentrates,
concentrates, irrespective
irrespective of
of the
the pH
pH conditioner
conditioner used usedandand their
their variable
variable mineralogy.On
mineralogy. Onthethecontrary,
contrary, the
the bio-oxidation
products showed
showed increase in specific surface area when sodium hydroxide was used in
conditioning the pH. For quicklime conditioned pulps, no variations were noted between
the BET
the BET surface
surface area
area ofof the
the leach
leach feeds
feeds and
and ripios.
ripios.
Ore mineralogy,
Ore mineralogy, leaching
leaching time, and pH
time, and pH modifier-dependent
modifier-dependent gold gold leaching
leaching behaviour
behaviour
was observed
was observed during
duringcyanidation
cyanidationofofthe theflotation
flotation concentrates
concentrates and bio-oxidation
and bio-oxidation products.
prod-
Within the initial 30 min of leaching, relatively rapid gold leaching
ucts. Within the initial 30 min of leaching, relatively rapid gold leaching rates were noted rates were noted for
the flotation concentrates and bio-oxidised products, irrespective
for the flotation concentrates and bio-oxidised products, irrespective of pH conditioner of pH conditioner type
and feed
type ore mineralogy.
and feed ore mineralogy. The first
The 30 min
first 30 leaching
min leachingratesrates
for flotation concentrates
for flotation was
concentrates
approximately six orders of magnitude lesser compared with
was approximately six orders of magnitude lesser compared with leaching rates reported leaching rates reported for
some sulphide ores (Table 3). Similarly, about three to four orders
for some sulphide ores (Table 3). Similarly, about three to four orders of magnitude lesser of magnitude lesser
leaching rates
leaching rates were
were noticeable
noticeable for for the
the bio-oxidised
bio-oxidised products
products whenwhen compared
compared with with roast-
roast-
oxidised gold
oxidised gold ores. ores.
Although the overall gold leaching rates and yield from the flotation concentrates
and bio-oxidised products reduced with modifying the pulp using quicklime in place of
sodium hydroxide, there are some pulp conditions, defined by the ore mineralogy/chem-
istry, which favours the initial leaching rates (e.g., within 30 min) of quicklime modifiedMinerals 2021, 11, 93 9 of 14
Table 3. Gold leaching rate comparison for selected studies.
Gold Leaching Rate
Reference Agitation Rate (rpm) pH Modifier Leaching Time (min) Gold Sample
(mol·m−2 ·s−1 )
Cathro and Koch [30] 5.52 × 10⁻⁵ - - - Pure gold
Lorenzen [31] 6.27 × 10⁻⁶ Not specified Caustic potash 0–150 Pure gold
Aghamirian and Yen [32] 8.50 × 10⁻⁶ 500 Caustic soda 0–140 Pure gold
Dai and Jeffrey [33] 5.6 × 10⁻⁵ 300 Caustic soda 0–180 Pure gold
Azizi et. al., [34] 6.6 × 10⁻⁶ 500 Caustic soda 0–60 Sulphide gold ore
Azizi et. al., [34] 2.16 × 10⁻⁵ 500 Caustic soda 0–60 Electro-oxidised gold ore
Bas et. al., [35] 5.3 × 10⁻⁸ 100 Caustic soda 0–180 Roast-oxidised gold ore
3.34 × 10⁻¹² 600
Caustic soda Dolomite-bearing flotation concentrate
3.52 × 10⁻¹² 1000
1.02 × 10⁻¹² 600 Quicklime
1.28 × 10⁻¹² 600 Apatite-bearing flotation concentrate
Caustic soda
1.35 × 10⁻¹² 1000
Asamoah et. al., [17] 8.13 × 10⁻¹² 600 Quicklime 0–30
8.10 × 10⁻¹² 600 Jarosite-free bio-oxidised product
Caustic soda
1.18 × 10⁻¹¹ 1000
3.62 × 10⁻¹² 600 Quicklime
2.02 × 10⁻¹² 600 Jarosite-bearing bio-oxidised product
Caustic soda
8.03 × 10⁻¹² 1000Minerals 2021, 11, 93 10 of 14
Although the overall gold leaching rates and yield from the flotation concentrates and
bio-oxidised products reduced with modifying the pulp using quicklime in place of sodium
hydroxide, there are some pulp conditions, defined by the ore mineralogy/chemistry,
which favours the initial leaching rates (e.g., within 30 min) of quicklime modified pulps.
This observation is more noticeable for JC. It was evident that within the initial 30 min,
positive redox potentials occurred in the quicklime modified pulps whilst negative redox
potential was observed in the sodium hydroxide modified pulp for the jarosite-bearing
bio-oxidised product. The positive redox potential enhanced the gold leaching rate, and
hence the observed higher leaching rates for the quicklime relative to sodium hydroxide.
Calcium-oxide species deposition on pure gold particle was also noticeable in the quicklime
conditioned pulps.
Furthermore, higher agitation rates did not have a significant effect on the gold
leaching behaviour of the flotation concentrate. On the contrary, the leaching rates of
the bio-oxidised products improved with higher agitation rates. The lack of influence of
agitation rate on the flotation concentrate leaching behaviour suggests that the major rate
determining step did not involve volume diffusion of lixiviant and reaction products to,
and from the reaction sites, respectively. For the bio-oxidised products, however, diffusion
of lixiviant and reaction products within porous layers which evolved around the gold
containing minerals played a very key role in the leaching kinetics.
Modelling of the cyanidation mechanism and kinetics revealed that the flotation
concentrates was chemical reaction controlled, shrinking core model whilst the bio-oxidised
products followed diffusion through porous layer controlled, shrinking core model, both
in a two stage manner. The two stage best-fit manner is ascribed to the initial rapid
cyanidation of liberated gold followed by latter slow leaching of more refractory gold
minerals. Good correlation of the predicted and actual gold recovery confirmed the model
adequacy in predicting the gold leaching behaviour.
5. Temporal Rheological Behaviour: Effect of Mineralogy and
Pulp-Interfacial Chemistry
The effect of mineralogy and pulp chemistry coupled with interfacial in rheological
behaviour of the flotation concentrates and bio-oxidation products during cyanidation has
been investigated. It was evident that variation in the mineralogy, interfacial chemistry
and pulp chemistry played a subtle role on the rheology of the flotation concentrates. In
addition, the flotation concentrates displayed a time-independent rheological behaviour.
For the bio-oxidised products, ore mineralogy, physiology, pulp chemistry (pH modifier
type), interfacial chemistry, and time-based rheological behaviour was noticeable.
In case of sodium hydroxide conditioned, JF pulps, reduction in rheology was ob-
served for the first 60 min followed by accentuation of the pulp rheology to the initial state.
For JC, on the other hand, weakening of the pulp rheology was generally observed without
reverting to initial state at the end of the experiment. The continuous weakening in the
pulp rheology of JC was attributed to its physiological nature. For instance, disintegration
of the gangue mineral agglomerates, as evidenced by the particle size mean diameter,
weakened the inter-particle attractive forces.
Generally, introduction of calcium ions in the form of quicklime displayed significant
impact on the interfacial chemistry and pulp rheology. Interfacial chemical studies revealed
that using quicklime rather than sodium hydroxide fostered particle charge reversal and
screening as a result of the electropositive, hydrolysed calcium species adsorption together
with Ca(OH)2 0 surface nucleation. This observation was consistent with the Ca-O coating
on pure gold substrate. The magnitude of the calcium species, zeta potential screening
action was also defined by the ore mineralogy.
The metal ions-mediated shear rheology enhancement is attributed to the Ca(II) ion
specific adsorption onto particles. These adsorbed ions and/or their hydrolysis products
which partially or incompletely cover the surfaces of particles, enhance the interparti-
cle attraction. A combination of non-DLVO attractive force mechanisms, defining the
observation, may be the major cause of the observed poor handleability (Figure 5).O coating on pure gold substrate. The magnitude of the calcium species, zeta potential
screening action was also defined by the ore mineralogy.
The metal ions-mediated shear rheology enhancement is attributed to the Ca(II) ion
specific adsorption onto particles. These adsorbed ions and/or their hydrolysis products
which partially or incompletely cover the surfaces of particles, enhance the interparticle
Minerals 2021, 11, 93
attraction. A combination of non-DLVO attractive force mechanisms, defining the 11 of 14
obser-
vation, may be the major cause of the observed poor handleability (Figure 5).
Figure 5. Illustration of the effect of pH modifier type on the particle-particle interaction during cyanidation.
Figure 5. Illustration of the effect of pH modifier type on the particle-particle interaction during cyanidation.
6. Mechano-Chemical
6. Mechano-Chemical Activation
Activation of of Bio-Oxidation
Bio-Oxidation Product:
Product: Leaching
Leaching Behaviour
Behaviour
Mechano-chemical activation
Mechano-chemical activation ofof the
the more
more refractory
refractory jarosite-bearing
jarosite-bearing bio-oxidised
bio-oxidised
product showed notable particle size reduction and corresponding
product showed notable particle size reduction and corresponding increase in BET increase in BET spe-
specific
cific surface area. Greater activation parameters (milling time, milling
surface area. Greater activation parameters (milling time, milling speed, and ball to speed, and ball to
pulp ratio) magnitudes further lowered the particle size whilst increasing
pulp ratio) magnitudes further lowered the particle size whilst increasing the specific the specific sur-
face areaarea
surface andand
relative amorphous
relative amorphouscontent. Refractory
content. gypsum
Refractory minerals
gypsum in the bio-oxidised
minerals in the bio-
product became
oxidised productsoluble
becamefollowing mechano-chemical
soluble following activation.activation.
mechano-chemical On the other Onhand, por-
the other
tions ofportions
hand, rutile, jarosite,
of rutile,goethite,
jarosite,quartz, albite,
goethite, chamosite,
quartz, albite, and ephesiteand
chamosite, were transformed
ephesite were
to amorphous.
transformed Furthermore,
to amorphous. gangue mineral
Furthermore, gangue agglomerates, present inpresent
mineral agglomerates, JC, were disinte-
in JC, were
grated with the
disintegrated level
with theoflevel
breakage increasing
of breakage with the
increasing mechanical
with stress deployed.
the mechanical Leach-
stress deployed.
ing behaviour
Leaching of theofactivated
behaviour feedsfeeds
the activated showed an increased
showed in the
an increased ingold leaching
the gold ratesrates
leaching and
Minerals 2021, 11, x FOR PEER REVIEW
yield.
and Overall,
yield. ~1.8~1.8
Overall, timestimeshigher
highergold recovery,
gold recovery,following
following2424hhleaching
leachingof the 2011min
of the of 13
min
mechano-chemically activated
mechano-chemically activated product,
product, was
was observed
observed toto be
be maximum
maximum yield
yield(Figure
(Figure6).6).
Furthermore, it was evident that the increase in gold leaching rate and recovery fol-
lowing mechano-chemical activation was independent on excessive increase in mechani-
cal stress leading to very small particle sizes, high BET surface area, and mineral disor-
dering. On the contrary, the increase in gold leaching rate and recovery was defined by
the disintegration of gold-gangue mineral agglomerates, surface cleaning of passivated
gold particles and pore formation enabling gold site access within gangue minerals (Figure 7).
Figure 6.
Figure 6. As-received
As-received(JC)
(JC)and mechano-chemically
and mechano-chemically activated JC gold
activated leaching
JC gold behaviour
leaching as a func-
behaviour as a
tion of time. The mechano-chemically activated samples include those obtained from 5
function of time. The mechano-chemically activated samples include those obtained from 5 min min (MT1)
and 20and
(MT1) min20(MT2) milling
min (MT2) time; 600
milling rpm
time; 600(MS1) and 800
rpm (MS1) andrpm
800(MS2) milling
rpm (MS2) speed;
milling and ball
speed; andto pulp
ball to
ratio of 5:1 (BR1) and 10:1 (BR2). For a given experiment, all other parameters are kept constant as
pulp ratio of 5:1 (BR1) and 10:1 (BR2). For a given experiment, all other parameters are kept constant
follows: milling time—10 min; milling speed—1000 rpm; and ball to pulp ratio—2:1.
as follows: milling time—10 min; milling speed—1000 rpm; and ball to pulp ratio—2:1.
Furthermore, it was evident that the increase in gold leaching rate and recovery fol-
lowing mechano-chemical activation was independent on excessive increase in mechanical
stress leading to very small particle sizes, high BET surface area, and mineral disordering.Minerals 2021, 11, 93 12 of 14
Figure 6. As-received (JC) and mechano-chemically activated JC gold leaching behaviour as a func-
tion of time. The mechano-chemically activated samples include those obtained from 5 min (MT1)
On the contrary, the increase in gold leaching rate and recovery was defined by the disinte-
and 20 min (MT2) milling time; 600 rpm (MS1) and 800 rpm (MS2) milling speed; and ball to pulp
gration of gold-gangue
ratio of 5:1 (BR1) and 10:1mineral agglomerates,
(BR2). For surfaceall
a given experiment, cleaning of passivated
other parameters goldconstant
are kept particles
as
and pore formation enabling gold site access within gangue minerals (Figure
follows: milling time—10 min; milling speed—1000 rpm; and ball to pulp ratio—2:1. 7).
Figure 7.
Figure 7. Schematic
Schematic diagram
diagram showing
showing the
the effect
effect of
of mechano-chemical
mechano-chemical activation
activation on
on the
the refractory
refractory bio-oxidation
bio-oxidation product
product
and gold
and gold extraction
extraction performance,
performance,Modified
Modifiedafter
afterAsamoah
Asamoahet
etal.
al.2018
2018[18].
[18].
7. Conclusions
7. Conclusions
Subtle deposit
Subtle feature
deposit changes
feature can reflect
changes notable
can reflect effect effect
notable on goldonextraction performance,
gold extraction perfor-
leading leading
mance, to inconsistent and in some
to inconsistent cases
and in some uneconomical gold extraction.
cases uneconomical In this paper,
gold extraction. In thisa
research overview, reconciling key and useful case study findings, have been
paper, a research overview, reconciling key and useful case study findings, have been presented
presented in unravelling the major causes of gold refractoriness and maximizing specific
gold extraction performance. Evidently, the major cause of gold refractoriness in the ob-
stinate ore was the presence of refractory secondary sulphate minerals (e.g., gypsum and
jarosite). Otherwise, both investigated ore types showed the effect of carbonaceous matter
and other gangue minerals on gold extraction performance. The bio-oxidation product
leaching mechanism and kinetics together with rheological behaviour were influenced by
the feed mineralogy/chemistry, time, agitation/shear rate, interfacial chemistry, pH modi-
fier type and mechano-chemical activation. Mechano-chemical activation of the refractory
bio-oxidation product aided in overcoming the sulphate mineral-imposed refractoriness
and improved gold recovery by about 1.8 times. Better monitoring of subtle process
changes could help minimize process instabilities and maximize financial performance of
mine operations.
Funding: This research received funding from the Australian Government Research Training Schol-
arship. Future Industries Institute of University of South Australia is gratefully acknowledged for
financial support.
Institutional Review Board Statement: Not applicable.
Informed Consent Statement: Not applicable.
Data Availability Statement: Not applicable.Minerals 2021, 11, 93 13 of 14
Acknowledgments: Funding from the Australian Government and University of South Australia is
gratefully acknowledged. The author would also like to acknowledge Jonas Addai-Mensah, William
Skinner, and Richard Amankwah for their varied useful discussions and inputs to this research.
Conflicts of Interest: There is no conflict of interest for this work.
References
1. Viewing, K.A. Gold ’82: The Geology, Geochemistry and Genesis of Gold Deposits. In Proceedings of the Symposium Gold ’82,
University of Zimbabwe, Harare, Zimbabwe, 24–28 May 1982; A. A. Balkema: Rotterdam, The Netherlands, 1984.
2. Webber, K. Australian Gold Rush: Gold Fever; Macmillan Publishers Australia: Sydney, NSW, Australia, 2012; p. 32.
3. Corti, C.; Holliday, R. Gold: Science and Applications; CRC Press, Taylor and Francis Group: Boca Raton, FL, USA, 2010; p. 444.
4. Habashi, F. Gold—An Historical Introduction. In Gold Ore Processing: Project Development and Operations; Adams, M.D., Ed.;
Elsevier: Amsterdam, The Netherlands, 2016; pp. 1–20.
5. Hontanilla, B.; Marre, D. Eyelid Reanimation with Gold weight implant and tendon sling suspension: Evaluation of excursion
and velocity using the FACIAL CLIMA system. J. Plast. Reconstr. Aesthet. Surg. 2013, 66, 518–524. [CrossRef] [PubMed]
6. Lee, S.-M.; Kim, H.J.; Ha, Y.J.; Park, Y.N.; Lee, S.K.; Park, Y.B.; Yoo, K.H. Targeted chemo-photothermal treatments of rheumatoid
arthritis using gold half-shell multifunctional nanoparticles. ACS Nano 2013, 7, 50–57. [CrossRef] [PubMed]
7. Statista. World Mine Reserve of Gold as of 2015, by Country. Mining, Metals and Minerals. 2016. Available online: http:
//www.statista.com/statistics/248991/world-mine-reserves-of-gold-by-country/ (accessed on 23 June 2016).
8. Adams, M.D. Gold Ore Processing: Project Development and Operations; Elsevier: Amsterdam, The Netherlands, 2016; Volume 15.
9. Bas, A.D.; Ghali, E.; Choi, Y. A review on electrochemical dissolution and passivation of gold during cyanidation in presence of
sulphides and oxides. Hydrometallurgy 2017, 172, 30–44. [CrossRef]
10. Deschênes, G. Advances in the cyanidation of gold. In Gold Ore Processing—Project Development and Operations; Adam, M.D., Ed.;
Elsevier: Amsterdam, The Netherlands, 2016; pp. 429–445.
11. Fomchenko, N.V.; Kondrat’eva, T.F.; Muravyov, M.I. A new concept of the biohydrometallurgical technology for gold recovery
from refractory sulfide concentrates. Hydrometallurgy 2016, 164, 78–82. [CrossRef]
12. Li, Q.; Zhang, Y.; Li, X.; Xu, B.; Yang, Y.; Jiang, T.; Li, H. Intensification of gold leaching from a multi-refractory gold concentrate
by the two-stage roasting—Alkaline sulfide washing—Cyanidation process. In 8th International Symposium on High-Temperature
Metallurgical Processing; Springer: Berlin, Germany, 2017.
13. Mubarok, M.Z.; Winarko, R.; Chaerun, S.K.; Rizki, I.N.; Ichlas, Z.T. Improving gold recovery from refractory gold ores through
biooxidation using iron-sulfur-oxidizing/sulfur-oxidizing mixotrophic bacteria. Hydrometallurgy 2017, 168, 69–75. [CrossRef]
14. Nunan, T.O.; Viana, I.L.; Peixoto, G.C.; Ernesto, H.; Verster, D.M.; Pereira, J.H.; Teixeira LA, C. Improvements in gold ore
cyanidation by pre-oxidation with hydrogen peroxide. Miner. Eng. 2017, 108, 67–70. [CrossRef]
15. Ofori-Sarpong, G.; Osseo-Asare, K.; Tien, M. Mycohydrometallurgy: Biotransformation of double refractory gold ores by the
fungus, Phanerochaete chrysosporium. Hydrometallurgy 2013, 137, 38–44. [CrossRef]
16. Oraby, E.A.; Eksteen, J.J.; Tanda, B.C. Gold and copper leaching from gold-copper ores and concentrates using a synergistic
lixiviant mixture of glycine and cyanide. Hydrometallurgy 2017, 169, 339–345. [CrossRef]
17. Asamoah, R.K.; Skinner, W.; Addai-Mensah, J. Alkaline cyanide leaching of refractory gold flotation concentrates and bio-oxidised
products: The effect of process variables. Hydrometallurgy 2018, 179, 79–93. [CrossRef]
18. Asamoah, R.K.; Skinner, W.; Addai-Mensah, J. Leaching behaviour of mechano-chemically activated bio-oxidised refractory
flotation gold concentrates. Powder Technol. 2018, 331, 258–269. [CrossRef]
19. Asamoah, R.K.; Skinner, W.; Addai-Mensah, J. Pulp mineralogy and chemistry, leaching and rheological behaviour relationships
of refractory gold ore dispersions. Chem. Eng. Res. Des. 2019, 146, 87–103. [CrossRef]
20. Asamoah, R.K.; Zanin, M.; Gascooke, J.; Skinner, W.; Addai-Mensah, J. Refractory gold ores and concentrates part 1: Mineralogical
and physico-chemical characteristics. Miner. Process. Extr. Metall. 2019, 129, 1–13. [CrossRef]
21. Asamoah, R.K.; Zanin, M.; Skinner, W.; Addai-Mensah, J. Refractory gold ores and concentrates part 2: Gold mineralisation and
deportment in flotation concentrates and bio-oxidised products. Miner. Process. Extr. Metall. 2019, 129, 1–14. [CrossRef]
22. Asamoah, R.K. EDTA-enhanced cyanidation of refractory bio-oxidised flotation gold concentrates. Hydrometallurgy 2020, 193, 1–10.
[CrossRef]
23. Asamoah, R.K.; Skinner, W.; Addai-Mensah, J. Enhancing gold recovery from refractory bio-oxidised gold concentrates through
high intensity milling. Miner. Process. Extr. Metall. Trans. Inst. Min. Metall. 2019, 129, 1–10. [CrossRef]
24. Senanayake, G.; Jayasekera, S.; Bandara AM, T.S.; Koenigsberger, E.; Koenigsberger, L.; Kyle, J. Rare earth metal ion solubility in
sulphate-phosphate solutions of pH range −0.5 to 5.0 relevant to processing fluorapatite rich concentrates: Effect of calcium,
aluminium, iron and sodium ions and temperature up to 80 ◦ C. Miner. Eng. 2016, 98, 169–176. [CrossRef]
25. Dutrizac, J.E.; Chen, T.T. The behaviour of phosphate during jarosite precipitation. Hydrometallurgy 2010, 102, 55–65. [CrossRef]
26. Nazari, B.; Jorjani, E.; Hani, H.; Manafi, Z.; Riahi, A. Formation of jarosite and its effect on important ions for Acidithiobacillus
ferrooxidans bacteria. Trans. Nonferrous Met. Soc. China 2014, 24, 1152–1160. [CrossRef]
27. Sadowski, Z. Adhesion of microorganism cells and jarosite particles on the mineral surface. In Process Metallurgy; Amils, R.,
Ballester, A., Eds.; Elsevier: Madrid, Spain, 1999; pp. 393–398.Minerals 2021, 11, 93 14 of 14
28. Sasaki, K.; Konno, H. Morphology of jarosite-group compounds precipitated from biologically and chemically oxidized Fe ions.
Can. Mineral. 2000, 38, 45–56. [CrossRef]
29. Miller, P.; Brown, A.R.G. Bacterial oxidation of refractory gold concentrates. In Gold Ore Processing—Project Development and
Operations; Adams, M.D., Ed.; Elsevier: Amsterdam, The Netherlands, 2016; pp. 359–372.
30. Cathro, K.J.; Koch, D.F.A. The dissolution of gold in cyanide solutions—an electrochemical study. In Proceedings of the Annual
Conference of Australasian Institute of Mining and Metallurgy, Western Australia, Australia, 17–22 August 1964.
31. Lorenzen, L. A fundamental study of the dissolution of gold from refractory ores. In Chemical and Metallurgical Engineering;
University of Stellenbosch: Stellenbosch, South Africa, 1992; p. 329.
32. Aghamirian, M.M.; Yen, W.T. Mechanisms of galvanic interactions between gold and sulfide minerals in cyanide solution.
Miner. Eng. 2005, 18, 393–407. [CrossRef]
33. Dai, X.; Jeffrey, M.I. The effect of sulfide minerals on the leaching of gold in aerated cyanide solutions. Hydrometallurgy 2006,
82, 118–125. [CrossRef]
34. Azizi, A.; Petre, C.F.; Olsen, C.; Larachi, F. Electrochemical behavior of gold cyanidation in the presence of a sulfide-rich industrial
ore versus its major constitutive sulfide minerals. Hydrometallurgy 2010, 101, 108–119. [CrossRef]
35. Bas, A.D.; Gavril, L.; Zhang, W.; Ghali, E.; Choi, Y. Electrochemical dissolution of roasted gold ore in cyanide solutions.
Hydrometallurgy 2015, 156, 188–198. [CrossRef]You can also read