SPAIN VOCATIONAL EDUCATION AND TRAINING IN EUROPE - VET IN EUROPE REPORTS I 2018 - ReferNet ...
←
→
Page content transcription
If your browser does not render page correctly, please read the page content below
VOCATIONAL EDUCATION
AND TRAINING IN EUROPE

SPAIN

           VET IN EUROPE REPORTS I 2018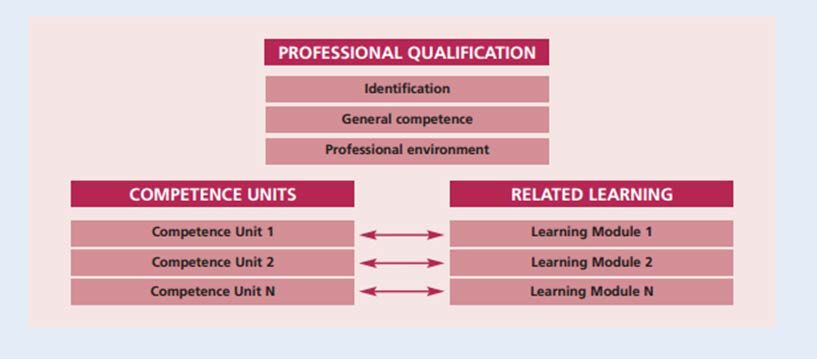
Please cite this publication as:
 Sancha, I.; Gutiérrez,S. (2019). Vocational education and training in Europe:
 Spain. Cedefop ReferNet VET in Europe reports 2018.
 http://libserver.cedefop.europa.eu/vetelib/2019/Vocational_Education_Trainin
 g_Europe_Spain_2018_Cedefop_ReferNet.pdf

Author(s):      Inés Sancha and Sofia Gutiérrez Dewar
Contributor(s): Officials from Deputy Directorate-General for Planning and
                Innovation in Vocational Training, Education Statistics, INCUAL,
                State Public Employment Service of Spain (SEPE) and Fundae
Validated by: Clara Sanz López, Spanish national representative for ReferNet

Reviewed by Cedefop       © Fundación Estatal para la Formación en el
Empleo (Cedefop ReferNet Spain), 2018

Reproduction is authorised, provided the source is acknowledged.
Spanish version on www.refernet.es

This VET in Europe report is part of a series prepared by Cedefop’s ReferNet
network.
VET in Europe reports provide an overview of national vocational education and
training (VET) systems of the EU Member States, Iceland and Norway. The
reports help to understand VET’s main features and role within countries’ overall
education and training systems from a lifelong learning perspective, and VET’s
relevance to and interaction with the labour market.
VET in Europe reports follow a common Cedefop format. They are available at
http://www.cedefop.europa.eu/EN/Information-services/vet-in-europe-country-
reports.aspx.

The opinions expressed here do not necessarily reflect those of Cedefop.
VET in Europe reports are cofinanced by the European Union and ReferNet
national partners.

ReferNet is a network of institutions across Europe representing the 28 Member
States, plus Iceland and Norway. The network provides Cedefop with information
and analysis on national vocational education and training. ReferNet also
disseminates information on European VET and Cedefop’s work to stakeholders
in the EU Member States, Iceland and Norway.
http://www.cedefop.europa.eu/en/events-and-projects/networks/refernet

               /cedefop                     @cedefop           refernet

                                                                                   2
Table of contents
CHAPTER 1. External factors influencing VET .................................................. 6
1.1. Demographics .................................................................................................6
1.2. Economy and labour market trends ................................................................7
1.3. Active labour market policies ........................................................................10
1.4. Educational attainment..................................................................................13
CHAPTER 2. Providing VET in a lifelong learning perspective........................ 16
2.1. VET programmes in the education system ...................................................19
2.1.1. Features of IVET programmes ..........................................................22
2.2. VET programmes in the employment system ...............................................26
2.2.1. Training programmes linked to the national catalogue of
occupational standards - professional certificates (CdP) .................. 28
2.2.2. Training programmes not linked to the national catalogue of
occupational standards......................................................................30
2.3. Other forms of training ..................................................................................31
2.3.1. Training for sector regulated professions ..........................................31
2.3.2. Non-formal education and training programmes ...............................32
2.4. VET governance, administration and finance ...............................................33
2.4.1. VET governance, administration and finance in the education
system ...............................................................................................34
2.4.2. VET governance, administration and finance of VET programmes
at the employment system.................................................................36
2.5. Teachers and trainers ...................................................................................38
2.6. National Reference Centres ..........................................................................40
CHAPTER 3. Shaping VET qualifications ........................................................ 42
3.1. Anticipating skills needs ................................................................................42
3.2. Designing qualifications ................................................................................43
3.2.1. Occupational standards ..................................................................... 43
3.2.2. VET diplomas ....................................................................................45
3.2.3. Professional Certificates (CdPs)........................................................46
3.2.4. Quality assurance in the education system .......................................48
3.2.5. Evaluation and quality in training for employment .............................49
3.3. Validation of informal and non-formal learning..............................................51
CHAPTER 4. Promoting participation in VET .................................................. 54
4.1. Incentives for learners ...................................................................................55
Individual training leaves for the employed (PIF) ..........................................57
Incentives for the unemployed ......................................................................58
The training and apprenticeship contract (offered in IVET and CVET) ......... 59
4.2. Incentives for companies ..............................................................................59
34.3. Incentives for training providers ....................................................................61
4.4. Information, advice and guidance services ...................................................62
List of acronyms and abbreviations..................................................................... 65
References [URLS accessed 7.11.2018] ............................................................ 67
Annex 1 Sector branches in the CNCP ............................................................... 79
Annex_T_1 Country profile (ES and EU28) 2007, 2015-17 .......................... 80
Annex_T_2 Youth activity, employment and unemployment (data in
thousands) - Spain .................................................................... 82
Annex_T_3 Rates of employment and unemployment by sex in Spain and
EU, 2017.................................................................................... 83
Annex_T_4 Evolution of PAPEs financial provision (million Euros and %) ... 84
Annex_T_5 Student enrolled in VET by professional branch - course 2015-
2016 (Edition 2018) – Spain / 1 ................................................. 85
Annex_T_6 Public Expenditure on Education 2016 in € ............................... 87
Annex_T_7 Participants in training schemes managed by Fundae 2015-2017
according to execution year ....................................................... 88
Annex_T_8 Profile and labour characteristics of the workers trained by their
companies and volume of training undertaken (2017) .............. 90
Annex_T_9 Governance and target groups – Employment VET .................. 91
Annex_T_10 Continuing vocational training survey (CVTS) 2015 .................. 92
Tables and figures
Table 1. Population of Spain (2014-18) ....................................................... 6
Table 2. Active Companies by size-class in 2016-2017 .............................. 7
Table 3. Unemployment rate (%) by education level of 25 to 64 year-olds
(ISCED 2011)............................................................................... 15
Table 4. Students enrolled in non-university education ............................. 20
Table 5. Professional Certificates issued by level, 2017............................ 29
Table 6. Features of the 583 CdP learning programmes ........................... 47
Table 7. Number of holders and amount of scholarships in non-university
post-compulsory education. School year 2016/17 and variation . 56
Table 8. Sector branches in VET (Familias Profesionales) ....................... 79
Figure 1. Companies by number of employees in 2017................................ 8
Figure 2. Employees by economic activity in 2017 ....................................... 8
Figure 3. Employment by occupation (ISCO*) 2007-17 (15-64 years, %) .... 9
4Figure 4. Young people successfully registered in the national youth
guarantee system (in thousands)................................................. 12
Figure 5. Population aged 25-64 by education attainment level, 2017 ....... 13
Figure 6. Mean income by educational attainment level, EU28 and Spain in
€ ................................................................................................... 14
Figure 7. Early leavers from education and training (%), EU28 and ES 2008-
17, and Spanish regions in 2017 ................................................. 15
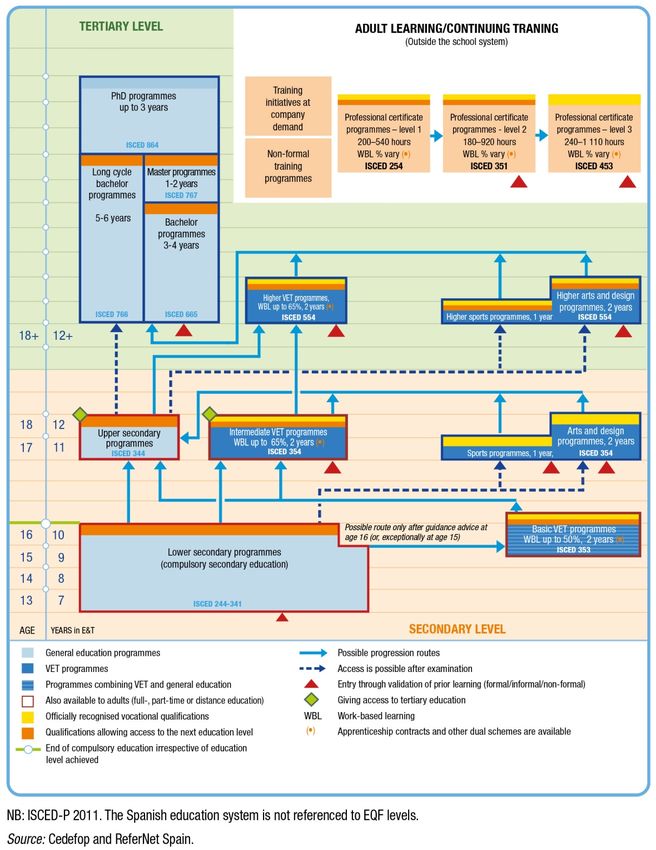
Figure 8. Diagramme of the national education and training system
(provisional) ................................................................................. 17
Figure 9 Evolution of IVET students in the education system, 2008-18..... 21
Figure 10 Share of students according to age by VET level programme,
2015/16 ........................................................................................ 22
Figure 11. Dual VET in the education system, 2012-16................................ 25
Figure 12. Company training initiative ........................................................... 31
Figure 13. Distribution (percentage) of public expenditure on education by
activity 2016 ................................................................................. 36
Figure 14. Allocation of funds according to training initiatives for employed
workers – 2017 ............................................................................ 38
Figure 15. Structure of Occupational Standards ........................................... 44
Figure 16. Number of VPL places called in 2017 .......................................... 53
Figure 17. Continuing vocational training survey (CVTS) 2015 .................... 60
5CHAPTER 1.
External factors influencing VET
The right to education and vocational training is set out in the Spanish
Constitution of 1978, which includes the right to basic education ( 1) for the foreign
population.
The territory is organised into municipalities, provinces and regions
(autonomous communities Comunidades Autónomas – CC.AA.). The
decentralisation of the State involves the adoption of an administration model that
divides competencies between the state and the 17 regions, as well as two
autonomous cities (Ceuta and Melilla).
1.1. Demographics
Spain is the second largest country in EU28 (505 944 km2) and the fifth most
populated. On 1st of January 2018, the Spanish population was 46 659 302 - an
increase of nearly 0.3% compared to January 2017 (Table 1), thanks to a positive
migratory balance since 2016. Spain has the longest life expectancy (83.5 years)
and the lowest fertility rate (1.34 children per woman in 2016) among EU
countries ( 2). Around 90% of the total population is concentrated in the coastal
areas and Madrid.
Table 1. Population of Spain (2014-18)
2014 2015 2016 2017 2018(*)
Total 46 512 199 46 449 565 46 440 099 46 527 039 46 659 302
Spaniards 41 835 140 41 995 211 42 022 582 42 107 583 42 087 247
Foreigners 4 677 059 4 454 353 4 417 517 4 419 455 4 572 055
NB: (*) Provisional Data at 25.06.18
Source: Prepared by authors with data from INE (2018). Population Figures at 1 January 2018.
Migrations Statistics. Year 2017: Provisional data. Press release; 25.06.18.
https://www.ine.es/en/prensa/cp_e2018_p_en.pdf
Foreigners account for 9.8% of the total population, 26% are of school age
(0-24 years), which is four points higher than the native population for the same
(1) Basic education in Spain covers primary and lower secondary compulsory education
(2) Eurostat, Life expectancy at birth by sex (tps00205) and Total fertility rate (tps00199)
in 2016. Date of extraction 05.06.2018
6age range. Romanians and Moroccans represent 30.6% of total foreigners, and
South Americans account for 18%.
Around 20% of the total population is aged 65 and older. If current
demographic trends continue ( 3), Spain will gain almost 2.4 million inhabitants in
the next 15 years, although the 30-49 age group would decrease by 2,7 million
(-18.8%) and the number of children under 15 years of age would decrease by
17.0%. Population projections warn that in 15 years, there will be 3.4 million more
people over 64 years old, (38.1%). If the 40 - 44 age group is currently the most
numerous, in 2033 it will be the 55 - 59age group.
1.2. Economy and labour market trends
By 2015, the Spanish economy had regained pre-crisis growth rates of activity
and job creation (see Annex_T_1 for a statistical country profile).
The economy grew 3.1% in 2017 ( 4), surpassing the European average and
all forecasts. This was mainly due to the positive evolution of the international
economy and the improvement in financial conditions.
All productive sectors contributed positively to GDP growth in 2017.
Construction took the lead, followed by the primary sector and industry, in which
manufacturing stands out. The services sector, in turn, moderated its growth rate
with respect to the previous year ( 5).
Economic recovery has been accompanied by an increase in the number of
companies with employees to almost one and a half million (Table 2). The
number of companies without employees also grew significantly. Micro-SMEs
(from 1 to 9 employees) account for 90% of the total number of companies with
salaried workers, whereas medium-sized companies (from 50 to 199 employees),
represent only 1.3% of the total (Figure 1).
Table 2. Active Companies by size-class in 2016-2017
Companies 2017 % 2017 2016 % Var.
Without employees 1 823 250 55.55% 1 791 909 +1.41%
With employees 1 459 096 44.45% 1 444 673 +1.75%
(3) INE (2016). Proyección de Población 2018 [Population projection 2018]. Nota de
prensa; 10.10.2018. https://www.ine.es/prensa/pp_2018_2068.pdf and
https://youtu.be/d9Ugc2ve_uw
(4) Eurostat, Real GDP growth rate – volume. Percentage change on previous year
(tec00115). Last update 13.06.2018. Date of extraction 14.06.2018
(5) INE (2018). Quarterly National Accounts of Spain. Base 2010 First quarter of 2018.
Press release; 31.05.18.
http://www.ine.es/en/daco/daco42/daco4214/cntr0118_en.pdf
7Figure 1. Companies by number of employees in 2017
10-49
8.27% 50-99
0.86%
1.70%
100-199
1-9 0.46%
90.03%
200-499
0.26%
500-999
1000 + 0.07%
0.06%
Source: INE. Companies by Autonomous Community, main activity (CNAE 2009 groups) and wage earner
stratum. http://www.ine.es/jaxiT3/Tabla.htm?t=298&L=1
All economic sectors experienced a rise in employment in 2017, with three
out of four employed workers in the service sector. In 2017, the share of
employees increased by 2.6% compared to 2016. Employment grew in most
branches of economic activity, especially in the primary sector (5.8%) (Figure 2).
Figure 2. Employees by economic activity in 2017
Employed Thousands % Annual change
Total 18 824.8 100.0
Agriculture 819.5 4.4
Industry 2 647.4 14.1
Construction 1 128.3 6.0
Services 14 229.6 75.6
Source: INE (2018). España en cifras 2018 [Spain in figures 2018]. Madrid : INE.
https://www.ine.es/prodyser/espa_cifras/2018/files/assets/common/downloads/publication.pdf
In terms of occupational profiles, the trend of recent years continued in 2017.
The Spanish occupational structure reflects a progressive change towards a
greater weight of professionals, and of those in services and sales. In the latter
case this is due to occupations in restaurants and catering, which comprise
around two million jobs. Although less than in the past, elementary occupations
still represent a considerable part of the total (Figure 3).
In the last decade (2007-17), the number of employed people decreased
almost 9%, mainly in the categories of managers and workers in craft and related
trades, whereas the professional and service and sales workers categories
increased. Over the 2016-17 period, major variations took place in the categories
of skilled agricultural and related workers (+6.7%) and plant and machine
operators (+4.8%) (Figure 3).
8Cedefop’s 2030 skills forecast for the Spanish labour market ( 6) points to
substantial employment growth until 2030, driven by services sectors such as
wholesale and retail trade, arts and recreation or ICT services. Occupations in
services shall also rise strongly: sales workers, personal service workers or
customer clerks will be the fastest growing over the period to 2030. Almost half of
total job openings (including replacements for vacated positions) up to 2030 will
need high qualification levels and job opportunities for low qualified people will
shrink substantially in the coming years.
Figure 3. Employment by occupation (ISCO) (*) 2007-17 (15-64 years, %)
Evolution of employment by occupation (ISCO) in Employment by occupation
Spain, 2007-2017 Spain and EU28, 2017
Armed forces occupations
2017 ES
Elementary occupations 2007
EU-28
Plant and machine operators, and…
Craft and related trades workers
Skilled agricultural, forestry and…
Service and sales workers
Clerical support workers
Technicians and associate…
Professionals
Managers
0.0% 5.0% 10.0% 15.0% 20.0% 25.0% 0% 10% 20% 30%
NB: (*) ISCO - International standard classification of occupations
Source: Eurostat (lfsa_egais). Last update 31.05.2018; extracted on 15.06.2018.
Despite the economic recovery, Spain still suffers from imbalances in the
economic and labour spheres: high public debt, small size of industry and
insufficient/inefficient investment in research, development and innovation ( 7);
high rates of unemployment – especially youth and long-term unemployment,
excessive segmentation of the labour market, among others.
In 2017, Spain had the second highest unemployment rate in EU28, at
17.2%, after Greece (21.5%) ( 8). According to national statistics from the first
(6) Cedefop. Skills Forecast (2019). http://www.cedefop.europa.eu/en/publications-and-
resources/data-visualisations/skills-forecast
(7) Mingorance-Arnaiz, A.C.; Pampillón, R. (2016). La situación de los sectores
económicos: retos y oportunidades [The situation of the economic sectors:
challenges and opportunities]. Revista Economistas, No. 146/147, pp. 27-34.
(8) Eurostat. Unemployment by sex and age - annual average [une_rt_a]. Last update:
31.05.18. Extracted: 06.06.18
9quarter of 2018, the activity rate stands at 58.46% while the unemployment rate
is 16.74%.This rate has dropped 2.01 points ( 9) in the last 12 months.
The rate of employment growth for young people in 2017 was more positive
than that of the population as a whole. The young working population increased
by 4.15%, while unemployment fell by 9.07% and employment increased by
14.11% (see Annex_T_2 for youth activity, employment and unemployment).
However, the ratio of the youth unemployment rate to the unemployment
rate of the population as a whole has remained practically stable since the
beginning of the economic crisis, around 2:1. The gender gap in unemployment
is reopening, although more women than ever are now working in Spain (see
Annex_T_3).
Spain has one of the highest temporary employment rates in the EU (69.0%
for the 15-24 age range) ( 10), and many temporary contracts are of very short
duration: more than 28.5% of contracts are for one week or less ( 11). Transition
rates from temporary to permanent contracts are very low in comparison to the
EU average. Likewise, 54.3% (two points above EU average) of unemployed
people in Spain aged 50-64 are in long-term unemployment (for 12 months or
more) ( 12).
During the economic crisis, inequality grew particularly in Spain, although it
was partially alleviated by an increase in social benefits, which prevented further
growth in income differences. The country has the worst relative situation
regarding poverty prevention and social exclusion indicators, including those
most linked to the risk of child poverty and the risk of poverty of the working
population (CES, 2018). Unemployed people, foreigners, households with
dependent children (especially single parents) and people with a poor education
are at the highest risk of social exclusion.
1.3. Active labour market policies
Active labour market policies follow lines of action agreed with the autonomous
communities in the framework of the Sectoral Conference on Employment and
(9) INE (2018). Economically Active Population Survey (EAPS). First Quarter of 2018.
Press release; 26.04.2018 http://www.ine.es/en/daco/daco42/daco4211/epa0118_en.pdf
(10) Eurostat, Part-time employment and temporary contracts - annual data [lfsi_pt_a].
Last update 23.04.18. Extracted on 18.06.18
(11) CES (2018). Memoria sobre la situación socioeconómica y laboral de España 2017
[Report on the socioeconomic and labour situation of Spain 2017]. Madrid: CES.
http://www.ces.es/documents/10180/5888552/Memoria_Socioeconomica_CES2017.pdf
(12) Eurostat, Long-term unemployment (12 months or more) as a percentage of the total
unemployment, by sex, age and citizenship (%) [lfsa_upgan]. Last update 03.08.18.
Extracted on 07.08.18
10Labour Issues (see section 2.4.2) since 2013, in accordance with the distribution
of competencies between the regional and state public employment services ( 13).
The framework, coordination and implementation of these policies are based
on three instruments: the Spanish strategy for employment activation, the annual
plans for employment policy and the information system for public employment
services. Regional Public Employment Services (PES) design and manage their
own policies based on this common framework, with a commitment to
transparency, evaluation and results orientation.
The 2017-20 Spanish strategy for employment activation (MEYSS, 2017c),
approved in December 2017, takes into account recommendations made to
Spain both within the framework of the National Reform Programme and by the
European Network of Public Employment Services (SPE-UE Network). It includes
projects and measures to rationalize the unemployment protection system and to
provide the national employment system with a set of tools, infrastructures and
information systems necessary for its modernization and to enhance its efficiency
and effectiveness. These include measures aimed at strengthening and
developing management and evaluation systems, and particularly at improving
the management system and support for the Youth Guarantee Initiative.
The strategy is specified each year in the employment polices annual plan
(plan anual de política de empleo – PAPE). Since 2015, these plans have set the
objectives for the country and each region, as well as the services to guarantee
equal access to free public employment services (common employment services
portfolio) (MEYSS, 2015b).The reference guides for the development of protocols
for the provision of these services and the quality criteria have been approved
and published in 2018 (MEYSS, 2018d). These reference guides, developed
jointly with the regions, comprise protocols for: (a) the professional guidance
service; (b) job placement and advice for companies; (c) training and qualification
for employment; and (d) counselling services for self-employment and
entrepreneurship.
The funds for the implementation of employment activation policies in 2018
are equivalent to those of 2017, amounting to EUR 5,575 million euros, an
increase of 5.9% (EUR 310 million) in 2016 ( 14) (see Annex_T_4). Of this figure,
36% is to be distributed among the regions. These amounts include European
Social Funds (ESF) and Youth Employment Initiative contributions.
(13) Until 2012, funds were allocated based on the social and labour conditions of each
region. However, since 2013, the allocation takes into account each region
performance in terms of targets achieved. See also the revised text of the
Employment Act (MEYSS 2015e).
(14) At the time of writing this report, 2018 General State Budgets were not approved yet.
11The publication in September 2015 of Act 30/2015 (Head of State, 2015)
which regulates vocational training for employment set a new framework for the
management and implementation of VET in the field of employment, which is still
being developed.
Act 30/2015 called for an efficient system for monitoring and prospecting the
labour market, based on the coordination of all actors: administrations, social
agents, experts, etc. It also stressed the need to assess the impact of training on
accessing and maintaining employment, enhancing competitiveness of
enterprises, improving workers' skills, meeting labour market needs, and
ensuring efficiency of resources (MEYSS, 2015c).
A provision (MEYSS, 2017b) setting forth Act 30/2015 was published in July
2017 to regulate the initiatives and programmes of vocational training for
employment; the requirements and limits of training actions; their beneficiaries
and the form of accreditation of skills acquired by workers; the instruments of the
integrated information system; and the operating system of the vocational training
for employment.
To boost the national youth guarantee system (Head of State, 2016b), the
Government approved, urgent measures in December 2016 favouring access
and registration of young people in the system with more flexible requirements
such as automatic registration of all young people registered as job seekers in
public employment services; and retroactive registration. Since its entry into
force, the number of registrations has significantly increased ( 15) (Figure 4). This
regulation opened up a more active role of social partners at all levels of the
national youth guarantee system and included other departments (such as
education and health, social services and equality), in the monitoring and
evaluation committee.
Figure 4. Young people successfully registered in the national youth guarantee
system (in thousands)
Apr-18 1125.46
Dec-17 1006.05
Dec-16 404.84
Dec-15 179.16
Dec-14 20.66
0.00 200.00 400.00 600.00 800.00 1000.00 1200.00
People registered (thousands)
Source: Prepared by the authors with data from the National System of Youth Guarantee. Data at 31st May 2018
(15) SEPE. Datos de inscripción en el Sistema de Garantía Juvenil [Registration data in
the Youth Guarantee System] http://www.sepe.es/garantiajuvenil/ca/inscripcion.html
12The organisation of the Spanish State with a high degree of decentralisation
of education, training and employment policies marks the development of the
Youth Guarantee at different levels (regional and local). However, to ensure its
implementation throughout the entire territory, a national coordination mechanism
has been established in the labour ministry and the state public employment
service (SEPE) took over the management role of the national youth guarantee
system in July 2017 (MEYSS, 2017a).
The national youth guarantee system, launched in 2014 (MEYSS, 2013c),
was extended in July 2015 to young people over the age of 25 and under the age
of 30 while their unemployment rate exceeds 20 percent (MEYSS, 2015d).
The national youth guarantee system has a safeguarding design, unlike
other EU member states, as when a young person meets the legal requirements,
he/she is registered and remains in the youth guarantee file until he/she
voluntarily drops out or is removed according to the age limit and having received
an adequate service ( 16).
1.4. Educational attainment
The share of people with low qualifications (ISCED 0-2) in Spain almost double
EU average, (Figure 5). In contrast, at 36.4% the percentage of the population
with higher education (ISCED 5-8) is above the EU average (31.5%), and close
to the national target set at 44% for 2020. In addition, the percentage of 25 to 34
year-old in training is higher than in other EU countries.
Figure 5. Population aged 25-64 by education attainment level, 2017
ISCED 0 - 2 ISCED 3 - 4 ISCED 5 - 8
SPAIN 40.9% 22.7% 36.4%
EU-28 22.5% 46.1% 31.5%
OCDE 20.7% 42.8% 36.9%
0.0% 10.0% 20.0% 30.0% 40.0% 50.0% 60.0% 70.0% 80.0% 90.0% 100.0%
Source: prepared by authors with data from Eurostat and OECD. Eurostat: Population by educational
attainment level, sex and age (%) - main indicators [edat_lfse_03] Last update 15.01.19.
Extracted on 01.02.19. OECD (2019) Adult education level (indicator). Accessed on 11.02.2019
(16) Please see the country fiche for Spain for a detailed assessment of the Youth
Guarantee implementation in the country (European Commission (2017b).
13The share of the Spanish population with intermediate level qualifications
(ISCED 3-4), at 22.7%, is approximately half of EU and OECD averages (46.1
and 43.2% respectively).
According to the last survey on the participation of the adult population in
learning activities (INE, 2018a), over 47% of the population between 18 and 64
years of age carried out some type of training activity (formal or non-formal) in
2016. This represents 6.6 points more than in 2011, when the previous survey
took place.
The OECD’s Survey of Adult Skills (1st Cycle) -part of the Programme for the
International Assessment of Adult Competencies (PIAAC) - showed that there
are still challenges to address. One in four adults in Spain scores among the
lowest levels in literacy and almost one in three in numeracy ( 17), though Spain’s
16 to 24 year-olds are more proficient than the overall adult population in all
domains assessed, and are notably more proficient than the country’s 55 to 65
year-olds. Results from the Programme for International Student Assessment
(PISA) up to 2015 indicated that students’ performance in reading and
mathematics were around OECD and EU averages.
Figure 6. Mean income by educational attainment level, EU28 and Spain in €
ES - EU28, 2017
28000 25552
26000
24000
22000
Euros
20000 17720 22329
18000
16000 14513
14000 16083
12000
12395
10000
ISCED 0-2 ISCED 3-4 ISCED 5-8
EU28 ES
Source: Eurostat, Mean and median income by educational attainment level - EU-SILC survey [ilc_di08], last
update 08.02.2019. Extracted on: 11.02.2019
Educational level is a proxy measure for both the chances of being
employed as well as salary level. People with tertiary education earned 23%
more in 2017 than those who have completed upper secondary education and
44% more than those who have completed lower secondary education or less
(Figure 6).
(17) OECD (2013). OECD Skills Outlook 2013: First Results from the Survey of Adult
Skills. Paris: OECD Publishing. http://dx.doi.org/10.1787/9789264204256-en
14In addition, the correlation between unemployment rate and educational
level reflects the vulnerability of poorly qualified people (Table 3).
Table 3. Unemployment rate (%) by education level of 25 to 64 year-olds (ISCED
2011)
2017 ISCED 0-2 ISCED 3 - 4 ISCED 5 - 8
EU-28 13.9 6.0 4.2
ES 23.4 15.1 9.3
Source: EUROSTAT (tps00066); extracted: 08.08.18. Last update 03.08.18.
In this context, school dropouts rates (ReferNet Spain, 2013) among the
18-24 age group without at least a mid-level qualification (upper secondary) is a
major concern for education and labour authorities. In 2017, the early school
leaving (ESL) rate reached 18.3%, with a decrease of 13.4 points in the last 10
years (Figure 7). The figure is below 15% (the national target) in over seven
regions. It is lower among women and higher in the foreign population (35.8%
compared to 15.9% among Spaniards).
Figure 7. Early leavers from education and training (%), EU28 and ES 2008-17,and
Spanish regions in 2017
35.0 Andalucía
Melilla 30 Aragón
30.0 Ceuta Asturias
25
25.0 Rioja 20 Baleares
20.0 15
País Vasco Canarias
10
15.0
5
Navarra Cantabria
10.0
Castilla y
5.0 Murcia
León
Castilla-La
0.0 Madrid
Mancha
2008 2017 Galicia Cataluña
Extremadura C. Valenciana
EU28 ES
ES_Regions ES_Total EU28
Source: Prepared by authors with Eurostat data (edat_lfse_14) 2018 and MECD data 2018
Different strategies are being developed and carried out to tackle some of
the issues related to early school leaving and low levels of qualification and
competences, like for example the new education Act in 2013 (Head of State,
2013), and the lifelong learning (MECD, 2015) or entrepreneurship and youth
employment 2013-16 (MEYSS, n.d.) strategies.
Specifically, to help prevent early school leaving in compulsory secondary
education, basic VET programmes were designed as an alternative route to stay
in or return to education and training (FP Básica, see also Chapter 2). New
vocational training diplomas were also developed and old ones were updated to
make them more attractive and relevant to the labour market. Information and
career guidance have also been improved (see Chapter 4).
15CHAPTER 2.
Providing VET in a lifelong learning
perspective
The VET system is organised according to Act 5/2002 on qualifications and
vocational education and training (Ley Orgánica de las Cualificaciones y la
Formación Profesional - LOCFP) (Head of State, 2002), which shapes the VET
system and lays down the necessary instruments and actions to promote and
develop vocational education and training, as well as to assess and validate
professional competences acquired by non-formal and informal means.
VET is defined in Act 5/2002 as the set of training activities that prepare
people for qualified performance in diverse occupations, access to employment
and active participation in social, cultural and economic life. It covers the training
programmes included in IVET and CVET, to enable skilling, upskilling and
reskilling. Initial VET is mainly aimed at young people although it is also open to
adults wishing to acquire a qualification. Vocational training for employment is
offered for both the employed and unemployed workers. Ministry for Education
and Vocational Training, and Ministry for Labour, Migration and Social Security
are responsible for the VET system in Spain.
IVET in the education system
Education in Spain (Figure 8) is regulated by the 2006 Education Act (LOE)
(Head of State, 2006) and the 2013 Act for the improvement of educational
quality (LOMCE) which aims to improve student performance and curb early
school leaving. LOMCE implementation started in 2014/15 with full
implementation by 2017, however several measures have been deferred until a
new social and political pact for education is reached ( 18).
(18) Head of State (2016a). the Royal Decree-Law 5/2016, of December 9
establishes that the evaluations foreseen in the 2013 LOMCE Act at the end of
compulsory secondary education and high school will not have academic effects and
will only have a diagnostic purpose. Their completion will not be necessary to obtain
the different diplomas.
16Figure 8. Diagramme of the national education and training system
Education offered from early childhood until the end of primary school
(compulsory, 6 years, learners aged 6 to 12) does not include vocational training
programmes.
17Lower secondary education ( 19) (known as ESO in Spanish), is the second
and last stage of compulsory education comprising four academic years (from 12
to 16 years). After graduation, learners receive the lower secondary education
certificate (título ESO, ISCED 2) which gives access to high school (bachillerato),
intermediate VET (FP de grado medio) or the labour market. Students who do
not obtain the ESO diploma receive an official certificate of compulsory
education, which details the years studied and grades obtained.
The 2013 education reform introduced an alternative vocational path (Basic
VET or FP Básica in Spanish) open to ESO students aged 15 years, who meet
certain age and academic requirements ( 20). Students passing this basic VET
programme are awarded a diploma with academic and professional validity
(Título profesional básico). Basic VET cycles run in a 2-year programme of 2 000
hours of theoretical and practical training, of which a minimum of 240 hours are
completed in workplaces. It gives direct access to intermediate VET cycles and
the possibility of sitting the exam to obtain the ESO diploma, opening up access
to upper secondary general education programmes. Students who finish basic
VET will obtain the ESO diploma directly if the teaching staff considers they have
achieved the objectives and necessary skills of ESO level.
Upper secondary education comprises high school (the general academic
route, bachillerato in Spanish) and intermediate VET, neither of which is
compulsory.
High school (bachillerato) consists of two academic years that are normally
taken between the ages of 16 and 18. There is a core curriculum with compulsory
subjects and a specialised part with several preselected options which students
can choose from ( 21). Upon successful completion, students obtain the end of
upper secondary education diploma (título de Bachillerato, ISCED 3) which gives
direct access to higher VET programmes (ISCED 5) and, following a university
entrance exam, to university studies (ISCED 6). Intermediate VET programmes
(19) For more information on the Spanish organisation of secondary and post-secondary
education, see Eurydice. National Education Systems: Spain: Secondary and Post-
Secondary Non-Tertiary Education.
https://eacea.ec.europa.eu/national-policies/eurydice/content/secondary-and-post-
secondary-non-tertiary-education-43_en
(20) Requirements for Basic VET are: () to be between 15 and 17 years old by the end
of the year they start these studies; () to have finished the first cycle of secondary
compulsory education (that is, three years) or exceptionally, have finished the
second course of secondary compulsory education and () to be recommended by
teaching staff and have parents (or own if he/she is emancipated) consent.
Education authorities, apart from compulsory education, can also offer basic VET to
people who are over 17 and do not have a VET or a secondary qualification.
(21) There are three Bachillerato orientations: Sciences, Humanities and Social Sciences,
or Arts, with different subjects to choose from in each orientation, and common ones
in all three.
18(ISCED 3) consist of 2 000 hours of training divided into two academic years.
Students who successfully complete these programmes are awarded a
Technician diploma (título de Técnico) in the relevant speciality. Since the
2016/17 academic year, this qualification gives students direct access to higher
level VET ( 22).
Tertiary education includes vocational (ISCED 5) and academic programmes
(ISCED 6-8). The duration of Higher VET programmes (ISCED 5) is 2 000 hours
over two academic years. These studies lead to a Higher Technician diploma
(título de Técnico Superior) giving access to related university studies. University
studies (ISCED 6-8) include bachelor, master and PhD programmes.
The flexibility of the system not only affects the vertical progression in VET,
but also the horizontal flow between different educational programmes: students
awarded a basic VET diploma may obtain the ESO diploma. Equally, students
awarded Intermediate VET Diplomas may obtain the Bachillerato Diploma by
passing the relevant Bachillerato core subjects.
In addition, the education system provides certificates or diplomas for:
(a) languages, issued by official language schools for students over 16, on three
levels: elementary (A2), intermediate (B1) and upper intermediate (B2)
(ISCED 353) based on the European Framework for learning, teaching and
assessment of languages (CERF) ( 23);
(b) artistic and sports education programmes. Education in music and dance
offer specific curricula at different levels: elementary (ISCED 100) and
intermediate (ISCED 353) and higher level (ISCED 665).There are also other
programmes for arts and design at an intermediate (ISCED 354) and higher
level (ISCED 554), which are optional at the end of secondary education.
Sports programmes offer education at intermediate (ISCED 354) and higher
level (ISCED 554). These programmes are offered in schools that are
specialised according to the type and level of education in artistic or sports
fields.
2.1. VET programmes in the education system
The number of students enrolled in non-university education in 2017/18 was
8 158 605, similar to the previous year (0.3% increase) but different by
level (Table 4).
(22) If demand exceeds the number of places available at this level, educational
authorities may establish admission procedures in accordance with Government
regulation.
(23) https://www.coe.int/en/web/portfolio/the-common-european-framework-of-reference-
for-languages-learning-teaching-assessment-cefr-
19Since 2014/15 when first introduced, basic VET increased by
2 658 (+ 3.8%), with 72 186 enrolled students in 2017/18. Higher VET also
increased by 15 594 (+ 4.1%), reaching 393 531 students including both
face-to-face and distance learning. However, Intermediate VET decreased by
4,808 (-1.4%) students, with 339 112 students including face-to-face and
distance-learning programmes.
Table 4. Students enrolled in non-university education
Change
2017/18 2016/17
Absolute Percentage
TOTAL 8 158 605 8 135 876 22 729 0.3%
Infant Ed. 1st and 2nd cycles 1 758 271 1 780 377 -22 106 -1.2%
Primary ed. 2 941 455 2 941 363 92 0.0%
Special ed. 36 436 35 886 550 1.5%
Lower secondary education 1 929 680 1 887 027 42 653 2.3%
High School (classroom learning) 637 007 643 383 -6 376 -1.0%
High School (distance learning) 38 983 44 212 -5 229 -11.8%
Basic VET (FP Básica) 72 186 69 528 2 658 3.8%
Intermediate VET (classroom learning) 314 434 319 392 -4 958 -1.6%
Intermediate VET (distance learning) 24 678 24 528 150 0.6%
Higher VET (classroom learning) 342 709 333 079 9 630 2.9%
Higher VET (distance learning) 50 822 44 858 5 964 13.3%
Other training programmes 11 944 12 216 -272 -2.2%
Source: MECD (2018). Nota: Estadística de las Enseñanzas no universitarias. Datos avance 2017-2018.
[Note: Statistics on non-university education. Advancing data 2017-2018].
http://www.mecd.gob.es/dms/mecd/servicios-al-ciudadano-mecd/estadisticas/educacion/no-
universitaria/alumnado/matriculado/2017-2018/NotRes1718.pdf
The overall number of IVET students has increased by 65.23% since
2008/09 ( 24) (Figure 9).
(24) The data from 2008/09 does not include students enrolled that year in certain initial
VET programmes (Programa de Cualificación Profesional Inicial - PCPI) that have
been replaced in this period. This percentage increase would be somewhat smaller if
they were also considered.
20Figure 9 Evolution of IVET students in the education system, 2008-18
900000
804829
800000 767528
698694 791385
700000 751507
615079
600000 537571 661047
582576
500000
486893
400000
300000
200000
100000
0
2008-09 2009-10 2010-11 2011-12 2012-13 2013-14 2014-15 2015-16 2016-17 2017-18*
Basic Cycle Intermediate Cycle Advanced Cycle Total
N.B. (*) Advance data; the data do not include certain initial VET programmes (PCPI) that have been
replaced in this period, as they did not lead to a VET degree, but include those for the new Basic
VET.
Source: prepared by authors with data from Statistics from the education ministry.
There has been a slight decrease of enrolment in upper secondary
education from the previous year (1 015 102 students in 2017/18 versus
1 031 515 in 2016/17), and there are still more students who opt for general
upper secondary education than for the VET path: 66.59% in general upper
secondary (Bachillerato) compared to 33.40% in vocational upper secondary
(intermediate VET) cycle.
The professional pathways of Health, Administration and Management,
Information and communications technology and Sociocultural and community
services are the most appealing to students, representing 50% of all VET
learners (see Annex_T_5/1).
VET education programmes are mainly chosen by male students at all three
levels -71.1% for Basic VET, 56.9% in Intermediate VET and 52.4% in Higher
VET level- with significant differences among professional branches (see
Annex_T_5/2). In general, female students prefer pathways in Personal image,
Sociocultural and community services and Health, whereas male students are in
the majority in Transport and vehicle maintenance, Electricity and electronics,
Metal working and Information and communications technology. The Maritime
and fishing industry deserves a special mention, as all students enrolled are
male.
When analysing students in VET programmes by their age, 55% of those at
basic level are within their theoretical age, but at the other levels, there is a large
share of students older than the theoretical school age. In higher level VET,
66.1% are 21 years old or older, and in intermediate level, 64.4% are 19 or older,
which reflects the attractiveness of these programmes for more mature students,
who see them as support to their employability when they cannot find a job and
21re-engagement into education (especially for those who left education early).
(Figure 10)
Figure 10 Share of students according to age by VET level programme, 2015/16
60.0 55.1
51.6
50.0
44.1 44.1
40.0
31.5
29.1
30.0
19.3 20.2
20.0
10.0
0.8
0.0
Theoretical age Over theoretical age (less 25) Over theoretical age (25 and over)
Basic Intermediate Higher
NB: Theoretical ages refer to the ages as established by law and regulation for the entry and
ending of a cycle of education. Theoretical ages may differ significantly from the typical ages.
Source: Prepared by authors with data from education ministry (MECD, 2018c).
2.1.1. Features of IVET programmes
The Spanish initial vocational education and training system, IVET, is organised
at basic (lower secondary ISCED 353), intermediate (upper secondary ISCED
354) and higher (tertiary ISCED 554) levels (see also 3.2.2).
VET programmes are based on learning outcomes with a strong focus on
work-based learning, following ECVET guidelines. The fact that they are taught in
schools does not imply the loss of their practical nature, since the setup of VET
programmes involves compliance with the required equipment and facilities that
make workshops, classrooms and laboratories resemble real workplaces, and in
some cases, teachers and students simulate real working environments.
The arrangements for the different VET levels are very similar in many
aspects: 2 000 hours over two academic years and often take place in the same
education centres (see section 2.4.1).
Similarly, all VET studies include a compulsory work placement module
(formación en centros de trabajo – FCT) that takes place in a company (students
with previous work experience may be exempt). The duration of this module is
set in the official curriculum of each training cycle, and varies from 240 hours in
basic VET to 400 hours in the two other VET programme levels.
VET diploma programmes can be taken full-time or on a part time modular
basis; the latter option allows adult learners to manage their family and
22professional lives more easily. A modular structure allows training to be added
progressively instead of in complete 2-year programmes. In addition, centres that
provide traditional face to face training also offer VET studies as distance
learning to promote learning for students over 18 ( 25). This kind of learning has
grown considerably in recent years, so much so that the number of students in
2017/18 academic year is nearly six times larger than in 2007/08. The courses
have tutors – the same teachers as in the traditional face to face education - set
for this type of learning regime and students are assessed using the same criteria
as their peers in the traditional classroom regime. Diplomas obtained are the
same and are valid countrywide.
2.1.1.1. Dual VET or apprenticeship
Since the implementation of dual VET in 2012 to promote youth employment and
the acquisition of a vocational qualification, various regulations (Ministry of the
Presidency, 2012; MEYSS, 2014 and MEYSS, 2015a) have been passed to
strengthen the lidnks between companies and VET providers, to encourage them
to work together and to encourage greater involvement of students in the labour
market during their training period. There are two types of dual VET: (a) training
and apprenticeship contracts ( 26), in which the learning can be part of the
education or employment systems ( 27); and (b) dual VET projects offered within
the education system and implemented by the regions.
The number of training and apprenticeship contracts (totalling 48 317
considering training programmes offered by both the education and employment
authorities) has increased slightly in 2017 with respect to 2016 (46 384).
All training associated with training and apprenticeship contracts must be
linked to a VET qualification programme (VET diploma or a complete or partial
professional certificate). These contracts last between 1 and 3 years and can be
signed by people aged between 16 to 30 years old (or 25 when the
unemployment rate is under 15%) ( 28) with low-level qualifications ( 29). There is
no age limit for people with disabilities or who experience social exclusion. The
(25) And, in exceptional cases, workers over 16 unable to attend a regular school regime
or elite athletes.
(26) https://www.sepe.es/contenidos/que_es_el_sepe/publicaciones/empleo/fp_dual_contrato.html
(27) More information on the implementation of the principles of the dual system,
introduced in 2012, are available in the 2014 country report, pp. 44-47: SEPE (2015).
Spain VET in Europe: country report 2014. Cedefop Refernet VET in Europe country
reports.http://www.cedefop.europa.eu/en/publications-and-resources/country-
reports/spain-vet-europe-country-report-2014
28
Real Decreto-ley 28/2018, de 28 de diciembre, para la revalorización de las
pensiones públicas y otras medidas urgentes en materia social, laboral y de
empleo.) https://www.boe.es/boe/dias/2018/12/29/pdfs/BOE-A-2018-17992.pdf
(29) People with no university, higher or intermediate VET qualification or equivalent
23salary is set by the collective agreement in proportion to the actual working time
and is never lower than the minimum wage. The effective working time
(work-based learning), compatible with that dedicated to training activities, cannot
be more than 75% of the maximum working time during the first year, or 85%
during the second and third years.
Within the education authority dual VET, a training and apprenticeship
contract is not compulsory. Regional education authorities can choose instead to
use learning agreements to ensure joint participation of educational institutions
and companies. Participating institutions must be authorised by the competent
regional education authorities. The learning agreement must comply with the
prescribed working and training conditions. Some of its main features are that:
• the company will participate in a minimum of 33% of the training hours fixed
in the qualification. The maximum share is 85%;
• the duration of the learning programme can be extended from the usual two
years to three;
• learners may undertake the practical in-company placement after having
completed part of the programme in a training centre. Each region is
regulating differently when the placement can start;
• student assessment is the responsibility of the teachers at school or VET
institution, considering the opinion of in-company tutors & trainers and work
performance.
Due to the improvement and increase of dual projects in intermediate and
higher VET programmes, the number of students, training centres and
companies involved in this kind of VET provision has been growing since
2012/13 (Figure 11), though these kind of projects are still a minority compared to
traditional VET programmes. In the 2016/17 school year, those enrolled in
education authority dual VET programmes only represented 3% of total VET
students.
24Figure 11. Dual VET in the education system, 2012-16
VET Schools Learners Companies
30000 854 900
779
800
720 23973
25000
700
Learners and Companies
20000 600
VET schools
16199
14934 500
15000 381
400
9801 10081
10000 300
173 5665
4878 200
5000
4292 1570 100
513
0 0
2012-13 2013-14 2014-15 2015-16 2016-17
Source: SGOFP (MECD). Data provided by the Autonomous Communities, 2012-2017 July 2018.
2.1.1.2. Adult education
The aim of adult education is to offer people over 18 (in some cases over 16) the
possibility to acquire, update, complete or expand their knowledge and skills for
their personal and professional development. To achieve this goal, the education
authorities collaborate with other public authorities responsible for adult learning
and particularly with the labour authorities, as well as with local government and
social partners (employers and trade union organisations; as well as chambers of
commerce in dual VET).
Education authorities provide basic education for adults who for different
reasons do not hold the end of compulsory education qualification (título ESO). It
comprises primary education, lower secondary education, vocational training,
and language education (see 2.3.2, non-formal education and training
programmes). Post-compulsory studies (Bachillerato and vocational training for
adults) are also provided. Programmes for adults may be offered on a full time,
part-time or modular basis.
There are also opportunities for adults to sit entrance examinations to gain
access to studies which lead to an official qualification, such as entrance
examinations for intermediate and higher vocational training programmes ( 30),
(30) Entry requirements for VET diploma programmes (intermediate or higher) can be
checked at: MEFP. Aprende a lo largo de la vida. Formación profesional [Learn
throughout life. Vocational training]. https://aprendealolargodelavida.mecd.gob.es/
ensenanzas/formacion-profesional.html
25higher artistic education and university education. A number of places are
reserved each year for adults who access education through this system, which
can vary from 10-30% according to different pathways and each territorial
context.
Finally, education authorities periodically organise examinations for adults
wishing to obtain an official qualification (the general education ESO and
Bachillerato certificates, and basic, intermediate and higher VET diplomas)
without having to complete the corresponding studies. These examinations are
open to people over 18 (or over 20 in the case of higher VET diploma
programmes).
Partial exemption of modules included in a VET Diploma is also
possible (see section 3.3). In addition, the education authorities, through official
language schools, regularly organise tests for adults who wish to obtain a
language certificate without completing the corresponding course.
Education authorities also offer other training options for adults, which do not
lead directly to a formal qualification (see section 2.3.2.).
Similarly, labour authorities organise a wide range of training schemes to
improve employability or ease integration into the labour market. These training
schemes fall within the system of vocational training for employment (see section
2.2.).
2.2. VET programmes in the employment system
Vocational training for employment falls mainly under the remit of the labour
ministry ( 31) and the regions. It is regulated by Act 30/2015 reforming vocational
training for employment and royal decree 694/2017 (MEYSS, 2017b) although
the act is still pending further legislative developments. Its aims are to promote,
extend and adapt the provision of training to the needs of the labour market and
help develop a knowledge-based economy.
It includes training programmes for both employed and unemployed workers,
with the aim of improving the employability of the population by professional
training or retraining. It also provides an opportunity for people who left education
with low or no qualifications to improve their competences and skills or level of
qualification. It is based upon cooperation between labour authorities and social
partners (employers and trade unions) at national and regional level, and
(31) Other ministries can also regulate training for their area of competence. For example
in April 2018, Red.es an institution belonging to the ministry of economy and finance,
published a call for proposals for Training programmes for the acquisition and
improvement of skills in the field of the digital economy See Ministry of Energy,
Tourism and Digital Agenda (2018).
26You can also read