Solar radio emission as a disturbance of radiomobile networks
←
→
Page content transcription
If your browser does not render page correctly, please read the page content below
www.nature.com/scientificreports
OPEN Solar radio emission
as a disturbance of radiomobile
networks
1 2 1*
Giuliano Muratore , Teresa Giannini & Davide Micheli
This paper analyses the effects of solar radio emissions in the radiomobile context, for the first
time leveraging massive European Telecommunications Standards Institute (ETSI) 3rd Generation
Partnership Program (3GPP) Minimization of Drive Test (MDT) radio measures produced by 4G LTE
(Long Term Evolution) terminals and by 4G LTE Base Station cells. A method to study solar noise
effects starting from radiomobile 3GPP standard MDT measures is illustrated and correlated with
the excellent 10.7 cm (2800 MHz) indicator of solar activity (National Research Council Canada). The
effects of solar disturbance on the LTE radio access network for mobile services are analysed, and
possible countermeasures are presented from the perspective of radiomobile network evolution to 5G
and 6G.
Solar flares are a well-known phenomenon that creates a sudden release of a great amount of energy out of the
Sun and within Sun high magnetic field regions, called solar active r egions1. During flares, energy confined by
magnetic fields is rapidly converted into kinetic, thermal and mechanical energies, capable of locally heating
plasma to several million degrees and accelerating ambient particles to high energies. All these phenomena also
produce electromagnetic field emission with radio waves covering an extremely wide frequency range, starting
from tens of kHz up to a few hundred G Hz2. An approximately 11-year time period, characterized by a Sun’s
magnetic pole flip, alternates the time periods of the quiet Sun with a time period of intense solar activity mainly
characterized by events such as solar flares and coronal mass injection (CME) with high energy flux particles
and radiation emissions. The last solar cycle (24°) was a feeble cycle, peaking at 114 sunspots (the average was
179), and communication services were rarely badly affected by solar radio e missions3. The recently initiated
25° solar cycle shows some meaningful flare events, such as the 3rd of July 2021 classified of magnitude X1.5
(Geostationary Operational Environment Satellites classification in a range from A, B, C, M to X, according to
the peak flux in watts per square metre of X-rays with wavelengths 100 to 800 pm).
This article, for the first time, studies the solar radio disturbance of LTE services by means of innovative 3 GPP4
MDT (Minimization of Drive Test) standard radio measures and the richness of the R language environment for
data elaborations5. The M DT6–13 standard allows the mobile network operator (MNO) to collect georeferenced
radio measurements anonymously and free of charge reported by mobile phones to the network, measurements
including radio received base station (BS) cell power levels, interference levels and quality of radio links at the
frequencies of MNO serving BS cells. In this way, a huge amount of periodic radio measurements related to the
territory around BS cells can be analysed with data science methods to extract statistical information on reference
signal received power (RSRP) and interference signal to interference ratio (SIR) fluctuation.
The research on the discovered solar disturbance of LTE services is organized in four sections.
The Results section highlights the main evidence of the study.
The section Cellular network radio measures and solar noise describes how to leverage 3GPP MDT standard
radio measures to detect solar noise disturbance and how the estimated solar noise disturbance is correlated to
official Penticton radio-telescope measures of solar noise (provided as a service by the National Research Council
of Canada for many scientific and commercial activities at both industrial organizations and government agen-
cies around the world).
The section Observations focuses on July the 3rd flare (X1.5 class) and compares solar effects on network
behaviour with the immediately preceding July the 2nd day, when Sun was still quiet.
The section Radiomobile data analysis shows the effects of the 3rd July flare on a 4G LTE RAN, detailing the
reasons behind quality drops and possible countermeasures, specifically for the RAN evolution toward 5G and
6G.
1
Telecom Italia, Rome, Italy. 2Istituto Nazionale Di Astrofisica (INAF), Rome, Italy. *
email: davide.micheli@
telecomitalia.it
Scientific Reports | (2022) 12:9324 | https://doi.org/10.1038/s41598-022-13358-z 1
Vol.:(0123456789)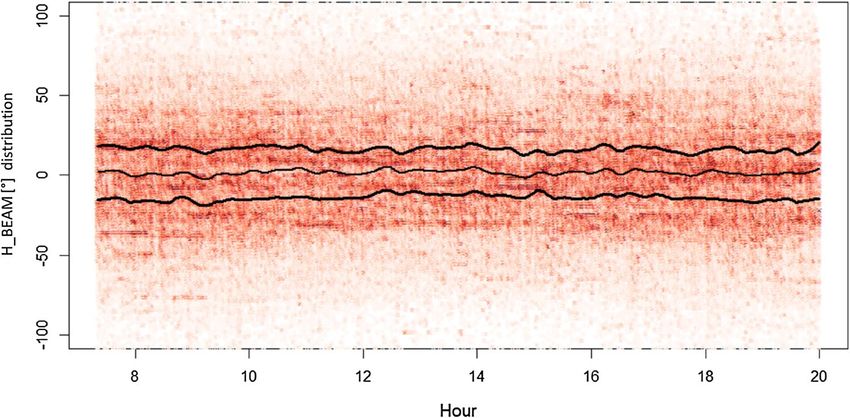
www.nature.com/scientificreports/
Results
An analysis of solar effects on radiomobile 4G LTE networks was conducted by means of massive 3GPP MDT
radio measures produced by millions of phones connected to MNO LTE BS cells available in northeast regions
of Italy. A good correlation was found between an index extracted by radiomobile measures and the F10.7
indicator of solar activity.
The radiomobile index was analysed for the sunlight hours of July 3rd, day with a class X1.5 flare, comparing
effects with days of quiet Sun.
Effects on mobile communication quality of service were identified in relation to radiomobile BS cell hori-
zontal orientation (BS cell azimuth) toward the Sun, whereas effects were weakly influenced by BS cell vertical
orientation (antenna elevation angle, usually called BS cell antenna tilt), thus indicating a way for countermeas-
ures capable of limiting solar disturbance of radiomobile networks, also from the perspective of 5G and 6G RAN
evolutions towards self-organizing networks (RAN that automatically plan, configure, manage and optimize
themselves).
The solar irradiance in the microwave region, specifically in bands at approximately 3 GHz, can deeply vary
from the situation of a quiet sun to the situation of an active sun. During higher peaks of solar flux (e.g., 1000 or
even 10,000 solar flux units, or briefly s.f.u., corresponding to 10−22 W m−2 Hz−1) at approximately 3 GHz, the gap
between the signal power received by mobile phones and solar noise power can become narrower, so the commu-
nication quality of service can be even more deeply affected with respect to the situation discussed in this article.
Solar effects are even more probable in radiomobile higher bands (24 GHz–40 GHz) allocated for 5G, with
solar irradiance being stronger (with lower magnitude bursts) and less dependent on the solar quiet or active
period. In this 5G solar scenario, the flexibility offered by electronic beam orientation can be leveraged to reduce
radio link quality degradation, maintaining the beam orientation toward the user position as much as possible
and preferring beam orientations not aligned with the Sun azimuth.
Future analysis, making use of the first available 5G MDT measures in 3.7 GHz band, is expected to improve
the knowledge about solar effects on radiomobile networks, considering the relevance of 5G (and future 6G)
connections for many innovative services and industrial applications.
The presented analysis is based on fully standard radiomobile MDT measures collected by 8800 cells in terri-
tory. Such measures are potentially available H24 in all running radiomobile networks worldwide (4G, 5G, etc.).
In this way, the extension of the proposed approach to a planetary scale (many radiomobile networks located on
different continents) theoretically enables the analysis of whatever source of “noise” comes from space within
the radiomobile frequencies, ideally creating a “virtual wordwide radiotelescope” that, leveraging the Earth
curvature, can also estimate the extraterrestrial source elevation.
Discussion
Cellular networks radio measures and solar noise. All cellular networks continuously monitor the
radio frequencies allocated for the communication services offered to the customers and constantly receive,
from each user equipment (UE), such as smartphone devices, the signal level of the cells around it and the related
channel quality indicators.
UEs to periodically send a large set of measurements from Layer 2—MAC (3GPP TS 36.321),—and Layer
3—Radio Resource Control (3GPP TS 36.331) and, with MDT, UEs share their measurements periodically with
the network (when a global positioning system (GPS) receiver is enabled, UE measurements are also geolocated).
This standard mechanism creates billions of daily measures describing radioelectric evolution around each
cell, essential information to optimize frequency band usage and fight the impact of radio interference and
(inevitably) environmental electromagnetic noise such as thermal noise, both coming from Earth and sky.
Big Data analysis, a quite recent but now consolidated industry trend, enables new investigation directions
capable to leverage massive radio data including also less frequent events, like (but not only) solar activity
disturbances.
The study of Solar effects at 2695 MHz on 4G LTE systems by means of MDT paves the way for studying
effects for the new 5G radio access adopting sub millimeter band below 6 GHz and, in the near future, millimeter
waveband above 25 GHz.
Sun could be more disturbing at 5G and 6G higher frequencies and, in the meantime, radiomobile services
are extending their reach to include low latency mission critical uses (e.g. in contexts like: autonomous driving,
remote surgery, energy and water active grids, etc.).
RAN LTE installations are typically used in a three-sector c onfiguration14 to optimize capacity and radio
coverage, combining three 120° sectors (e.g., half power at + /− 60°), all the (360°) territory around. Cells are
characterized by their physical position, by the frequency band allocated to communicate with mobile termi-
nals, by the horizontal orientation (azimuth, maximum antenna gain direction) and by the vertical orientation,
technically also said the tilt. Typically, BS cell antennas use a negative tilt (i.e., pointing down toward streets and
buildings where people live) or zero tilt (i.e., pointing toward the horizon). Therefore, in general, cells do not
point toward the sky, and antenna gain decreases more sharply in the vertical direction (e.g., half power at + /− 10°
degrees). Practically speaking, solar radio emissions could directly inject noise in radiomobile antennas, even
when the cell azimuth matches the Sun azimuth, only during sunrise or sunset, when tilt is somehow aligned to
the (zero) solar elevation in the sky.
Nevertheless, we cannot forget that solar radio waves coming from the sky and impacting ground (or roofs,
buildings, roads, etc.) are subject to reflections and more in general scattering. Indeed, by considering the typi-
cal decimetre wavelength of many mobile bands worldwide, solar radio waves could also be bent by diffraction
from edges all along the Earth’s surface or by diffraction from human infrastructures on the Earth’s surface (e.g.,
buildings, walls, cars). Electromagnetic scattering, the phenomenon that makes it possible to serve a huge mass
Scientific Reports | (2022) 12:9324 | https://doi.org/10.1038/s41598-022-13358-z 2
Vol:.(1234567890)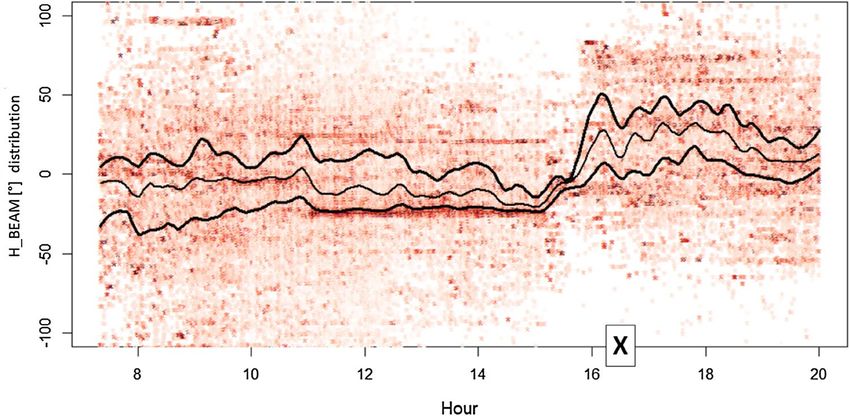
www.nature.com/scientificreports/
Figure 1. (a) A view of MDT sample density [measures/m2] in Bologna City. Cells are visible as triangular
oriented sectors. Points for the geographical mapping representation are pixels having a 1 m side length. (b) The
six different Italian Nord-Est areas (in yellow) involved in the study collectively cover 15.051 k m2.
of mobile terminals without the need for direct antenna visibility, weaks the role of the BS cell antenna tilt as a
protection from Sun radio disturbance, allowing injection in BS cell antennas part of the solar radio disturbance
when tilt is not aligned to the Sun elevation. The only practical protection from solar radio disturbance remains
the BS cell antenna horizontal orientation (cell azimuth).
To isolate Sun noise disturbance on radiomobile RAN from other interferences, two criteria are considered.
The first criterion takes advantage of the abundance of radiomobile cells insisting on a sufficiently wide geo-
graphical area (see Fig. 1). Indeed, a single cell can be affected by local noise around the cell, whereas thousands
of cells spread over a wide area allows mitigation of local interference phenomena.
The second criterion exploits the abundance of different cell orientations (azimuth), permitting always (at each
time of the day) to select a specific subgroup of cells that, in that moment, result (horizontally) oriented toward
Sun azimuth and another subgroup of cells oriented in the opposite way. Using this approach, Sun noise RF power
can be followed throughout the day (see Fig. 2), selecting, at each moment, the appropriate subgroup of cells and
analysing the behaviour differences between the two subgroups. The Sun-exposed subgroup is characterized by
the fact that the maximum antenna gain is in the direction of the Sun. In contrast, the other subgroup of cells
exposes the minimum antenna gain in the direction of the sun. Effects depending specifically on cell orientation
toward the Sun can emerge from this dynamic division of cells in the two groups, analysing the radio measures
collectively produced by the single group of cells and comparing the two results.
In terms of frequency, the choice was to analyse the 2.6 GHz band (2500–2690 MHz), which was allocated
by the World Radiocommunication Conference (WRC) in 2000 for terrestrial mobile communications services.
The analysis of the 2.6 GHz band presents two advantages. First solar radio emission is typically stronger in
2.6 GHz band, with respect to the other lower frequencies currently used for radiomobile communications.
Second, the 2.6 GHz band is currently the closest LTE band to the frequencies (in the 100 MHz range from
Scientific Reports | (2022) 12:9324 | https://doi.org/10.1038/s41598-022-13358-z 3
Vol.:(0123456789)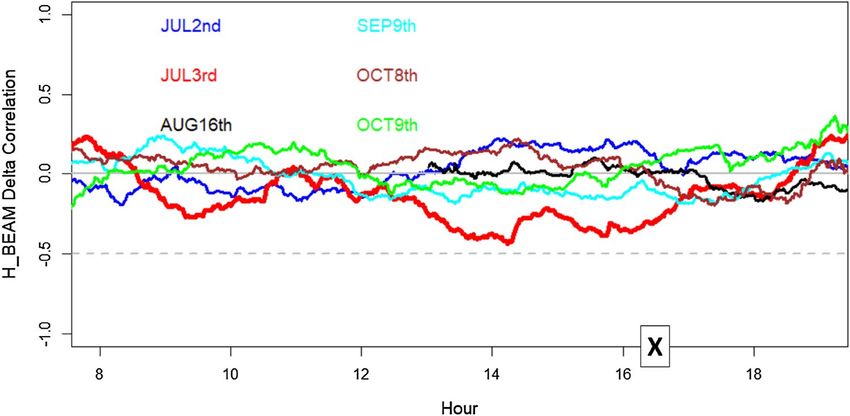
www.nature.com/scientificreports/
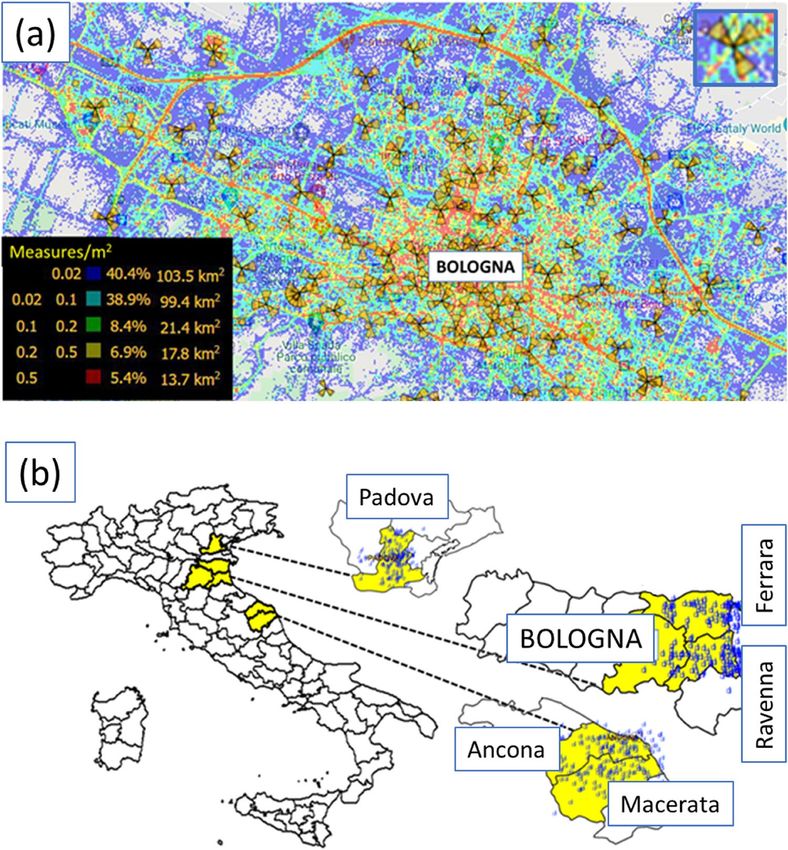
Figure 2. An example of the number cell trend during July 3rd in one (Bologna area, 3702 k m2) of six areas
involved in the study. “X” indicates the flare peak in X-ray emission (local Italian time, UT + 2H).
Figure 3. The Penticton F10.7 Index in 2021, and the 6 days (gray vertical lines) of July 2nd and 3rd, August
16th, September 9th, October 8th and 9th used to compare F10.7 Index with the disturbance derived from
radiomobile MDT measures at 2.6 GHz.
2.75 GHz to 2.85 GHz) that the Penticton Radio Observatory consistently monitors. Solar radio flux at 2.8 GHz
is also referred as the F10.7 index. The index (10.7 being the wavelength in centimeters) is an excellent indicator
of solar activity since 1947, easily and reliably measured on a day-to-day basis (see Fig. 3) in all types of weather
and well correlated with sunspot number15,16.
The Penticton F10.7 index, expressed in s.f.u., is composed of three daily solar flux measures, each repre-
senting a one-hour average. The time zone difference (9 h) between Canada (Penticton) and Italy guarantees
Sun observation contemporaneity (during summer) only for the first daily Canadian measure at 10:00 a.m. in
Penticton (17:00 UT), an hour that corresponds to 19:00 in Italy.
A general characterization of solar noise at 2.6 GHz is visible in Fig. 4, showing the great difference existing,
at those frequencies, between quiet Sun and active Sun conditions.
To study Sun influence on radiomobile services, a relevant radio measure is the Up Link Signal Interference
Noise Ratio (UL_SINR), i.e., the ratio (typically expressed in dB) between the power a BS cell receives when a
signal is sent (Up Link direction) by a mobile terminal, and the interferences and noises the same cell detects
during communication with the mobile terminal on the same Resource Blocks (RB being the smallest unit of
radio resources that can be allocated to a user, 180 kHz wide frequency).
Leveraging UL_SINR measures on UpLink RBs allocated at 2.6 GHz, we defined a different index, the “UL_
SINR Index”, to describe the solar activity influence on radiomobiles. The UL_SINR index is built by taking the
difference between the median of the UL_SINR distribution measures related to cells that result directed toward
the Sun azimuth (with a ± 60° tolerance) and the median of the UL_SINR distribution measures related to cells
that result directed in the opposite way (again with a ± 60° tolerance). By averaging these differences between
Scientific Reports | (2022) 12:9324 | https://doi.org/10.1038/s41598-022-13358-z 4
Vol:.(1234567890)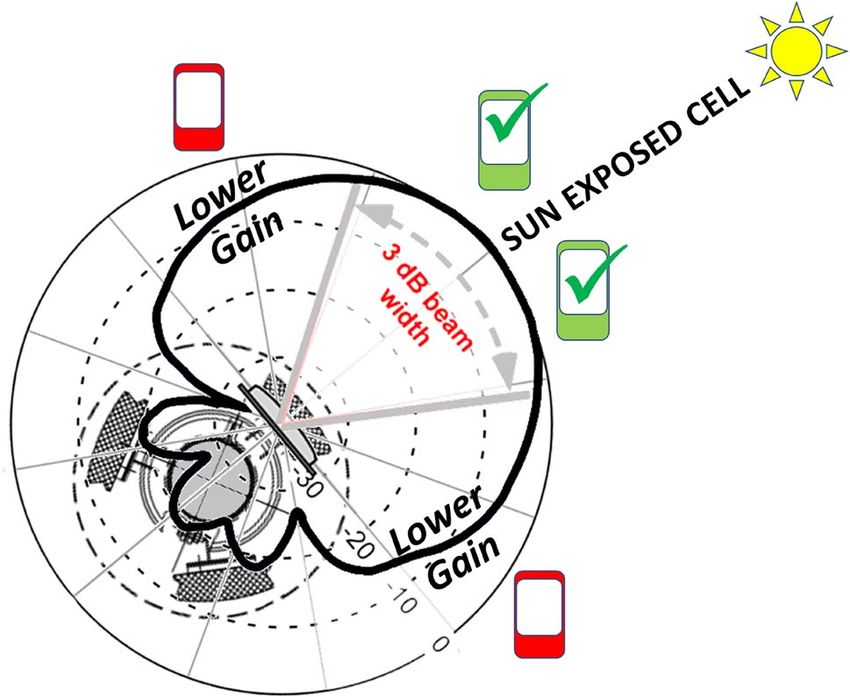
www.nature.com/scientificreports/
Figure 4. Solar radiation spectrum at optical and radio frequencies extracted from Christian Ho, Stephen
Slobin, Anil Kantak, and Sami A smar17. At wavelengths greater than 1 cm, the active sun (red line) and quiet
sun (blue line) deeply differ in terms of radiance, not following blackbody emittance at 6000 K (black line). The
specific situation at 2.6 GHz is added with the dotted lines, showing one order of magnitude s.f.u. variation
(approximately in the range 100–1000 s.f.u).
CANADA—F10.7 Index ITALY—UL_SINR Index
s.f.u.@2.8 GHz Delta (dB) @2.5 GHz
Day year 2021 (16:30–17:30 UT) (16:30–17:30 UT) Note
July 2nd 95.7 −0.124233
X1.5 class flare peak at 14:29 UT, two hours before Canadian F10.7 Index calculation. The correspond-
July 3rd 95.5 −0.5545361 ing UL_SINR Index (−0.5545361) was calculated averaging 466,369 MDT measures reported by 783
different LTE cells
August 16th 74.3 0.1835652
September 9th 100.7 −0.3704581
October 8th 85.7 0.1198423 Due to sunset time in October in Italy, the October UL_SINR Index refer to the hour 15:30–16:30 UT
October 9th 87.1 −0.04971983 (one hour before F10.7 Index calculation)
Table 1. Comparison between Canadian F10.7 Index (2.8 GHz Penticton Radio-Telescope) and UL_SINR
Index (derived from MDT radiomobile measures in 2.6 GHz band).
UL_SINR distribution medians over one hour and changing the group of cells according to the path of the Sun
throughout the day, we obtain a value, the UL_SINR Index (expressed in dB), that can be compared with the cor-
responding F10.7 Index (of the same hour). The idea behind this index is to maximize the Sun noise detectability
with respect to mobile phone interference, typically randomly spread around the RBs assigned by the serving cell.
Considering that radiomobile cells are distributed throughout the territory in a way that tends to maximize
radio coverage and mobile phone traffic and at the same time points to minimize reciprocal cell interference,
there is no reason to have a UL_SINR distribution median that depends on a specific cell orientation direction
when we consider a high number of cells and measures to populate those distributions. Therefore, the general
expectation is that the UL_SINR Index is close to zero. When a difference exists, and this difference is negative,
it means that it operates a cause that makes the UL_SINR lower for the Sun oriented cells and higher for the
cells oriented in the opposite way. In other terms the anti-correlation between Penticton F10.7 index and the
UL_SINR index show the existence of an influence of the Sun on the radiomobile uplink channel quality, with
the SINR being one of the indicators of good or bad communication on the radio (uplink) channel.
Observations
In Table 1 the values of the Penticton F10.7 index is reported (2nd column) for 6 different days (1st column).
Days are selected to obtain a mix of solar conditions at 2.8 GHz (higher s.f.u, medium s.f.u, lower s.f.u) during
the observation period. The corresponding (same day and same hour in the first four cases, same day but con-
tiguous hours in the last two cases) UL_SINR Index (3rd column) is −82% (anti)correlated with F10.7 Index,
showing that the UL_SINR Index is a good indicator (correlation test p-value 0.04) of solar noise influence on
the radiomobile context.
Scientific Reports | (2022) 12:9324 | https://doi.org/10.1038/s41598-022-13358-z 5
Vol.:(0123456789)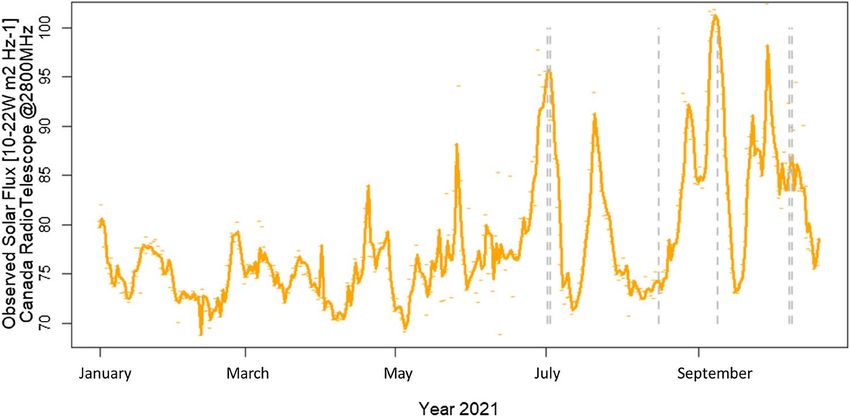
www.nature.com/scientificreports/
Figure 5. Full day comparison between the UL_SINR Index (derived from MDT radiomobile measures in
2.6 GHz band) during July 3rd (red line) and during the day before (blue line), with more quiet Sun. The dotted
and dashed lines indicate the standard deviation (in blue for July 2nd, red for July 3rd) of the two UL_SINR
distributions (whose medians are the two compared UL_SINR indexes) describing the UL_SINR difference
between Sun-oriented and non-Sun-oriented cells. “X” indicates the flare peak in X-ray emission (local Italian
time, UT + 2H). The thick gray segment (see gray arrow), along the dotted gray lines (indicating UL_SINR Index
zero), shows the hour of the, a 60-min period of minor solar emission at 2.8 GHz and lower solar emission
difference between the two consecutive days.
Once established, the UL_SINR Index along the 16:30–17:30 UT hour approximates the s.f.u monitored by
Penticton F10.7 index, UL_SINR Index can also be used in relation to hours when there is no corresponding
Penticton F10.7 index measures available. Specifically, in the following paragraph, all the solar hours of the
most interesting day (July 3rd, showing X1.5 class flares at 14:29 UT) are investigated, focusing on the effects
on radiomobile connections.
The UL_SINR index calculated, minute by minute, during the sunlight hours of July 3, 2021 (Sun flare peak at
16:29 local Italian time) and along the previous day (Sun still quiet) is reported (thick lines) in Fig. 5, showing a
clearer separation between the two day UL_SINR distributions (whose medians are the two compared UL_SINR
indexes) in the period immediately before and after the flare.
The 2nd of July day (quiet Sun) shows a quiet UL_SINR index trend, almost zero, meaning that the signal-to-
noise ratio related to Sun-exposed cells remained always similar to the signal-to-noise ratio of the cells oriented
in the opposite way. In contrast, specifically during July 3rd afternoon, the signal-to-noise ratio of the cells
oriented toward the Sun became lower than the UL_SINR of the cells oriented in the opposite way, so moving
the UL_SINR Index deeply down on two occasions (before and after the X-ray Sun peak).
It is noticeable that the Pentincton F10.7 index registers solar noise at fixed hours, and it registered the solar
noise at 2.8 GHz between 18:30 and 19:30 (Italian time), almost two hours later than the 3rd July flare peak
(radiating 105 × 10−22 W m−2 Hz−1).
To show the effects of solar radio emissions at 2.6 GHz, the angular distribution of radiomobile measures
around the direction of maximum BS cell power is presented. The angular distribution (reported as H_BEAM in
the graphs) is defined as the horizontal angle formed by the direction of maximum power emission of a BS cell
(cell azimuth) and the direction formed by the line joining the BS cell geographical position and the geographical
position of the user at the time of the UL_SINR measure.
When the H_BEAM results zero, it means that the user is perfectly aligned with the direction of the BS cell
maximum power emission (typically a good situation for the signal-to-noise ratio), whereas in the other cases,
the user is less aligned to the maximum BS cell power, up to the extreme case (+ 180° or −180°), where the user
exchanges only the very limited power that the BS cell receives or emits in retropropagation.
The distortion of the H_BEAM angular distribution during the flare day (3rd of July 2021) afternoon is
presented in Fig. 6 (BS cells Sun oriented, in red) and in Fig. 7 (BS cells not Sun oriented, in gray). To have an
appropriate angular distribution benchmark during a day of quiet Sun, the same BS cells and the same angular
distributions are calculated for the day before the 2nd of July 2021, again presenting results in red for Sun-
oriented BS cells (see Fig. 8) and in gray for non-Sun-oriented BS cells (see Fig. 9).
It is not a surprise that, on both consecutive days, the H_BEAM distribution sees users concentrated almost
around the maximum cell power direction (e.g., H_BEAM within +/− 30°), with queues sharply decreasing
approaching the retropropagation cases (typically a bad situation for the signal-to-noise ratio).
Scientific Reports | (2022) 12:9324 | https://doi.org/10.1038/s41598-022-13358-z 6
Vol:.(1234567890)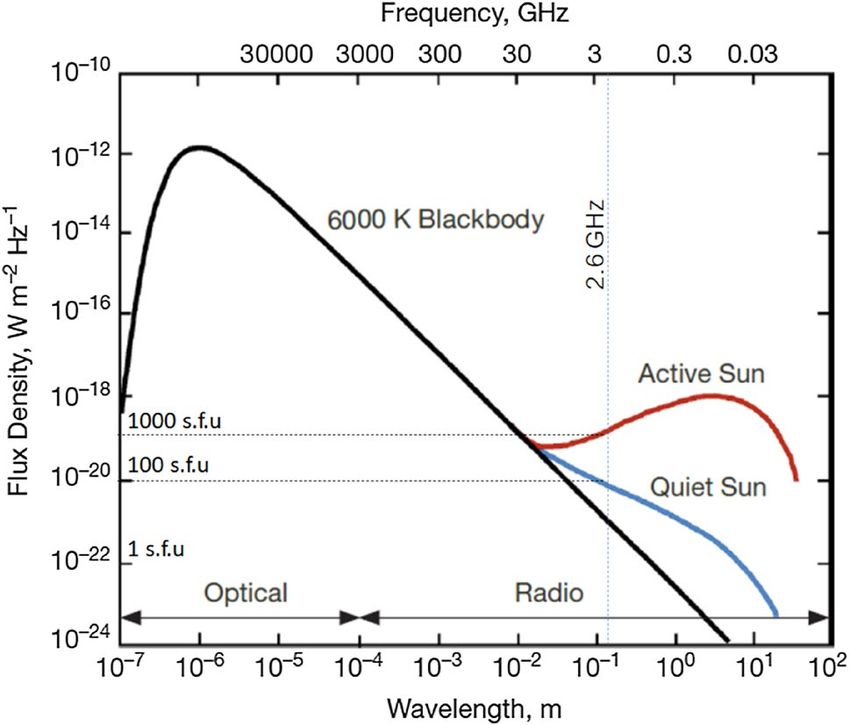
www.nature.com/scientificreports/

                                 Figure 6.  Angular distribution of measures around the direction of maximum power for BS cells Sun oriented
                                 during July 3rd. Lines identify the distribution median (the central line) and +/− standard deviation (color
                                 saturation reflects the density of cases). “X” indicates the flare peak in X-ray emission (local Italian time,
                                 UT + 2H). The loose of balance (distribution squeezing and bending) approaching “X” depends also on two
                                 contingency reasons: a sudden decrease of the number of measures for the Sun exposed BS cells and BS cells
                                 azimuths not perfectly distributed along all possible 0°–359° angles.

                                 Figure 7.  Angular distribution of measures around the direction of maximum power for BS cells not Sun
                                 oriented during July 3rd. Lines identify the distribution median (the central line) and +/− standard deviation
                                 deviation (color saturation reflects the density of cases). “X” indicates the flare peak in X-ray emission (local
                                 Italian time, UT + 2H).

                                 Methods
                                 Radiomobile data analysis. During the 3rd July Sun flare, the H_BEAM trend related to Sun-exposed BS
                                 cells was deeply affected. Specifically, during the two hours immediately preceding the flare (characterized by
                                 a greater background solar disturbance at 2.6 GHz), sun-exposed BS cells modified (squeezing, bending) their
                                 H_BEAM distribution (concentrating connections around the maximum cell power direction).
                                     Afterwards, during the solar maximum X-ray emission time period (less background solar disturbance at
                                 2.6 GHz) Sun-exposed BS cells relaxed their H_BEAM distribution (accepting more connections from the
                                 lateral direction of the cell). The reason behind this behaviour is the fact that BS cells having an azimuth close
                                 to the Sun azimuth receive solar noise from a direction aligned to the maximum antenna gain. If, at the same
                                 time, a mobile terminal tries to connect to the same Sun-exposed BS cell from a position largely not aligned to
                                 the maximum antenna gain direction (so at least laterally, with respect to cell azimuth), the signal sent by this
                                 lateral mobile phone encounters a lower (receiving) cell antenna gain. This badly influences the signal-to-noise
                                 ratio measured (UL_SINR) by the Sun-exposed BS cells and, as a consequence, badly influences the capability
                                 of the Sun-exposed BS cells to correctly decode lateral mobile phone requests of radio resources during the
                                 attach phase (when a mobile asks cells for RBs). In the case of unsuccessful attach, a cell mobile phone can try

Scientific Reports |   (2022) 12:9324 |               https://doi.org/10.1038/s41598-022-13358-z                                                     7

                                                                                                                                               Vol.:(0123456789)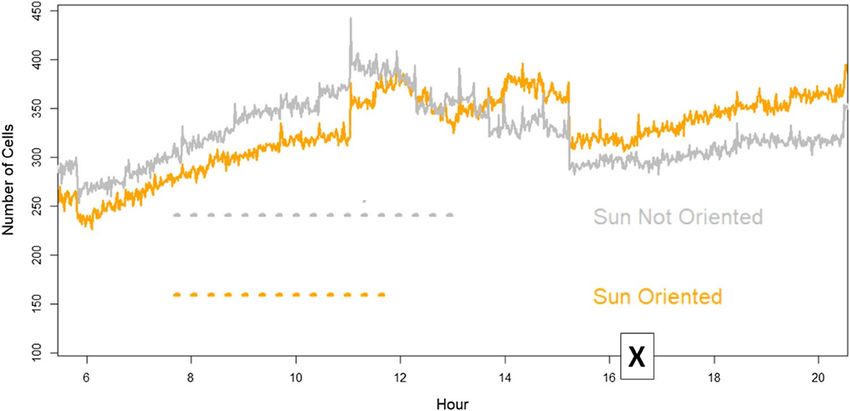
www.nature.com/scientificreports/

                                           Figure 8.  Angular distribution of measures around the direction of maximum power for Sun cells oriented
                                           during July 2nd. Lines identify the distribution median (the central line) and +/− standard deviation deviation
                                           (color saturation reflects the density of cases).

                                           Figure 9.  Angular distribution of measures around the direction of maximum power for cells not Sun oriented
                                           during July 2nd. Lines identify the distribution median (the central line) and +/− standard deviation deviation
                                           (color saturation reflects the density of cases).

                                           with a different cell, and if this new BS cell is not Sun exposed, the attempt can end with success. These types of
                                           mechanisms narrow the angular distribution for the Sun-exposed BS cells around the maximum antenna gain
                                           direction and, vice versa, can enlarge the angular distribution of the non-Sun-exposed cells.
                                               This effect could be graphically visible in Figs. 10 and 11, related to the two hours immediately before the
                                           flare start (14:00 to 16:00). These scatterplots show the differentiation of the network behaviour related to Sun-
                                           oriented and not Sun-oriented cells during a period of stronger solar disturbance.
                                               Sun disturbance peaks (in radiomobile bands), in conjunction with the flexibility of the radiomobile proce-
                                           dures in BS cell selection, imbalance user allocation among available BS cells.
                                               The network reaction to disturbances permits overcoming the imbalance, maintaining a stable total number
                                           of connections during the 3rd July solar disturbance period (Fig. 12). The day before, Sun quiet, shows a situation
                                           (Fig. 13) of perfect balancing among the same Sun-exposed and non-Sun-exposed BS cells.
                                               The solar disturbance effect of depleting the number of users served by Sun-exposed BS cells and, on the other
                                           hand, improving the number of users served by non-Sun-exposed BS cells can be further analysed by defining
                                           the angular opening (around the BS cell azimuth) as the “H_BEAM Delta Correlation”, which includes 68% (a
                                           standard deviation) of the users served by that cell. When the possibility of serving users far from the main power
                                           emission is weakened by solar noise, the “H_BEAM Delta” tends to decrease (less lateral to retropropagation
                                           users). Conversely, when a cell also serves users laterally/retropropagation positioned, the “H_BEAM Delta”
                                           improves.

          Scientific Reports |   (2022) 12:9324 |               https://doi.org/10.1038/s41598-022-13358-z                                                   8

Vol:.(1234567890)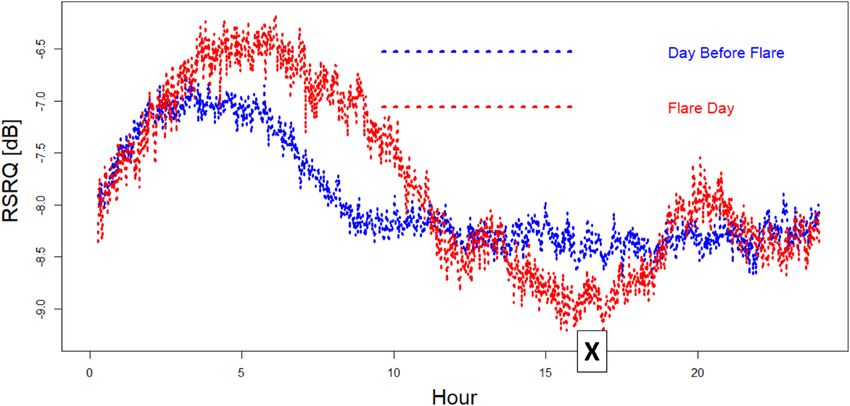
www.nature.com/scientificreports/

                                 Figure 10.  Angular distribution (H_BEAM) as a function of the electromagnetic distance of users from their
                                 serving BS cell, in the case of Sun-oriented BS cells during the two hours immediately before the 3rd July solar
                                 flare. The queues of the distribution (e.g., over + 100° and under −100°) are less populated with respect to the
                                 non-Sun-exposed BS cell equivalent queues (Fig. 11).

                                 Figure 11.  Angular distribution (H_BEAM) as a function of the electromagnetic distance of users from their
                                 serving BS cell, in the case of non-Sun-oriented BS cells during the two hours immediately before the 3rd July
                                 solar flare. The queues of the distribution (e.g., over + 100° and under −100°) are more populated with respect to
                                 the Sun-exposed BS cell equivalent queues (Fig. 10).

                                     Therefore, looking at the correlation between the “H_BEAM Delta” related to Sun-exposed BS cells and
                                 the “H_BEAM Delta” of non-Sun-exposed BS cells in general, we should not expect to see an anti-correlation
                                 because in a wide geographical area, the statistical behaviour of BS cells is expected to remain quite similar. In
                                 Fig. 14, the aforementioned “H_BEAM Delta correlation” is presented in relation to 6 different days, one of
                                 which is the 3rd July trend (red line), during which solar noise was much higher (flare peak at 16:29 local Ital-
                                 ian time, UT + 2H). Along the other 5 days, Sun was less active (no flare with class comparable to that observed
                                 July 3rd). It is noticeable that the 3rd July “H_BEAM Delta correlation” trend becomes more negative (red line)
                                 during the hours preceding the flare. In that specific period, the network reacted to solar disturbance at 2.6 GHz
                                 assigning part of the radio resources to less disturbed BS cells (not Sun oriented), with the Sun oriented cells
                                 partially blinded by solar noise. This (temporary) lack of choice in selecting the best serving BS cell inevitably
                                 scaled down the overall service quality.
                                     The drawback of solar noise on quality is visible also analysing the LTE quality measures (RSRQ Reference
                                 Signal Received Quality) produced by the mobile terminals during their connections. Channel quality at 2.6 GHz
                                 could be affected (RSRQ measures the Downlink channel) by the fact that the best BS cell/channel assignment
                                 during stronger solar disturbance was limited (Sun-exposed BS cells were partially blinded to solar noise). This

Scientific Reports |   (2022) 12:9324 |               https://doi.org/10.1038/s41598-022-13358-z                                                    9

                                                                                                                                             Vol.:(0123456789)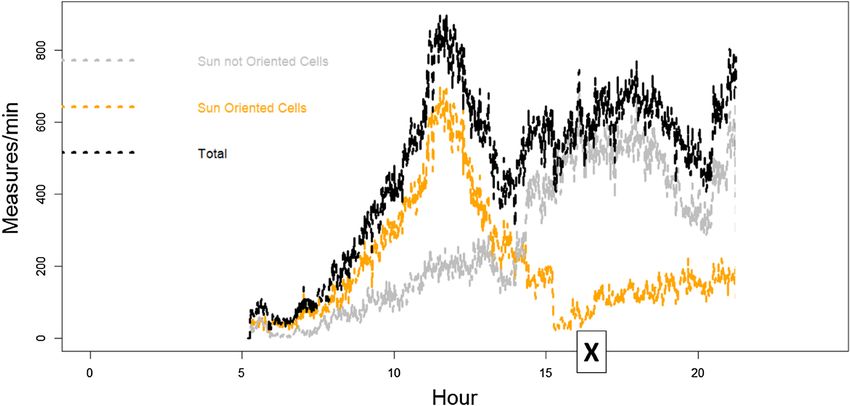
www.nature.com/scientificreports/

                                           Figure 12.  Example (Ferrara and Ravenna area) of the total number of connections (in black) during sunlight
                                           hours on the 3rd of July. The grey line identifies the part of the connection related to non-Sun-exposed BS
                                           cells, whereas the orange line identifies the part of the connection related to Sun-exposed BS cells. Trends are
                                           unbalanced. “X” indicates the flare peak in X-ray emission (local Italian time, UT + 2H).

                                           Figure 13.  Example (Bologna area) of the total number of connections (in black) during the sunlight hours
                                           of the 2nd of July (no Sun flare). The gray line identifies the part of the connection related to non-Sun-exposed
                                           BS cells, whereas the orange line identifies the part of the connection related to Sun-exposed BS cells. Trends
                                           remain balanced all the day.

                                           effect is visible in Fig. 15, where the RSRQ trend of July 3rd (disturbed by Sun) is compared with the RSRQ trend
                                           of July 2nd (more quiet Sun).
                                               The hours with “H_BEAM Delta” anti-correlated are also characterized by a drop in mobile terminals received
                                           quality (RSRQ), further confirming the effects on radiomobile of (big) solar flares.
                                               In term of noise power 1 s.f.u. (extremely low Sun noise) could inject in LTE BS cells a very low power, on
                                           average −161 dBm (assuming the UE average UpLink use of the 15 MHz band in the investigated areas and
                                           the average effective area of an ideal isotropic radiator at 2.6 GHz) solar disturbance remains almost invisible
                                           to radio-mobile (−130dBm being the lower limit for current 4G LTE connection in absence of interference)
                                           until three conditions are reached (see Fig. 16). Solar flux increases to much higher values (e.g., > 100 s.f.u.),

          Scientific Reports |   (2022) 12:9324 |               https://doi.org/10.1038/s41598-022-13358-z                                                 10

Vol:.(1234567890)
www.nature.com/scientificreports/
Figure 14. Correlation between the angular opening of BS cells (in relation to cell azimuth) including 68% of
users (standard deviation of the distribution) related to Sun exposed BS cells and the angular opening of BS
cells (in relation to cell azimuth) of not Sun exposed BS cells, using a sliding window of 180 min (at each minute
the correlation value is attributed to the centre of the 180 min period), between sunrise and sunset. The “X”
indicates the flare peak in X-ray emission (local Italian time, UT + 2H) related to the 3rd of July case.
Figure 15. Comparison of RSRQ (received signal reference quality) measured by mobile terminals during July
2nd (blue line) and July 3rd (red line). A quality drop is visible for the hours close to the Sun flare. “X” indicates
the flare peak in X-ray emission (local Italian time, UT + 2H).
solar disturbance enters the receiving BS cell from a direction corresponding to high antenna gain (close to cell
azimuth) and user signal enters in the same receiving antenna from a direction corresponding to a low antenna
gain (far from BS cell azimuth).
For example, with 300 s.f.u. (Sun active) average solar disturbing power grows at −137dBm. The 7 dB differ-
ence (in respect of −130dBm lower limit for current 4G LTE connection) allows the RAN to overcome the solar
noise problem when both signals, the user signal and the noise, share the same direction (and thus the same
antenna gain). If solar noise is less attenuated with respect to the user signal, the gap could be reduced up to a
threshold that makes UL_SINR insufficiently robust (other sources of noise could also be present) for the con-
nection. Obviously, exceptional events (solar noise emissions much higher than 300 s.f.u) could also unbalance
the UL_SINR when solar noise and user signals share similar directions.
Scientific Reports | (2022) 12:9324 | https://doi.org/10.1038/s41598-022-13358-z 11
Vol.:(0123456789)www.nature.com/scientificreports/
Figure 16. Scheme of a Sun-exposed BS Cell, where the connected phones laterally located (in red) experience
a lower gain (thick black line) of the signal sent (Up Link) to the antenna. Conversely, the disturbing noise
generated by the active Sun, which is more aligned to the cell azimuth, experiences the maximum receiving
antenna gain. This situation unbalances the signal-to-noise ratio for the up link direction.
Received: 9 January 2022; Accepted: 24 May 2022
References
1. Phillips, K. Solar flares. Ir. Astronom. J. 20, 33–42 (1991).
2. Raulin, J.-P. & Pacini, A. A. Solar radio emissions. Adv. Space Res. 35, 735–754 (2005).
3. Marqué, C. et al. Solar radio emission as a disturbance of aeronautical radionavigation. J. Space Weather Space Clim. 8, A42 (2018).
4. 3rd Generation Partnership Project; Technical Specification Group Radio Access Network; Universal Terrestrial Radio Access
(UTRA) and Evolved Universal Terrestrial Radio Access (E-UTRA); Radio measurement collection for Minimization of Drive
Tests (MDT); Overall description; Stage 2 3GPP TS 37.320 V14.0.0 (2017–03).
5. R is a project which is attempting to provide a modern piece of statistical software for the GNU suite of software. The current R
is the result of a collaborative e®ort with con-tributions from all over the world. R was initially written by Robert Gentleman and
Ross Ihaka | also known as \R & R" of the Statistics Department of the University of Auckland. R Core Team (2017). R is a language
and environment for statistical compu-ting. R Foundation for Statistical Computing, Vienna, Austria, \https://www.rproject.org/
6. Micheli, D. et al. Rain effect on 4G LTE in-car electromagnetic propagation analyzed through MDT radio data measurement
reported by mobile phones. IEEE Trans. Antennas Propag. 69(12), 8641–8651 (2021).
7. Vannelli, A., Micheli, D., & Muratore, G. Statistical analysis of smartphone MDT signaling power measurements for Radio Maritime
LTE propagation study. In 2020 International Symposium on Electromagnetic Compatibility - EMC EUROPE. Date of Conference:
23–25 Sept. 2020. https://doi.org/10.1109/EMCEUROPE48519.2020.9245769
8. Micheli, D., & Muratore, G. Smartphones Reference Signal Received Power MDT Radio Measurement Statistical Analysis Reveals
People Feelings during Music Events. In 2019 PhotonIcs & Electromagnetics Research Symposium - Spring (PIERS-Spring). Date
of Conference: 17–20 June 2019. https://doi.org/10.1109/PIERS-Spring46901.2019.9017606
9. Micheli, D., & Diamanti, R. Statistical analysis of interference in a real LTE access network by massive collection of MDT radio
measurement data from smartphones. In 2019 PhotonIcs & Electromagnetics Research Symposium - Spring (PIERS-Spring). Date
of Conference: 17–20 June 2019. https://doi.org/10.1109/PIERS-Spring46901.2019.9017353.
10. Scaloni, A., Cirella, P., Sgheiz, M., Diamanti, R. & Micheli, D. Multipath and Doppler characterization of an electromagnetic
environment by mas-sive MDT measurements from 3 g and 4 g mobile terminals. IEEE Access 7, 13024–13034. https://doi.org/
10.1109/ACCESS.2019.2892864 (2019).
11. Mizzi, C. et al. Unraveling pedestrian mobility on a road network using ICTs data during great tourist events. EPJ Data Sci. 7(1),
44. https://doi.org/10.1140/epjds/s13688-018-0168-2 (2018).
12. Technical Specification Group Radio Access Network; Universal Terrestrial Radio Ac-cess (UTRA) and Evolved Universal Ter-
restrial Radio Access (E-UTRA); Radio meas-urement collection for Minimization of Drive Tests (MDT)—Overall Description,
2011.
13. Scaloni, A., & Micheli, D. Estimation of mobility direction of a people flux by using a live 3G radio access network and smartphones
in nonconnected mode. In IEEE 15th International Conference on Environment and Electrical Engineering, pp. 1869–1873 (2015).
14. Suryawanshi, S. S. Methods to improve cell efficiency in wireless communication: A review. Electron. Telecommun. 3(4), 1 (2016).
15. da Silva Benoit, A. G. M. & Petry, A. Evaluation of F10.7, sun-spot number and photon flux data for ionosphere TEC modeling
and prediction using machine learning techniques. Atmosphere 12(9), 1202. https://doi.org/10.3390/atmos12091202 (2021).
16. U.S. Dept. of Commerce, NOAA, Space Weather Prediction Center. 10.7 cm Solar Flux Forecast Verification. https://www.swpc.
noaa.gov/sites/default/files/images/u30/F10.7%20Solar%20Flux.pdf
17. Ho, C., Slobin, S., Kantak, A., Asmar, S. Solar Brightness Tem-perature and Corresponding Antenna Noise Temperature at Micro-
wave Frequencies (IPN Progress Report 42–175—November 15, 2008).
Acknowledgements
This article received generous support from Christian Monstein, retired Senior Radio Engineer at IRSOL/ETHZ
and is currently responsible for hardware and software associated with the e-CALLISTO international network of
Scientific Reports | (2022) 12:9324 | https://doi.org/10.1038/s41598-022-13358-z 12
Vol:.(1234567890)www.nature.com/scientificreports/
solar radio spectrometers, promptly responding to questions related to solar emissions recording and proactively
providing many useful indications.
Author contributions
G.M. and D.M. conceived the study. G.M. developed the software for data analysis and related figures. T.G.
supervised all the issues related to the astrophysical aspects of the study. All the authors provided critical recom-
mendations on the significance of the data results in relation to the current available literature. All the authors
supported the writing of the manuscript and actively contributed to the discussion of the results.
Competing interests
The authors declare no competing interests.
Additional information
Correspondence and requests for materials should be addressed to D.M.
Reprints and permissions information is available at www.nature.com/reprints.
Publisher’s note Springer Nature remains neutral with regard to jurisdictional claims in published maps and
institutional affiliations.
Open Access This article is licensed under a Creative Commons Attribution 4.0 International
License, which permits use, sharing, adaptation, distribution and reproduction in any medium or
format, as long as you give appropriate credit to the original author(s) and the source, provide a link to the
Creative Commons licence, and indicate if changes were made. The images or other third party material in this
article are included in the article’s Creative Commons licence, unless indicated otherwise in a credit line to the
material. If material is not included in the article’s Creative Commons licence and your intended use is not
permitted by statutory regulation or exceeds the permitted use, you will need to obtain permission directly from
the copyright holder. To view a copy of this licence, visit http://creativecommons.org/licenses/by/4.0/.
© The Author(s) 2022
Scientific Reports | (2022) 12:9324 | https://doi.org/10.1038/s41598-022-13358-z 13
Vol.:(0123456789)You can also read