Shifts in the Abundances of Saprotrophic and Ectomycorrhizal Fungi With Altered Leaf Litter Inputs
←
→
Page content transcription
If your browser does not render page correctly, please read the page content below
ORIGINAL RESEARCH
                                                                                                                                                   published: 21 July 2021
                                                                                                                                           doi: 10.3389/fpls.2021.682142

                                             Shifts in the Abundances of
                                             Saprotrophic and Ectomycorrhizal
                                             Fungi With Altered Leaf Litter Inputs
                                             Sara Marañón-Jiménez 1,2*, Dajana Radujković 3 , Erik Verbruggen 3 , Oriol Grau 1,2,4 ,
                                             Matthias Cuntz 5 , Josep Peñuelas 1,2 , Andreas Richter 6 , Marion Schrumpf 7 and
                                             Corinna Rebmann 8
                                             1
                                              Center for Ecological Research and Forestry Applications (CREAF), Bellaterra, Spain, 2 Spanish National Research Council
                                             (CSIC), Global Ecology Unit CREAF-CSIC-UAB, Bellaterra, Spain, 3 Centre of Excellence Plant and Ecosystems (PLECO),
                                             Department of Biology, University of Antwerp, Antwerp, Belgium, 4 French Agricultural Research Centre for International
                           Edited by:        Development (CIRAD), Joint Research Unit Ecology of Guianan Forests-UMR EcoFoG (AgroParisTech, CNRS, INRA,
        Camille Eichelberger Granada,        University of Antilles, University of Guyane), Kourou, French Guiana, 5 Université de Lorraine, French National Institute of
             Universidade Do Vale Do         Agricultural Research, AgroParisTech, UMR 1434 Silva, Nancy, France, 6 Department of Microbiology and Ecosystem
              Taquari–Univates, Brazil       Science, University of Vienna, Wien, Austria, 7 Department for Biogeochemical Processes, Max Planck Institute for
                                             Biogeochemistry, Jena, Germany, 8 UFZ-Helmholtz Centre for Environmental Research, Department of Computational
                         Reviewed by:
                                             Hydrosystems, Leipzig, Germany
                        Valeria Prigione,
                University of Turin, Italy
                           Erica Lumini,     Ectomycorrhizal (EcM) and saprotrophic fungi interact in the breakdown of organic
         Institute for Sustainable Plant
Protection, National Research Council
                                             matter, but the mechanisms underlying the EcM role on organic matter decomposition
                             (CNR), Italy    are not totally clear. We hypothesized that the ecological relations between EcM and
                          Evelise Bach,
                                             saprotroph fungi are modulated by resources availability and accessibility, determining
  Federal University of Rio Grande Do
                               Sul, Brazil   decomposition rates. We manipulated the amount of leaf litter inputs (No-Litter, Control
                   *Correspondence:          Litter, Doubled Litter) on Trenched (root exclusion) and Non-Trenched plots (with roots)
                Sara Marañón-Jiménez         in a temperate deciduous forest of EcM-associated trees. Resultant shifts in soil fungal
              s.maranon@creaf.uab.es
                                             communities were determined by phospholipid fatty acids and DNA sequencing after 3
                    Specialty section:       years, and CO2 fluxes were measured throughout this period. Different levels of leaf litter
          This article was submitted to      inputs generated a gradient of organic substrate availability and accessibility, altering the
          Plant Symbiotic Interactions,
                a section of the journal
                                             composition and ecological relations between EcM and saprotroph fungal communities.
             Frontiers in Plant Science      EcM fungi dominated at low levels of fresh organic substrates and lower organic matter
            Received: 17 March 2021          quality, where short-distances exploration types seem to be better competitors, whereas
             Accepted: 22 June 2021          saprotrophs and longer exploration types of EcM fungi tended to dominate at high levels
             Published: 21 July 2021
                                             of leaf litter inputs, where labile organic substrates were easily accessible. We were,
                             Citation:
   Marañón-Jiménez S, Radujković D,         however, not able to detect unequivocal signs of competition between these fungal
     Verbruggen E, Grau O, Cuntz M,          groups for common resources. These results point to the relevance of substrate quality
   Peñuelas J, Richter A, Schrumpf M
  and Rebmann C (2021) Shifts in the
                                             and availability as key factors determining the role of EcM and saprotroph fungi on litter
    Abundances of Saprotrophic and           and soil organic matter decay and represent a path forward on the capacity of organic
   Ectomycorrhizal Fungi With Altered        matter decomposition of different exploration types of EcM fungi.
                    Leaf Litter Inputs.
         Front. Plant Sci. 12:682142.        Keywords: CO2 fluxes, Gadgil effect, ectomycorrhiza fungal exploration types, litter decomposition, soil fungal
      doi: 10.3389/fpls.2021.682142          communities, plant detritus

Frontiers in Plant Science | www.frontiersin.org                                    1                                              July 2021 | Volume 12 | Article 682142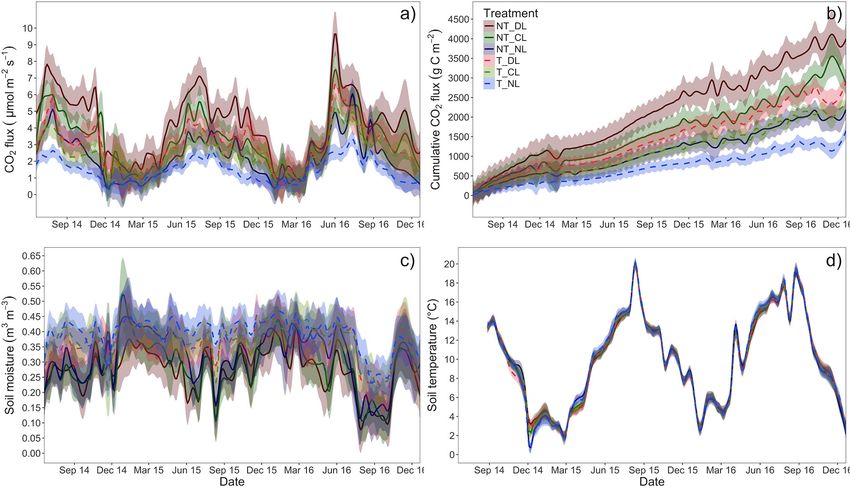
Marañón-Jiménez et al.                                                                                                        Litter Inputs on Soil Fungi

INTRODUCTION                                                                   different evolutionary strategies for their acquisition. Changes
                                                                               in substrates quality and availability can, therefore, drive shifts
Plants adjust the amount of carbon (C) invested in above-                      in the composition and abundance of EcM and saprotrophic
vs. belowground parts in response to soil nutrient availability                fungi thereby modulating their ecological interactions and the
to optimize biomass returns of invested carbon (Shipley and                    decomposition rates of organic matter as a result.
Meziane, 2002; Dybzinski et al., 2011). Accordingly, plants                       In order to elucidate how resource availability govern the
have been shown to allocate more C to mycorrhizal fungi in                     ecological feedbacks between saprotrophs and EcM fungal
exchange for nutrients at elevated CO2 and lower nutrient                      communities, we manipulated the amount of leaf litter inputs
availability (Treseder, 2004; Alberton et al., 2005; Högberg et al.,           (No-Litter “NL,” Control Litter “CL,” Doubled Litter “DL”)
2010; Phillips et al., 2011). Shifts in the amount of above- and               on Trenched (“T,” root exclusion) and Non-Trenched plots
belowground organic matter inputs to the soil may also shape the               (“NT,” with roots) of a temperate deciduous forest composed
composition and activity of fungal communities (Yarwood et al.,                of ectomycorrhiza-associated species (oak and beech). Resultant
2009; de Graaff et al., 2010; Kaiser et al., 2010), with potential             shifts in the diversity and composition of soil fungal communities
implications for decomposition rates of organic matter and soil                as detected by ITS1 metabarconding and phospholipid fatty acids
C storage.                                                                     (PLFAs) and in the microbial biomass, dissolved organic C,
    EcM and saprotrophic fungi interact in the breakdown of                    and C and N stocks were determined after 3 years, and CO2
litter-derived organic substrates, determining the decomposition               fluxes were measured throughout this period. We hypothesized
rates, the fate and the stabilization of soil organic matter (SOM)             that: (1) Changes in the availability and accessibility of organic
(Lindahl and Tunlid, 2015). Many EcM fungi have the ability                    substrates in soil in response to altered leaf litter inputs
to produce oxidative enzymes for the breakdown of organic                      modulate the dominance and ecological interactions between
compounds (Bödeker et al., 2009; Nicolás et al., 2019), which                  EcM and saprotroph fungi; (2) Conditions of limited access
can alter the degradability of residual SOM by the saprotroph                  to organic substrates will benefit EcM over saprotroph fungi,
community (Rineau et al., 2012). However, EcM fungi may                        leading to exacerbated competition between both groups for
also compete with the saprotrophic community for limiting                      N sources, while plentiful and easily accessible organic matter
water, nutrients or space (Lindahl et al., 2001; Koide and Wu,                 inputs will benefit the proliferation of saprotrophs and relax
2003; Bödeker et al., 2016). This competition has been long                    the competition; (3) The exclusion of EcM fungi in Trenched
hypothesized to slow down decomposition rates (i.e., “Gadgil                   plots will, therefore, increase saprotrophic abundance and
effect,” Gadgil and Gadgil, 1971, 1975), leading to the prediction             decomposition rates in a larger extent at low litter inputs,
of larger C storage in forest soils (Orwin et al., 2011; Averill et al.,       resulting in a higher increase in the litter-derived CO2 flux at
2014). Nonetheless, EcM fungi have shown both no effect (Mayor                 “Control Litter” inputs compared to “Doubled Litter” inputs.
and Henkel, 2006; but see McGuire et al., 2010) and a stimulation
of decomposition rates (Entry et al., 1991; Zhu and Ehrenfeld,                 MATERIALS AND METHODS
1996; Brzostek et al., 2015) and the mechanisms underlying the
EcM role on organic matter decomposition are not totally clear                 Study Site
(Fernandez and Kennedy, 2015).                                                 The study was conducted in a mixed deciduous forest (“Hohes
    Despite sharing common ancestors (Tedersoo et al., 2010),                  Holz”) in the area of the Magdeburger Boerde in central Germany
                                                                                      ′          ′
saprotrophs and ectomycorrhiza fungi have evolved into two                     (52◦ 05 N, 11◦ 13 E, 210 m above sea level). Climate in the
fungal groups with well-differentiated resource needs and                      study area is subatlantic-submontane. Mean annual temperature
acquisition strategies. Some EcM guilds have retained the                      is 9.1◦ C (climatic period 1981–2010, station Ummendorf of
capacity to breakdown organic nitrogen (N) substrates (Shah                    German Weather Service), with mean minimum temperature in
et al., 2016; Nicolás et al., 2019) and can exploit litter selectively         the coldest month (January) of 0.7◦ C, and mean maximum of
for N (Rineau et al., 2012; Bödeker et al., 2014). The direct supply           the warmest month (July) of 18.3◦ C. Annual mean precipitation
of C from the plant host may confer an advantage to EcM fungi                  was 563 mm during the climatic period 1981–2010, while annual
when organic substrates are not easily available, allowing them                precipitation during the experiment measured locally at the site
to allocate more resources to exploit and acquire N (Rineau                    was 550 mm in 2015 and 390 mm in 2016. The forest stand is
et al., 2013; Lindahl and Tunlid, 2015). In line with this, fungal             located in a mainly municipal forest area, managed by regional
communities have shown segregated niche distribution with                      forestry. The experiment was conducted inside a 1 ha fenced
depth, where saprotrophs dominate in organic and cellulose-                    area with ungulate enclosure since 2011, composed of sessile
rich litter layers and EcM fungi are more abundant at greater                  oak [Quercus petraea (Matt.) Liebl.] and European beech (Fagus
depths, where the acquisition of N from more recalcitrant organic              sylvatica L.) as the dominant species (45 and 38% of total
substrates also requires higher energy investment (Lindahl et al.,             basal area, respectively) with accompanying hornbeam (Carpinus
2007; Baldrian et al., 2012). Saprotrophic decomposition may                   betulus L., 13%) and birch (Betula pendula Roth, 4%). Tree height
be progressively restricted as the organic substrates become less              and diameter at breast height were 27.0 ± 11.9 (SD) m, and 0.38
accessible and the energy return of their decomposition declines               ± 0.2 m on average for beech and oak. The bedrock is Pleistocene
(Baldrian, 2009; Sterkenburg et al., 2018). This niche segregation             sandy loess above till and Mesozoic muschelkalk, with Haplic
may be then the consequence of the specialization of each fungal               Cambisol as predominant soil type. Soil texture at 0–20 cm depth
group on divergent target resources and the development of                     was 3.0 ± 1.8% sand, 87.1 ± 2.1% silt, and 10.0 ± 2.2% clay,

Frontiers in Plant Science | www.frontiersin.org                           2                                      July 2021 | Volume 12 | Article 682142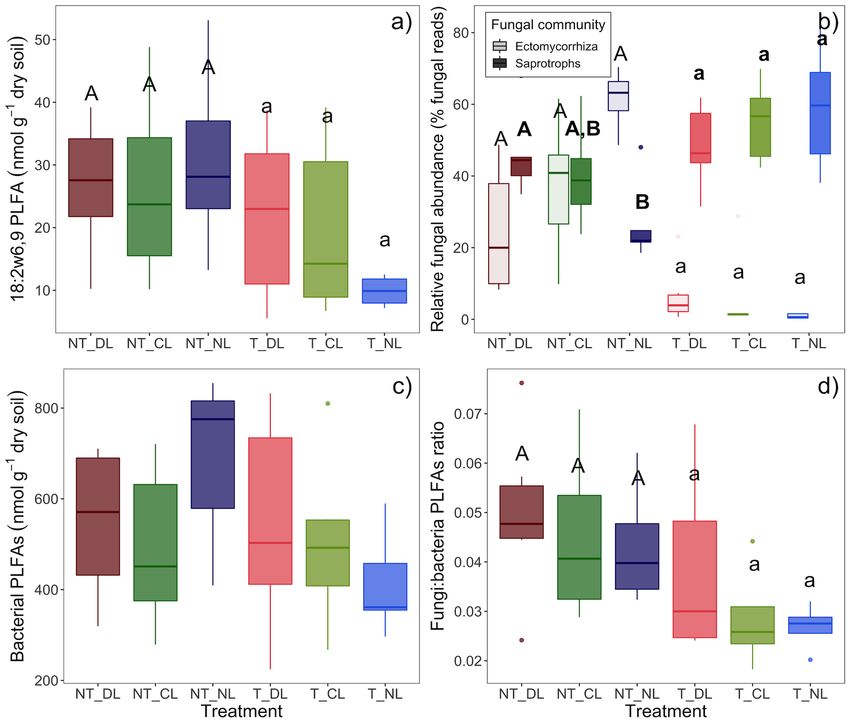
Marañón-Jiménez et al.                                                                                                                                 Litter Inputs on Soil Fungi

TABLE 1 | Initial soil parameters measured prior to the establishment of the trenching and leaf litter input treatments.

Soil depth (cm)                          SOC (%)                             TN (%)                            C:Nsoil              Soil depth (cm)                ρsoil (g cm−3 )

0–5                                    5.67 ± 0.39                       0.335 ± 0.020                      16.71 ± 0.26                 0–5                       1.15 ± 0.07
5–15                                   2.14 ± 0.17                       0.121 ± 0.008                      17.48 ± 0.33
15–30                                  0.79 ± 0.05                       0.051 ± 0.002                      15.02 ± 0.38                20–25                      1.35 ± 0.03
30–60                                  0.31 ± 0.02                       0.035 ± 0.001                      9.025 ± 0.41                40–45                      1.49 ± 0.02
60–100                                 0.22 ± 0.01                       0.032 ± 0.001                       6.78 ± 0.27                60–65                      1.55 ± 0.02

SOC, soil organic carbon; TN, total soil nitrogen; C:Nsoil , soil C:N ratios; ρsoil , soil bulk density.

with a pH of 8.0. The main soil variables determined before the                                         temperature at 10 cm depth using a probe thermometer (DET3R,
experiment establishment are described in Table 1.                                                      Voltcraft, Wernberg-Köblitz, Germany), and with volumetric
                                                                                                        water content using a soil moisture probe (8100-204 Delta-
Experimental Design                                                                                     T ThetaProbe, Cambridge, UK). Measurements were generally
Three levels of leaf litter inputs (No-Litter “NL,” Control Litter                                      performed between 8 am to 4 pm. The order of measurement was
“CL,” Doubled Litter “DL”) were established in pairs of Trenched                                        rotated among the blocks and treatments over the campaigns.
(“T,” root exclusion) and Non-Trenched plots (“NT,” with roots)                                         Vegetation cover was estimated visually from 0 to 100% for each
following a factorial randomized block design. For this, five                                           campaign (Sutherland, 1996). Vegetation inside the collars was
blocks were randomly distributed over 1 ha area, each one                                               not removed in the case of Non-Trenched plots. Thus, CO2
consisting of one trenched plot and a similar non-trenched                                              fluxes reported in this study could include some above-ground
plot of 2×3 m each, within a distance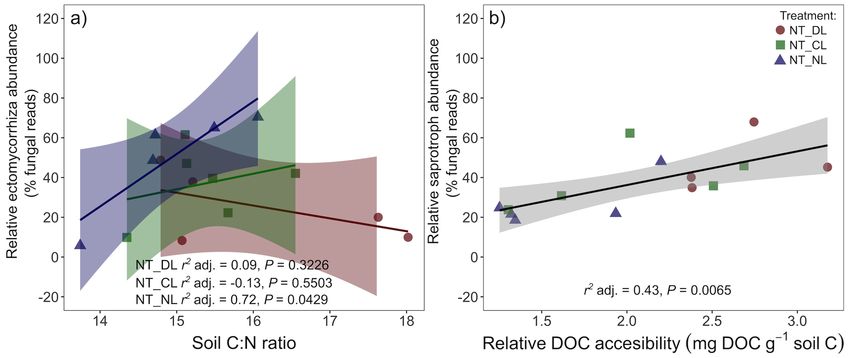
Marañón-Jiménez et al.                                                                                                                      Litter Inputs on Soil Fungi

 FIGURE 1 | (a) Location of the paired Trenched and Non-Trenched plots in the study area. (b) Scheme of the experimental design showing the distribution of the
 trenching and leaf litter input treatments within each block.

the total amount of litter and organic layer falling within the                      subsample was fumigated with CHCl3 for 24 h in vacuum to
quadrant perimeter was collected. No roots were found growing                        release the nutrients from the microbial biomass (fumigation-
in the litter layer. Litter samples were then oven dried at 60◦ C,                   extraction method; Jenkinson and Powlson, 1976), after which
weighted, ground and thereby homogenized prior to the C and N                        the soil was also extracted with 0.05 M K2 SO4 as above. Dissolved
elemental analysis.                                                                  organic C (DOC) in fumigated and non-fumigated K2 SO4
                                                                                     extracts was determined with a vario TOC cube (Elementar
Soil Extractions and Chemical Analyses                                               Analysensysteme GmbH, Hanau) and microbial C (Cmicro ) was
A 6 g subsample of fresh mineral soil was extracted with 30 ml                       determined from the difference of DOC between fumigated
of 0.05M K2 SO4 within 24 h of soil sampling. Another 6 g                            and non-fumigated subsamples. We were only interested in

Frontiers in Plant Science | www.frontiersin.org                                 4                                             July 2021 | Volume 12 | Article 682142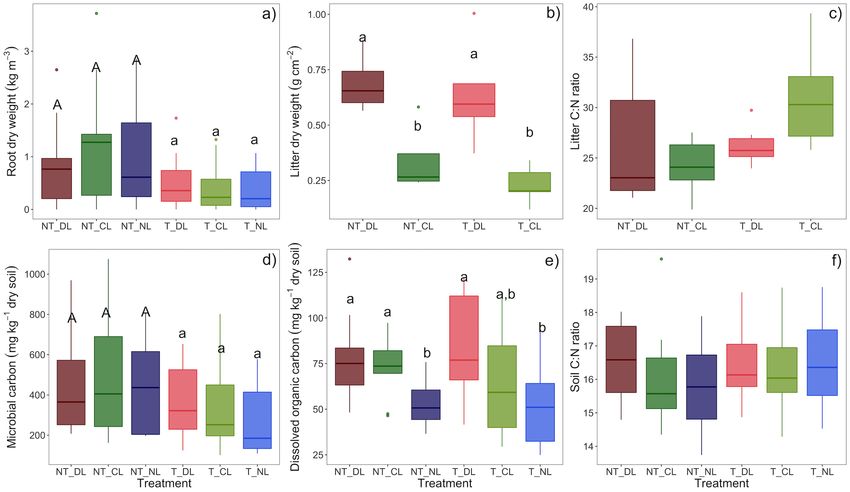
Marañón-Jiménez et al.                                                                                                       Litter Inputs on Soil Fungi

relative differences among treatments, so the concentrations in               England Biolabs, Ispwich, MA, USA). PCR conditions were as
the microbial fraction presented here were not corrected for                  follows: initial denaturation step at 98◦ C for 60 s, followed by
extraction efficiency.                                                        35 cycles of: denaturation step at 98◦ C for 30 s, annealing at
   Total soil inorganic C, organic C (SOC), total soil N (TN),                55◦ C for 30 s, extension at 72◦ C for 30 s; and final extension
total litter C, and total litter N were determined from dry and               step of 72◦ C for 10 min. The mixture for the second PCR
homogenized soil and litter samples by dry combustion with an                 contained 2.5 µl of 50 × diluted PCR product and 0.1 µM of
Elemental Analyzer (VarioMax CN, Elementar Analysensysteme                    dual barcoded primers with Illumina adapters. The conditions
GmbH, Hanau, Germany for soil samples and Vario EL II,                        were: initial step at 98◦ C for 60 s, 12 cycles: at 98◦ C for 10 s,
Elementar Analysensysteme GmbH, Hanau, Germany for litter                     63◦ C for 30 s, 72◦ C for 30 s; and 72◦ C for 5 min. Following
samples). C:N ratios of soil (C:Nsoil ) and leaf litter (C:Nsoil ) were       the gel electrophoresis (1.5% agarose gel) successful amplicons
calculated on a mass basis. The relative accessibility of the DOC             were normalized and purified from PCR artifacts using the
pool was calculated as its ratio to the SOC pool. All fractions are           SequalPrep Normalization Plate Kit (ThermoFisher Scientific;
presented relative to dry mass.                                               Waltham, MA, USA). Samples were then pooled into a single
                                                                              library and purified using QIAquick Gel Extraction Kit (Qiagen;
Phospholipids Fatty Acid Analyses                                             Venlo, the Netherlands). Subsequently, the library was quantified
Soil samples from the upper 5 cm of soil were freeze-dried                    with qPCR (KAPA Library Quantification Kits, Kapa Biosystems,
and total lipids were extracted with a mixture of chloroform,                 Wilmington, MA, USA) and sequenced on the Illumina MiSeq
methanol and citrate buffer (1:2:0.8, v/v/v) and fractionated by              platform (Illumina Inc; San Diego, CA, USA) with 300 cycles for
solid-phase extraction on silica columns according to Gorka                   paired-end reads.
et al. (2019). Phospholipids were derivatized to methyl esters
via alkaline methanolysis and dried under a constant stream of                Bioinformatic Analyses
N2 . Resulting fatty acid methyl esters were re-dissolved in iso-             The bioinformatics analyses were performed using the
octane and identified and quantified on a gas chromatograph                   USEARCH software following the UPARSE pipeline (Edgar,
(Agilent 7890B GC; Santa Clara, CA, USA) coupled to a time-                   2013). The sequences were first trimmed to 250 bp, forward
of-flight mass spectrometer (Pegasus HT; LECO corporation,                    and reverse reads were merged and primers were removed.
Saint-Joseph, MI, USA) on a DB5 column (60 m × 0.25 mm                        Quality filtering was performed using a maximum expected
× 0.25 µm). Bacterial fatty acid methyl esters (BAME CP mix,                  error threshold of 0.5. After dereplication and singleton removal
Supelco; 37 Component FAME mix, Supelco) were used as                         the sequences were clustered into operational taxonomic
qualitative standards. Prior to methylation nonadecanoic acid                 units (OTUs) based on 97% similarity using the UPARSE-
(19:0) was added to samples and used as an internal standard                  OTU algorithm (Edgar, 2013) yielding 810 OTUs in total.
for quantification.                                                           The original reads were then mapped to the OTUs with the
    PLFA 18:2ω6,9 was used as an indicator of fungal abundance                identity threshold of 0.97. The sequence counts of all samples
(Olsson, 1999). Since the proportions of individual PLFA differ               (abundances matrixes) were normalized by random subsampling
between different types of bacteria (Ratledge and Wilkinson,                  to the minimal number of reads per sample (2,986 sequences,
1988) and we were not interested on the shifts of bacterial                   rarefaction) to avoid potential artifacts due to library size and
communities, we grouped the bacterial PLFA to produce less                    lower the false discovery rates (Weiss et al., 2017). We calculated
variable results and ease the interpretation (Frostegård and                  rarefied OTU accumulation curves (“vegan” R package; Oksanen
Bååth, 1996; Zelles, 1999). Nonetheless, shifts in bacterial                  et al., 2020) to explore the completeness of our sampling. While
communities were also explored in order to check potential                    rarefaction curves indicated that additional sequencing depth
effects on the abundances of saprotrophic and ectomycorrhizal                 would yield additional taxa in most samples, depth was relatively
fungi. Beta-hydroxil, cyclopropane, and branched chain PLFAs                  balanced among the treatments (Supplementary Figure 1A), so
were considered bacterial PLFAs (Zelles, 1999; Ruess and                      unlikely to bias the abundance patterns after subsampling to a
Chamberlain, 2010). The ratio between fungal and bacterial                    common read number.
PLFAs was calculated and considered an indicator of fungal to                     The OTUs were taxonomically assigned by comparing
bacterial biomass ratio. Total PLFAs were considered as a further             representative sequences to the UNITE database (Kõljalg et al.,
estimation of total microbial biomass.                                        2015) (release date 01.08.2015), using the BLAST algorithm with
                                                                              default settings. The OTUs were assigned to particular taxa by
DNA Extraction and Sequencing                                                 selecting the hits with the lowest E-value and with a minimum
DNA was extracted from 0.25 to 0.35 g of the mineral soil                     alignment length of 75 bp. OTUs were subsequently assigned to
samples using the DNeasy PowerSoil Kit (Qiagen, Venlo, the                    functional groups if their genus was successfully matched with
Netherlands) following the manufacturer’s protocol. The first                 one of the genera whose trophic type have been described in
PCR was performed using ITS1f and ITS2 primers (Smith and                     Tedersoo et al. (2014). If the trophic type at the genus level
Peay, 2014) with Illumina Nextera labels (Illumina Inc; San                   was unknown, trophic type was assigned at family level if more
Diego, CA, USA) targeting fungal ITS1 region. The 25 µl                       than 80% of genera within that family, containing at least four
reaction mixtures contained 2 µl of DNA template, 480 nM                      genera, belonged to the same trophic type. EcM fungi were
forward and reverse primers and 1X PCR buffer, 200 µM of each                 further assigned to different exploration types (contact, short,
dNTPsand 1 U of Phusion High-Fidelity DNA polymerase (New                     short-medium, medium and long) based on the description of

Frontiers in Plant Science | www.frontiersin.org                          5                                      July 2021 | Volume 12 | Article 682142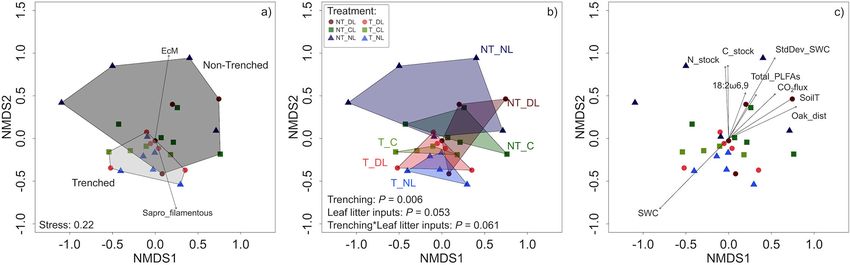
Marañón-Jiménez et al.                                                                                                      Litter Inputs on Soil Fungi

functional traits of EcM genera in Lilleskov et al. (2011). As             effect of root and leaf litter inputs on the relative abundances
a result, 46.3% of total OTUs were assigned to a trophic type              of each group and to account for the variation in the relative
and 98.2% of OTUs assigned to EcM fungi could be grouped                   abundance of different functional groups and EcM exploration
into an exploration type, which are similar to the percentages             types amongst the samples. We then used the “envfit” function
found in global studies on fungal functional ecology (e.g.,                (“vegan” R package; Oksanen et al., 2020) to fit the relative
Tedersoo et al., 2014).                                                    abundances of different functional groups and the environmental
                                                                           variables onto the NMDS ordination. Environmental variables
Statistical Analyses                                                       were previously standardized.
The effect of root and litter inputs on monthly soil CO2 fluxes,               The dissimilarity between pairs of samples of each root
soil temperature and soil moisture and its variation along the             and leaf litter input treatment levels (i.e., beta-diversity) was
time was tested by repeated measures ANOVAs split-plot design,             calculated using the Bray-Curtis distances to the centroid
with trenching and litter input as main fixed factors between              (“vegdist” and “betadisper” functions from “vegan” R package),
subjects, and date as factor within subjects. The analysis was thus        and the homogeneity of multivariate group of dispersions
run using mean monthly values per each treatment combination               was then tested using multi-factor analyses of variance for
and block, which allowed us to produce integrated data of soil             dissimilarity matrices (“dissmfacw” function from “TraMineR”
respiration per month. The excess of CO2 flux caused by the                R package, Studer and Ritschard, 2016). Since the dispersion
addition the litter inputs (hereafter “litter-derived CO2 flux”) was       around centroids of soil fungal communities differed significantly
calculated as the difference of CO2 fluxes between levels with             among trenching levels (see Fungal community shifts in Results
litter inputs (DL and CL) and the correspondent litter exclusion           section), the effect of root and leaf litter treatments on the
level (NL) in Trenched (root exclusion) and Non-Trenched                   fungal community composition was tested using analyses of
plots (root presence). Litter-derived CO2 fluxes, as calculated            deviance for multivariate generalized linear models (“manyglm”
here, have previously been shown to be reliable indicators for             R function from “mvabund” R package, Wang et al., 2012), with
long-term litter decomposability and litter carbon dynamics                trenching and leaf litter inputs as fixed factors, block as a random
(Bowden et al., 1993; Aerts and Caluwe, 1997; Xiao et al., 2014).          factor and a negative binomial as a link function.
Nonetheless, these fluxes should be interpreted as metric of                   The effect of root and leaf litter inputs on leaf litter variables,
the effect (direct and indirect) of the litter addition on CO2             PLFAs groups and on the relative abundances of saprotrophic
fluxes, and not as a strict measure of C released exclusively from         and EcM fungi was tested by two-ways ANOVAs, with trenching
the litter. The effect of trenching, leaf litter inputs and their          and leaf litter inputs as fixed factors. The effect of each factor
interactions on the mean and CO2 excess flux was tested using              was further explored by one-way ANOVAs for each trenching
two-ways ANOVAs, with trenching and leaf litter inputs as fixed            and leaf litter input level. Similarly, the effect of leaf litter
factors. Differences among leaf litter inputs levels within each           inputs on EcM exploration types in NT plots (root trenching
trenching level were further tested by post-hoc tests with Tukey           suppressed virtually all EcM fungi) was tested by one-ways
correction for multiple testing.                                           ANOVAs with leaf litter inputs as fixed factor. Correlations
    The effect of trenching, leaf litter inputs, soil depth and            between the relative abundances of different fungal trophic types
their interactions on soil DOC, Cmicro , SOC, TN, C:Nsoil , ρsoil ,        and EcM exploration types and the soil and environmental
and on root biomass was tested using three-ways ANOVAs,                    variables were also explored by Pearson correlations.
with trenching, leaf litter inputs and soil depth as fixed factors.            Variables were transformed when required to improve
The effect of trenching and leaf litter inputs was also tested             normality and homoscedasticity (Quinn and Keough, 2009).
on the same variables averaged across soil depths using two-               Statistical analyses and model construction were performed using
ways ANOVAs, since the effect of soil depth was consistent                 JMP 13.0 (SAS Institute) and R v.3.4.3 (R Core Team, 2016). All
across treatments (no interactions with the rest of factors).              results are presented as means ± standard errors.
Differences among leaf litter inputs levels within each trenching
level were further tested by post-hoc tests with Tukey correction          RESULTS
for multiple testing.
    We investigated the similarity of the soil fungal communities          Soil Variables and Microbial Biomass
amongst root and leaf litter inputs treatments by non-metric               Trenching reduced the amount of roots present in the soil, which
multidimensional scaling (NMDS) ordinations with the read-                 was consistent across leaf litter input levels and depths (Table 2;
abundance data using the Bray–Curtis index (“BiodiversityR”                Figure 2a). Leaf litter manipulation treatments also successfully
package; Kindt and Coe, 2005). For exploratory purposes                    altered the amount of leaf litter decomposing over the soil
and to check the robustness of the data, we also performed                 surface. As such, the dry weight of litter per unit of surface at the
ordinations using non-rarefied data, giving similar results                DL litter input treatment was approximately twice the amount
(Supplementary Figure 2). We calculated the relative abundance             of litter in the C litter input treatment both in T and NT plots
of the different functional groups (number of reads of a                   (Table 2; Figure 2b), and the amount of leaf litter decomposing
given functional group/total number of reads per sample) and               over the soil surface did not differ between T and NT plots.
the relative abundance of the different EcM exploration types              Litter C and N percentages were also similar across leaf litter and
(number of reads of a given EcM exploration type/total number              root litter inputs (Table 2), without changes in C:N ratios across
of reads of identified EcM fungi per sample) to assess the                 treatments (Figure 2c).

Frontiers in Plant Science | www.frontiersin.org                       6                                        July 2021 | Volume 12 | Article 682142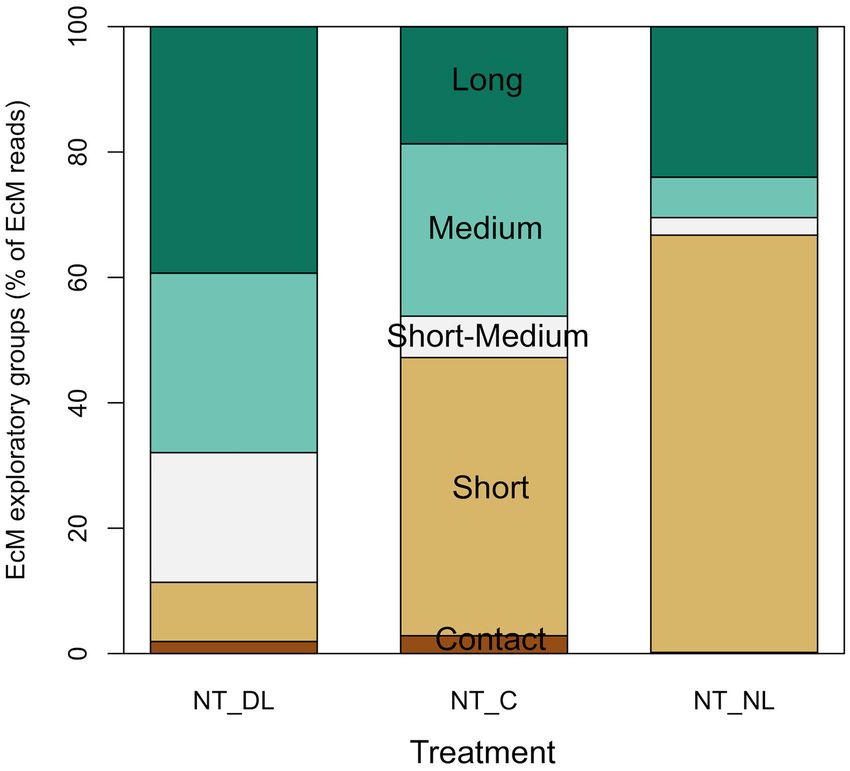
Marañón-Jiménez et al.                                                                                                                                                   Litter Inputs on Soil Fungi

TABLE 2 | Results of the ANOVAs on soil and microbial fractions and root and leaf litter variables.

Factor                                      Trenching           Leaf litter         Depth              Trenching*Leaf           Trenching*Depth               Leaf litter          Trenching*Leaf
                                                                  input                                  litter input                                       input*Depth                 litter
                                                                                                                                                                                     input*Depth

DOC                                             0.76             12.39***          25.21***                 1.31                        1.21                      0.3                     0.08
Cmicro                                        14.27***             1.12            105.21***                1.01                        0.09                      0.2                     0.12
SOC                                             0.01               0.76            77.34***                  0.1                        0.24                     0.05                     0.31
TN                                              0.08               0.69            106.18***                0.22                        0.05                     0.03                     0.25
C:Nsoil                                         0.58               0.51            12.50***                 0.34                        1.28                     0.82                     0.02
ρsoil                                           0.36               0.42               0.01                  0.05                        0.27                     0.03                     0.19
Dry weight roots                               7.27**              0.03             10.11**                 0.18                        0.88                     1.13                     1.22
Dry weight litter                               2.48             30.38***                                   0.77
Clitter                                         0.00               0.56                                     0.92
Nlitter                                         1.81               0.15                                     0.04
C:Nlitter                                       3.53               0.44                                     3.32
18:2ω6,9 PLFA                                  7.25*                0.4                                     1.06
Bacterial PLFAs                                 2.01                0.8                                     0.22
Fungal:bacterial PLFAs                         8.35**              1.00                                     0.22
Total PLFAs                                    7.10*               0.01                                     1.48
Relative EcM abundance                        59.55***             1.21                                     4.30*
Relative Saprotrophs abundance                12.13**              0.38                                     3.43*
Contact-distances EcM                                              1.27
Short-distances EcM                                                1.97
Short-medium-distances EcM                                         4.23*
Medium-distances EcM                                               0.55
Long distances EcM                                                 0.63

Values of the F statistic are presented. The effects of trenching, leaf litter inputs, soil depth, and their interactions are shown. The effect of soil depth is not applicable for litter variables.
The effect of soil depth and trenching is not applicable for ectomycorrhiza exploration types, since the root trenching suppressed virtually all ectomycorrhizal fungi. DOC, Dissolved
organic carbon; Cmicro , microbial carbon; SOC, soil organic carbon; TN, total soil nitrogen; C:Nsoil , soil C:N ratios; ρsoil , soil bulk density; Clitter , carbon concentration in litter; Nlitter ,
nitrogen concentration in litter; C:Nlitter , C:N ratios in litter; PLFAs, phospholipid fatty acids. Statistically significant effects are marked in bold. * 0.01 < P ≤ 0.05; ** 0.001 < P ≤ 0.01; *** P
≤ 0.001.

   Microbial biomass was consistently higher in NT plots across                                         (Table 3; Figure 3c). Soil CO2 fluxes, soil temperature, fungal
soil depths (0–5 and 5–10 cm), but it was not affected significantly                                    and total PLFAs, soil C and N stocks and the distance to the
by the amount of litter addition (Table 2; Figure 2d). On the                                           closer oak tree showed an increasing gradient in the direction
contrary, the soil DOC increased consistently with the amount                                           of NT plots. Fungal communities were also more heterogeneous
of leaf litter inputs, but not with the presence of roots (Table 2;                                     (higher pair-wise dissimilarities) in presence of roots than when
Figure 2e). Neither the amount of leaf litter nor the root                                              roots were excluded (F = 2.09, P = 0.001, Figure 3b), while
exclusion by trenching provoked significant changes in SOC, soil                                        dissimilarities were not altered by litter inputs. Nonetheless,
TN, C:N ratios or soil bulk density 3 years after the experiment                                        dissimilarity indices showed highest values in the combined NT
establishment (Table 2; Figure 2f), and therefore, treatments did                                       and NL plots.
not affect soil C and N stocks significantly either. DOC, microbial                                         In accordance with microbial biomass, fungal PLFA 18:2ω6,9,
biomass C, SOC, and TN decreased consistently with soil depth                                           total PLFAs and fungal to bacterial PLFA ratios were higher at
(Table 2), while the soil C:N ratios showed an increase at the                                          NT plots (Table 2; Figures 4a,d) as well as Actinobacteria (P =
sub-superficial 5–15 cm depth (Table 1).                                                                0.0264), while effect of leaf litter inputs on these PLFA groups was
                                                                                                        not statistically significant. Bacterial PLFA, by contrast, was not
Fungal Community Shifts                                                                                 affected by the trenching or litter addition treatments (Figure 4c),
The root exclusion by trenching altered the fungal communities                                          and the same was true for Gram positive and Gram negative
present in the upper 5 cm of mineral soil and drastically                                               bacteria separately, and for Eukariota microbial communities.
reduced the proportion of EcM fungi DNA reads (Table 3;                                                     The reduction of EcM fungi by root trenching is also
Figure 3a). By contrast, T plots showed a higher proportion                                             evidenced by a 94–73% decrease in their relative abundances
of saprotrophs, particularly of filamentous fungi. The amount                                           (Table 2; Figure 4b). Overall, relative EcM abundances were
of leaf litter inputs also altered the composition of soil fungal                                       not significantly affected by the leaf litter inputs, but they
communities (Figure 3b), with a marginal interaction between                                            increased in NT plots with decreasing leaf litter inputs, causing
root and leaf litter inputs. Soil moisture was higher and less                                          a significant effect of leaf litter inputs in NT plots (P =
variable (lower standard deviation) where roots were excluded                                           0.0346) and a significant Trenching∗ Leaf litter input interaction

Frontiers in Plant Science | www.frontiersin.org                                                   7                                                      July 2021 | Volume 12 | Article 682142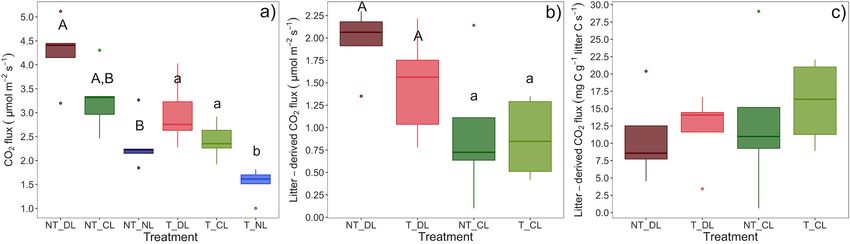
Marañón-Jiménez et al.                                                                                                                            Litter Inputs on Soil Fungi

 FIGURE 2 | (a) Root biomass, (b) leaf litter biomass, (c) leaf litter C:N ratios, (d) microbial biomass carbon, (e) dissolved organic carbon, and (f) soil C:N ratios in
 each of the root and leaf litter input treatments. Averaged values of 0–5 and 5–10 cm soil depths for the case of root and soil variables. Box-plots represent the values
 of n = 5 plots per treatment. Different letter case indicates significant effect of trenching according two-ways ANOVA. Different letters indicate significant differences
 among leaf litter input levels within each trenching level. Microbial biomass carbon is not corrected for extraction efficiency. NT_DL, Non-Trenched and Doubled Litter;
 NT_CL, Non-Trenched and Control Litter; NT_NL, Non-Trenched and No-Litter; T_DL, Trenched and Doubled Litter; T_CL, Trenched and Control Litter; T_NL,
 Trenched and No-Litter.

(P = 0.0248). EcM relative abundance in NT plots was positively                             The high variability in the relative abundance of fungal groups
correlated with soil C:N ratios in absence of leaf litter inputs                         among blocks and within treatments was associated, besides to
(NL, Figure 5a), whereas the slopes of this correlation decreased                        spatial variability of soil properties and microclimate, to the
progressively with the amount of leaf litter inputs (CL and DL).                         differences in the distances from roots of the different tree species
Contrary to the relative EcM abundances, the relative abundances                         (oak and beech). We detected positive correlations between the
of saprotrophic fungi increased in T plots. Leaf litter inputs also                      distance to the nearest oak tree and the relative abundance of
did not have an overall effect on saprotrophs relative abundances,                       ectomycorrhizal fungi (P = 0.0034, R2 = 0.7032) and negative
but they increased with leaf litter inputs in NT plots, causing                          correlations with the relative abundances of plant pathogen (P
a marginal leaf litter effect on NT plots (P = 0.0814) and a                             = 0.0076, R2 = 0.6584) and arbuscular mycorrhizal fungi (P
significant Trenching∗ Leaf litter input interaction (P = 0.0474,                        = 0.056, R2 = 0.6767) in NT plots. In the same plots, there
Figure 4b). Saprotroph relative abundance in NT plots was,                               were also positive correlations between the distances to the
moreover, positively correlated with the DOC accessibility in soil                       nearest beech tree and the relative abundances of arbuscular
relative to total SOC (Figure 5b).                                                       mycorrhiza (P = 0.0016, R2 = 0.7391) and plant pathogen fungi
    The amount of leaf litter inputs also determined the presence                        (P = 0.0007, R2 = 0.7723).
of EcM fungal communities with different exploration strategies
in NT plots (Figure 6), although the effect of leaf litter input                         Soil CO2 Fluxes
was not significant in all the exploration types due to the                              Soil CO2 fluxes were consistently highest in NT and increased
high variability among blocks (Table 2). Short-medium, medium                            with leaf litter inputs (DL > CL > NL) (Table 4; Figures 7a, 8a),
and long-distances exploration types of EcM fungi tended to                              without significant interactions between trenching and leaf litter
dominate at doubled leaf litter inputs (P = 0.0939 for the sum                           inputs. Nonetheless, the excess of CO2 flux associated to litter
of these exploration types and P = 0.0406 for short-medium                               inputs did not differ significantly between T and NT (Figure 8b)
distances), while short-distance exploration strategies tended to                        and differences between litter input levels also disappeared when
be more abundant, although not significantly, in absence of leaf                         fluxes were standardized per unit of leaf litter C, although fluxes
litter inputs.                                                                           were slightly lower in NT plots (Figure 8c). Soil CO2 fluxes also

Frontiers in Plant Science | www.frontiersin.org                                     8                                               July 2021 | Volume 12 | Article 682142
Marañón-Jiménez et al. Litter Inputs on Soil Fungi
TABLE 3 | Regression weights of the variables fitted in the NMDS analysis in Figure 3c.
Category Variable NMDS1 NMDS2 r2 P
Trophic type Animal parasite −0.710 −0.704 0.089 0.313
Plant pathogen −0.587 −0.809 0.033 0.628
Mycoparasite −0.666 −0.746 0.090 0.287
Sapro Brown rot 0.312 0.950 0.025 0.679
Sapro Filamentous 0.287 −0.958 0.445 0.002
Sapro White rot −0.907 −0.422 0.103 0.263
Sapro Yeast −0.930 −0.368 0.023 0.751
Arbuscular mycorrhiza −0.481 −0.877 0.019 0.803
Ectomycorrhiza 0.163 0.987 0.587 0.001
Soil and environmental variables Soil bulk density 0.47735 0.87871 0.0891 0.317
% Stones 0.85290 −0.52207 0.0360 0.610
Inorganic C 0.78558 −0.61876 0.0077 0.901
Distance to closer oak 0.90257 0.43055 0.3629 0.003
Distance to closer beech −0.92891 −0.37031 0.0643 0.448
Root biomass 0.23218 0.97267 0.1468 0.138
Soil moisture −0.70474 −0.70947 0.6324 0.001
Soil moisture S.D. 0.51806 0.85534 0.5492 0.001
Soil temperature 0.85110 0.52500 0.3300 0.011
Soil temperature S.D. −0.60766 −0.79420 0.0430 0.595
Soil CO2 flux 0.72530 0.68843 0.2739 0.025
Litter dry weight 0.64275 −0.76608 0.0341 0.644
Litter C 0.58819 −0.80872 0.0484 0.552
Litter N 0.61027 −0.79219 0.0435 0.586
Litter C:N ratio 0.65895 −0.75219 0.0435 0.590
SOC −0.86350 −0.50435 0.1256 0.206
TN −0.91565 −0.40198 0.0634 0.445
Soil C:N ratio −0.78242 −0.62276 0.3075 0.052
DOC −0.61375 −0.78950 0.0730 0.372
Microbial biomass C 0.33463 0.94235 0.1121 0.237
Soil C stock −0.01278 0.99992 0.3497 0.008
Soil N stock −0.04971 0.99876 0.3396 0.009
C18:2ω6,9 PLFA 0.43539 0.90024 0.2387 0.050
Total PLFAs 0.57168 0.82047 0.2384 0.040
r2 , Squared Pearson correlation; P, Critical probability of the analysis. Statistically significant effects are marked in bold.
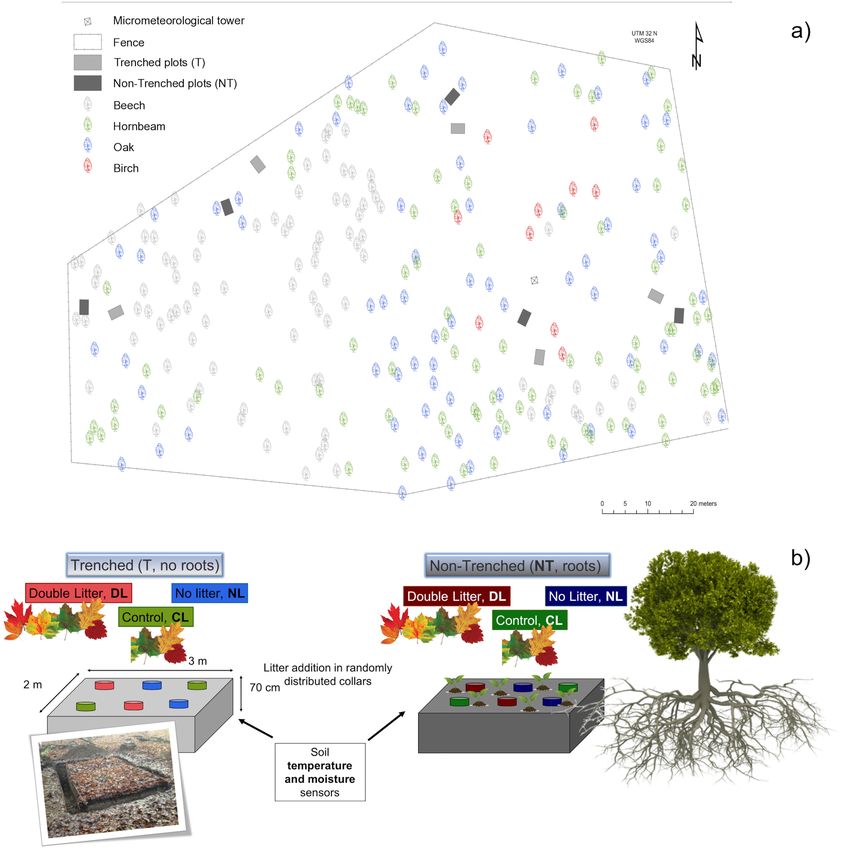
varied with time (Table 4), with a lower contribution from roots generates ecological niches for different fungal trophic types
during winter and a higher contribution from leaf litter from (saprotrophs vs. EcM fungi) and EcM lineages (EcM exploration
early summer to autumn (Figures 7a,b). types) that are favored according to their resource demands
Soil temperature in the upper 10 cm of soil was not affected and acquisition strategies, determining their abundances. As
by the presence of roots or the amount of litter inputs to the soil a result, substrate availability and accessibility may modulate
(Table 4; Figure 7c). By contrast, soil moisture was lowest in NT the ecological relations between EcM and saprotrophic fungal
plots, where roots were present (Table 4; Figure 7d), particularly communities and, ultimately, the relative role of EcM vs.
during the growing season. saprotroph fungi on litter decay and SOM transformation.
Mechanisms Modulating the ecological
DISCUSSION
Relations Between EcM and Saprotrophic
The ecological relations between EcM and saprotroph fungi can Fungi
determine the fate of SOM and soil C stabilization (Lindahl and Fungal communities in soil are largely structured by the
Tunlid, 2015; Wang et al., 2017). The amount of aboveground availability of limiting substrates (Waldrop et al., 2006; Cline
litter inputs modulates the availability and accessibility of organic and Zak, 2015), among other factors. We hypothesized that the
substrates in soil. We present evidences suggesting that this amount of leaf litter inputs, which generates a range of availability
Frontiers in Plant Science | www.frontiersin.org 9 July 2021 | Volume 12 | Article 682142Marañón-Jiménez et al. Litter Inputs on Soil Fungi FIGURE 3 | Non-metric multidimensional matrix of soil fungal communities in the trenching and leaf litter inputs treatments. (a) Trenching levels are indicated by shaded polygons and relative abundances of fungal trophic types represented by vectors. (b) Leaf litter levels are indicated by different colored polygons. (c) Gradient direction and strength of environmental variables indicated by vectors. Only variables with a P < 0.05 are shown. EcM, ectomycorrhiza abundance; Sapro_filamentous, filamentous saprotroph abundance; SWC, soil moisture; N_stock, soil N stock; C_stock, soil C stock; 18:2ω6,9, 18:2ω6,9 PLFA; StdDev_SWC, soil moisture standard deviation; Total_PLFAs, Total PLFAs; CO2 flux, CO2 flux; SoilT, soil temperature; Oak_dist, distance to the closest oak tree; NT_DL, Non-Trenched and Doubled Litter; NT_CL, Non-Trenched and Control Litter; NT_NL, Non-Trenched and No-Litter; T_DL, Trenched and Doubled Litter; T_CL, Trenched and Control Litter; T_NL, Trenched and No-Litter. and accessibility of organic substrates in soil, determines the Europe and US (Arnolds, 1991; Peter et al., 2001; Averill et al., ecological interactions between EcM and saprotroph fungi and 2018; Jo et al., 2019). The removal of litter and humus layer have creates diverse niches in which the most adapted fungal guilds been actually used as practices to restore EcM fungal diversity are selected according to their resource demands and acquisition (Baar and Kuyper, 1998; Smit et al., 2003). Trees generally reduce strategies. Increasing amounts of litter inputs certainly created the belowground C allocation to EcM fungi with increasing N a gradient of dissolved organic C in the upper 10 cm of soil, availability at regional or larger scales (Phillips et al., 2011). both in Trenched and Non-Trenched plots (Table 2; Figure 2e), At the moderate levels of soil N availability in our study, low although soil organic C, total soil N concentrations and C:N decomposition and N mineralization rates in the litter exclusion ratios did not show significant changes after 3 years of altered treatment may have acted as a local stress signal for the trees, root and leaf litter inputs (Table 2; Figure 2f). The root exclusion increasing root elongation, exudation, and the C supply to EcM succeeded in suppressing virtually all ectomycorrhizal fungi fungi to enhance N acquisition in exchange (Drew, 1975; Hodge, (Figure 4b), contributing to the decrease in the total microbial 2005). biomass C, fungal and total PLFAs in soil (Table 2; Figures 2d, The direct access to plant host sugars may also facilitate 4a). Microbial biomass C and fungal PLFAs however did not EcM fungi an efficient interception and immobilization of N change in response to the DOC gradient created in soil by leaching through the soil (Pena et al., 2013) and the production the litter manipulation, but the relative abundances of EcM of extracellular peroxidases needed to acquire the N sequestered and saprotroph fungi shifted with leaf litter inputs in Non- in complex recalcitrant compounds (Smith and Read, 2008; Trenched plots (Figures 3b, 4b). The amount of litter inputs Bödeker et al., 2009; Lindahl and Tunlid, 2015). Accordingly, therefore selected different fungal communities according to Steidinger et al. (2019) have shown that EcM trees dominate in their resources demands and acquisition strategies, altering the climatic areas of low decomposition rates. Moreover, the amount abundances of saprotrophic and EcM fungi. C transferred from roots to EcM fungi have shown to decrease Saprotrophs increased with leaf litter inputs and with soil drastically in presence of saprotroph wood-decomposing fungi DOC accessibility in Non-Trenched plots (Figure 5b), which (Leake et al., 2001). It is therefore likely that litter inputs, evidences the higher reliance of saprotrophs on fresh and organic matter quality and nutrient availability interact to select accessible organic substrates compared to EcM fungi. On the functionally distinct fungi, affecting in turn, plant nutrition and other hand, EcM fungal abundance increased progressively with C allocation. decreasing leaf litter inputs, and they proliferated more at higher Our results point to the emergence of divergent specialization soil C:N ratios in absence of leaf litter inputs (NL, Figure 5a). strategies to the available substrates, but we were not able to Conditions of limited access to organic substrates in NL resulted detect unequivocal signs of competition between saprotrophs advantageous for EcM, where they resulted better competitors at and EcM fungi for common resources. Despite the relative lower organic matter quality. Declines in EcM fruiting bodies, abundance of saprotroph fungi increased when EcM fungi EcM species richness and dominance have been reported in were excluded in Trenched plots (Figure 4b), trenching also response to increases in the litter layer and N deposition in decreased the total fungal abundance (Figure 4a), precluding Frontiers in Plant Science | www.frontiersin.org 10 July 2021 | Volume 12 | Article 682142
Marañón-Jiménez et al.                                                                                                                            Litter Inputs on Soil Fungi

 FIGURE 4 | Abundance estimations of soil microbial groups in the trenching and leaf litter inputs treatments. (a) 18:2ω6,9 PLFA marker (fungal abundance), (b)
 relative abundances of saprotrophic and ectomycorrhizal fungi (% of fungal DNA reads), (c) sum of bacterial PLFAs, (d) ratio of fungal to bacterial PLFAs. Box-plots
 represent the values of n = 5 plots per treatment. Different letter case indicates significant effect of trenching according two-ways ANOVA, different letters indicate
 significant differences among leaf litter input levels within each trenching level according one-ways ANOVA. In (b), bold letters indicate treatment effects on
 saprotrophic fungi and normal letters indicate treatment effects on ectomycorrhizal fungi. NT_DL, Non-Trenched and Doubled Litter; NT_CL, Non-Trenched and
 Control Litter; NT_NL, Non-Trenched and No-Litter; T_DL, Trenched and Doubled Litter; T_CL, Trenched and Control Litter; T_NL, Trenched and No-Litter.

to detect significant changes in the absolute abundances of                              differ significantly between Trenched (without EcM fungi) and
saprotrophs between T and NT plots. The proportion of                                    Non-Trenched plots (with EcM fungi) (Figure 8c). If any, the
unassigned OTUs may have had some contribution on the lack                               inhibiting effect of EcM fungi on litter decomposition rates was
of unequivocal signs of competition between ectomycorrhizal                              very low to be detected in this case, considering that lower
and saprotrophic fungi. The proportion of unassigned OTUs                                levels of soil moisture in presence of roots (Table 4; Figure 7d)
was higher in Trenched plots (Supplementary Figure 3, P =                                may have also contributed to underestimate the litter-associated
0.003), which most likely belong to saprotrophic fungi, since                            excess CO2 flux in Non-Trenched plots. Smith and Wan, 2019
EcM fungi are fairly well-known and well-represented in the                              have recently found that ectomycorrhizal fungi slow leaf litter
DNA databases. Nonetheless, our data do not show a clear                                 decomposition only in forests where litter inputs are highly
deceleration of decomposition rates in presence of EcM fungi.                            recalcitrant. In agreement to that, soil C:N ratios in our study
The litter-derived CO2 fluxes per unit of litter C did not                               (Table 1) were relatively low compared to other studies where

Frontiers in Plant Science | www.frontiersin.org                                    11                                              July 2021 | Volume 12 | Article 682142
Marañón-Jiménez et al.                                                                                                                            Litter Inputs on Soil Fungi

 FIGURE 5 | Correlation between the (a) relative abundance of ectomycorrhizal fungi and the soil C:N ratios in the different leaf litter input treatments in Non-Trenched
 plots and (b) the relative abundance of saprotroph fungi and the relative accessibility of the soil DOC pool in Non-Trenched plots. The relative accessibility of the DOC
 pool was calculated as the ratio of DOC to the SOC pool in soil. r2 adj. = Adjusted Pearson correlation. Shaded areas indicate the 95% confidence intervals. NT_DL,
 Non-Trenched and Doubled Litter; NT_CL, Non-Trenched and Control Litter; NT_NL, Non-Trenched and No-Litter; T_DL, Trenched and Doubled Litter; T_CL,
 Trenched and Control Litter; T_NL, Trenched and No-Litter.

                                                                                         Higher N availability in these soils and the specialization of
                                                                                         EcM and saprotroph fungi on divergent target substrates may
                                                                                         have allowed them to co-exist without any apparent signs of
                                                                                         competition. In support to that, Kyaschenko et al. (2017) found a
                                                                                         higher proliferation of saprotrophs, oxidative enzymatic activities
                                                                                         and N cycling in fertile sites with higher productivity and N
                                                                                         availability, whereas EcM fungi suppressed enzymatic oxidation
                                                                                         in less fertile soils. Similarly, Sterkenburg et al. (2018) showed
                                                                                         that the effect of EcM fungi on decomposition rates changed
                                                                                         across stages of SOM decomposition, where EcM fungi slow
                                                                                         down litter decomposition at the soil surface but accelerate
                                                                                         SOM decomposition at deeper soil layers. Taken together, these
                                                                                         results support the idea that the influence of EcM fungi on litter
                                                                                         and SOM decay is strongly context dependent (Fernandez and
                                                                                         Kennedy, 2015; Zak et al., 2019), where N availability, SOM
                                                                                         quality and the accessibility of organic substrates are key factors
                                                                                         that will determine the structure of the soil fungal community,
                                                                                         their ecological relations and the net effect of EcM fungi on
                                                                                         SOM transformation.
 FIGURE 6 | Shifts in the relative abundances of ectomycorrhizal fungi groups
 of different exploratory strategies for each leaf litter input treatment. Only          Shifts in Exploration Types of EcM Fungi
 abundances of ectomycorrhizal fungi in Non-Trenched plots are presented,                EcM fungal communities were not only more successful when
 since the root trenching suppressed virtually all ectomycorrhizal fungi. NT_DL,         organic substrates were scarce, but they can also optimize
 Non-Trenched and Doubled Litter; NT_CL, Non-Trenched and Control Litter;
                                                                                         resource acquisition through different exploration strategies
 NT_NL, Non-Trenched and No-Litter; T_DL, Trenched and Doubled Litter;
 T_CL, Trenched and Control Litter; T_NL, Trenched and No-Litter.                        according to available substrates (Agerer, 2006; Tedersoo and
                                                                                         Smith, 2013). Short-distances exploration types of EcM fungi
                                                                                         tended to dominate in the litter exclusion treatment (Figure 6),
a negative effect of EcM fungi on litter decomposition rates                             although the effect was not statistically significant. These EcM
have been reported (Gadgil and Gadgil, 1971, 1975; Koide and                             guilds are argued to predominantly utilize simple N forms or
Wu, 2003; C:N = 26 and C:N = 43.6, respectively). Higher                                 byproducts from advanced stages of decomposition (ammonium,
soil temperatures may have also contributed to faster microbial                          nitrate and simple aminoacids, Hobbie and Agerer, 2010). Short-
mineralization rates and N release from SOM in our case.                                 distances EcM fungi also invest lower amounts of C on hyphae

Frontiers in Plant Science | www.frontiersin.org                                    12                                              July 2021 | Volume 12 | Article 682142
Marañón-Jiménez et al. Litter Inputs on Soil Fungi TABLE 4 | Summary of Repeated Measures Analysis of Variance (rmANOVA) for the monthly means of soil CO2 fluxes, soil temperature, and soil moisture. Source Soil CO2 flux Soil temperature Soil moisture Between-subject df F P df F P df F P Trenching 1, 24 19.97 0.0002 1, 24 0.02 0.8813 1, 24 21.43
Marañón-Jiménez et al.                                                                                                                              Litter Inputs on Soil Fungi

 FIGURE 8 | (a) Mean CO2 flux, (b) CO2 flux excess associated to the leaf litter inputs taking the No-Litter treatment as a baseline in each of the trenching and leaf
 litter input treatments and (c) CO2 flux excess associated to the leaf litter inputs per unit of leaf litter carbon. Box-plots represent the values of n = 5 plots per
 treatment. Different letter case indicates significant effect of trenching (a) or litter (b) according two-ways ANOVAs. Different letters indicate significant differences
 among leaf litter inputs (a) or trenching levels (b) within each level of the other factor. NT_DL, Non-Trenched and Doubled Litter; NT_CL, Non-Trenched and Control
 Litter; NT_NL, Non-Trenched and No-Litter; T_DL, Trenched and Doubled Litter; T_CL, Trenched and Control Litter; T_NL, Trenched and No-Litter.

litter (Rineau et al., 2013). These results represent an open door                        and accession number(s) can be found at: Sequence Read
to future research on the role that different exploration types of                        Archive (SRA, http://www.ncbi.nlm.nih.gov/bioproject/747155,
EcM fungi may have on litter decomposition.                                               BioProject ID PRJNA74715). Data on soil variables and CO2
                                                                                          fluxes are archived and publicly available at the online archives of
CONCLUSIONS                                                                               the Helmholtz Centre for Environmental Research GmbH - UFZ
                                                                                          (https://www.ufz.de/record/dmp/archive/7013/de/ and https://
The ecological interaction between saprotroph and EcM fungal                              www.ufz.de/record/dmp/archive/7016/de/, respectively).
communities can have crucial implications for organic matter
decomposition and soil C stabilization. Our results show                                  AUTHOR CONTRIBUTIONS
the proliferation of saprotrophs and EcM fungi of different
exploration types based on their acquisition strategies and                               SM-J, CR, and MC conceived the research. SM-J, DR, EV, AR, MS,
the available target substrates. The amount of leaf litter                                and CR contributed data. SM-J conducted analyses, generated
inputs, and consequently, substrate availability and accessibility,                       figures, and prepared the original draft. All authors provided
modulated the abundances of these fungal groups and their                                 comments on the manuscript.
ecological relations. EcM fungi were generally favored at low
levels of leaf litter inputs and lower SOM quality, where
short-distances exploration types may be more competitive,                                FUNDING
whereas saprotrophs and longer exploration types of EcM
                                                                                          This research was supported by the European Union’s Seventh
fungi tended to dominate at high levels of leaf litter inputs
                                                                                          Framework Programme and the Ministry of Economy,
and accessibility of labile organic substrates. These patterns, if
                                                                                          Innovation, Science and Employment of the Junta de Andalucía
confirmed in further studies, may have important implications
                                                                                          (postdoctoral fellowship of the Andalucía Talent Hub Program,
for decomposition rates in the face of global driven changes
                                                                                          Marie Skłodowska-Curie actions, COFUND—Grant agreement
in plant allocation patterns. Accordingly, saprotroph fungi may
                                                                                          No. 291780, to SM-J), the European Union’s Horizon 2020
have a key contribution on the breakdown of organic substrates
                                                                                          Research and Innovation Programme (Marie Skłodowska-
at increasing levels of aboveground tree productivity and leaf
                                                                                          Curie grant agreement No. 750252 to SM-J), the Serra Hunter
litter inputs, whereas the role of EcM fungi on enhancing
                                                                                          fellowship Programme from the regional government of
plant N acquisition may become increasingly relevant at low
                                                                                          Catalonia, the European Research Council Synergy grant 610028
levels of plant aboveground litter inputs. These results also
                                                                                          (IMBALANCE-P), as well as by the German Federal Ministry
represent a path forward for future experiments testing the role
                                                                                          of Education and Research—INFLUINS (03 IS 2001 A) and
of different EcM exploration types of fungi on litter and SOM
                                                                                          ICOS-D (01LK1224G).
decomposition rates.

DATA AVAILABILITY STATEMENT                                                               ACKNOWLEDGMENTS
The datasets presented in this study can be found in                                      We thank the forestry office of Hohes Holz for lending the land
online repositories. The names of the repository/repositories                             and their support in the maintenance of the research sites. Special

Frontiers in Plant Science | www.frontiersin.org                                     14                                                July 2021 | Volume 12 | Article 682142
Marañón-Jiménez et al. Litter Inputs on Soil Fungi
thanks goes to all members of the field-research group of the SUPPLEMENTARY MATERIAL
UFZ Department Computational Hydrosystems for their support
during field and lab experiments, in particular to Sebastian The Supplementary Material for this article can be found
Gimper, Hendrik Zöphel, Laura Dienstbach, and Inmaculada online at: https://www.frontiersin.org/articles/10.3389/fpls.2021.
García Quirós. 682142/full#supplementary-material
REFERENCES seminal root system, and the shoot, in barley. New Phytol. 75, 479–490.
doi: 10.1111/j.1469-8137.1975.tb01409.x
Aerts, R., and Caluwe, H. (1997). Initial litter respiration as indicator for Dybzinski, R., Farrior, C., Wolf, A., Reich, P. B., and Pacala, S. W. (2011).
long-term leaf litter decomposition of Carex species. Oikos 80, 353–361. Evolutionarily stable strategy carbon allocation to foliage, wood, and fine roots
doi: 10.2307/3546603 in trees competing for light and nitrogen: an analytically tractable, individual-
Agerer, R. (2006). Fungal relationships and structural identity of their based model and quantitative comparisons to data. Am. Nat. 177, 153–166.
ectomycorrhizae. Mycol. Prog. 5, 67–107. doi: 10.1007/s11557-006-0505-x doi: 10.1086/657992
Alberton, O., Kuyper, T. W., and Gorissen, A. (2005). Taking mycocentrism Edgar, R. C. (2013). UPARSE: highly accurate OTU sequences from microbial
seriously: mycorrhizal fungal and plant responses to elevated CO2 . New Phytol. amplicon reads. Nat. Methods 10, 996–998. doi: 10.1038/nmeth.2604
167, 859–868. doi: 10.1111/j.1469-8137.2005.01458.x Entry, J. A., Rose, C. L., and Cromack, K. (1991). Litter decomposition
Arnolds, E. (1991). Decline of ectomycorrhizal fungi in Europe. Agric. Ecosyst. and nutrient release in ectomycorrhizal mat soils of a Douglas fir
Environ. 35, 209–244. doi: 10.1016/0167-8809(91)90052-Y ecosystem. Soil Biol. Biochem. 23, 285–290. doi: 10.1016/0038-0717(91)
Averill, C., Dietze, M. C., and Bhatnagar, J. M. (2018). Continental-scale nitrogen 90065-R
pollution is shifting forest mycorrhizal associations and soil carbon stocks. Fernandez, C. W., and Kennedy, P. G. (2015). Revisiting the ‘Gadgil effect’: do
Glob. Chang. Biol. 24, 4544–4553. doi: 10.1111/gcb.14368 interguild fungal interactions control carbon cycling in forest soils? New Phytol.
Averill, C., Turner, B. L., and Finzi, A. C. (2014). Mycorrhiza-mediated 209, 1382–1394. doi: 10.1111/nph.13648
competition between plants and decomposers drives soil carbon storage. Nature Frostegård, A., and Bååth, E. (1996). The use of phospholipid fatty acid analysis
505, 543–545. doi: 10.1038/nature12901 to estimate bacterial and fungal biomass in soil. Biol. Fertil. Soils 22, 59–65.
Baar, J., and Kuyper, T. W. (1998). Restoration of aboveground doi: 10.1007/s003740050076
ectomycorrhizal flora in stands of pinus sylvestris (Scots Pine) in The Gadgil, R. L., and Gadgil, P. D. (1971). Mycorrhiza and litter decomposition.
Netherlands by removal of litter and humus. Restor. Ecol. 6, 227–237. Nature 233:133. doi: 10.1038/233133a0
doi: 10.1046/j.1526-100X.1998.00635.x Gadgil, R. L., and Gadgil, P. D. (1975). Suppression of litter decomposition by
Baldrian, P. (2009). Ectomycorrhizal fungi and their enzymes in soils: is there mycorrhizal roots of Pinus radiata. N. Z. J. For. Sci. 5, 35–41.
enough evidence for their role as facultative soil saprotrophs? Oecologia 161, Gorka, S., Dietrich, M., Mayerhofer, W., Gabriel, R., Wiesenbauer, J., Martin,
657–660. doi: 10.1007/s00442-009-1433-7 V., et al. (2019). Rapid transfer of plant photosynthates to soil bacteria via
Baldrian, P., Kolarik, M., Stursova, M., Kopecky, J., Valaskova, V., Vetrovsky, ectomycorrhizal hyphae and its interaction with Nitrogen availability. Front.
T., et al. (2012). Active and total microbial communities in forest soil are Microbiol. 10:168. doi: 10.3389/fmicb.2019.00168
largely different and highly stratified during decomposition. ISME J. 6, 248–258. Hobbie, E. A., and Agerer, R. (2010). Nitrogen isotopes in ectomycorrhizal
doi: 10.1038/ismej.2011.95 sporocarps correspond to belowground exploration types. Plant Soil 327,
Bödeker, I., Lindahl, B. D., Olson, A., and Clemmensen, K. E. (2016). 71–83. doi: 10.1007/s11104-009-0032-z
Mycorrhizal and saprotrophic fungal guilds compete for the same organic Hodge, A. (2005). “Nitrogen in soils. Plant uptake,” in Encyclopedia of Soils in the
substrates but affect decomposition differently. Funct. Ecol. 30, 1967–1978. Environment, ed D. Hillel (Cambridge, MA: Academic Press), 39–46.
doi: 10.1111/1365-2435.12677 Högberg, M. N., Briones, M. J. I., Keel, S. G., Metcalfe, D. B., Campbell, C.,
Bödeker, I. T. M., Clemmensen, K. E., de Boer, W., Martin, F., Olson, Å., Midwood, A. J., et al. (2010). Quantification of effects of season and nitrogen
and Lindahl, B. D. (2014). Ectomycorrhizal Cortinarius species participate in supply on tree below-ground carbon transfer to ectomycorrhizal fungi and
enzymatic oxidation of humus in northern forest ecosystems. New Phytol. 203, other soil organisms in a boreal pine forest. New Phytol. 187, 485–493.
245–256. doi: 10.1111/nph.12791 doi: 10.1111/j.1469-8137.2010.03274.x
Bödeker, I. T. M., Nygren, C. M. R., Taylor, A. F. S., Olson, Å., and Jenkinson, D. S., and Powlson, D. S. (1976). Effects of biocidal treatments on
Lindahl, B. D. (2009). ClassII peroxidase-encoding genes are present in a metabolism in soil. 5. Method for measuring soil biomass. Soil Biol. Biochem.
phylogenetically wide range of ectomycorrhizal fungi. ISME J. 3, 1387–1395. 8, 209–213. doi: 10.1016/0038-0717(76)90005-5
doi: 10.1038/ismej.2009.77 Jo, I., Fei, S., Oswalt, C. M., Domke, G. M., and Phillips, R. P. (2019). Shifts in
Bowden, R. D., Nadelhoffer, K. J., Boone, R. D., Melillo, J. M., and Garrison, J. dominant tree mycorrhizal associations in response to anthropogenic impacts.
B. (1993). Contributions of aboveground litter, belowground litter, and root Sci. Adv. 5:6358. doi: 10.1126/sciadv.aav6358
respiration to total soil respiration in a temperate mixed hardwood forest. Can. Kaiser, C., Koranda, M., Kitzler, B., Fuchslueger, L., Schnecker, J., Schweiger,
J. For. Res. 23, 1402–1407. doi: 10.1139/x93-177 P., et al. (2010). Belowground carbon allocation by trees drives
Brzostek, E. R., Dragoni, D., Brown, Z. A., and Phillips, R. P. (2015). seasonal patterns of extracellular enzyme activities by altering microbial
Mycorrhizal type determines the magnitude and direction of root-induced community composition in a beech forest soil. New Phytol. 187, 843–858.
changes in decomposition in a temperate forest. New Phytol. 206, 1274–1282. doi: 10.1111/j.1469-8137.2010.03321.x
doi: 10.1111/nph.13303 Kindt, R., and Coe, R. (2005). Tree Diversity Analysis. A Manual and Software
Cline, L. C., and Zak, D. R. (2015). Soil microbial communities are shaped by plant- for Common Statistical Methods for Ecological and Biodiversity Studies. Nairobi:
driven changes in resource availability during secondary succession. Ecology 96, World Agroforestry Centre (ICRAF).
3374–3385. doi: 10.1890/15-0184.1 Koide, R. T., and Wu, T. (2003). Ectomycorrhizas and retarded
de Graaff, M.-A., Classen, A. T., Castro, H. F., and Schadt, C. W. (2010). decomposition in a Pinus resinosa plantation. New Phytol. 158, 401–407.
Labile soil carbon inputs mediate the soil microbial community composition doi: 10.1046/j.1469-8137.2003.00732.x
and plant residue decomposition rates. New Phytol. 188, 1055–1064. Kõljalg, U., Larsson, K. H., Abarenkov, K., et al. (2015). UNITE:
doi: 10.1111/j.1469-8137.2010.03427.x a database providing web-based methods for the molecular
Drew, M. C. (1975). Comparison of the effects of a localised supply of identification of ectomycorrhizal fungi. New Phytol. 166, 1063–1068.
phosphate, nitrate, ammonium and potassium on the growth of the doi: 10.1111/j.1469-8137.2005.01376.x
Frontiers in Plant Science | www.frontiersin.org 15 July 2021 | Volume 12 | Article 682142You can also read