Sentinel-3 radar altimetry for river monitoring - a catchment-scale evaluation of satellite water surface elevation from Sentinel-3A and Sentinel-3B
←
→
Page content transcription
If your browser does not render page correctly, please read the page content below
Hydrol. Earth Syst. Sci., 25, 333–357, 2021
https://doi.org/10.5194/hess-25-333-2021
© Author(s) 2021. This work is distributed under
the Creative Commons Attribution 4.0 License.

Sentinel-3 radar altimetry for river monitoring –
a catchment-scale evaluation of satellite water
surface elevation from Sentinel-3A and Sentinel-3B
Cecile M. M. Kittel1 , Liguang Jiang1 , Christian Tøttrup2 , and Peter Bauer-Gottwein1
1 Department   of Environmental Engineering, Technical University of Denmark, Kgs. Lyngby, 2800, Denmark
2 DHI-GRAS,     Hørsholm, 2970, Denmark

Correspondence: Cecile M. M. Kittel (ceki@env.dtu.dk)

Received: 14 April 2020 – Discussion started: 15 May 2020
Revised: 23 October 2020 – Accepted: 25 November 2020 – Published: 21 January 2021

Abstract. Sentinel-3 is the first satellite altimetry mission       must be adapted to handle the steep changes in the receiving
to operate both in synthetic aperture radar (SAR) mode and          window position. Finally, we extract Sentinel-3 observations
in open-loop tracking mode nearly globally. Both features           over key wetlands in the Zambezi basin. We show that clear
are expected to improve the ability of the altimeters to ob-        seasonal patterns are captured in the Sentinel-3 WSE, reflect-
serve inland water bodies. Additionally, the two-satellite con-     ing flooding events in the floodplains. These results highlight
stellation offers a unique compromise between spatial and           the benefit of the high spatiotemporal resolution of the dual-
temporal resolution with over 65 000 potential water targets        satellite constellation.
sensed globally. In this study, we evaluate the possibility of
extracting river water surface elevation (WSE) at catchment
level from Sentinel-3A and Sentinel-3B radar altimetry us-          1   Introduction
ing Level-1b and Level-2 data from two public platforms:
the Copernicus Open Access Hub (SciHub) and Grid Pro-               Monitoring river water levels is an important step in hydro-
cessing on Demand (GPOD). The objectives of the study               logical studies including characterization of river dynamics,
are to demonstrate that by using publicly available process-        flood monitoring and forecasting, and the planning and de-
ing platforms, such databases can be created to suit specific       signing of water resources infrastructure. The last decades
study areas for any catchment and with a wide range of ap-          have seen a steady decline in available water monitoring
plications in hydrology. We select the Zambezi River as a           information, particularly in Africa (Hannah et al., 2011;
study area. In the Zambezi basin, 156 virtual stations (VSs)        Vörösmarty et al., 2001). Furthermore, it is often imprac-
contain useful WSE information in both datasets. The root-          tical to measure water levels in floodplains in situ. In the
mean-square deviation (RMSD) is between 2.9 and 31.3 cm             last 25 years, satellite radar altimetry has therefore pro-
at six VSs, where in situ data are available, and all VSs reflect   vided an important alternative source of water surface eleva-
the observed WSE climatology throughout the basin. Some             tion (WSE) observations at so-called virtual stations (VSs),
VSs are exclusive to either the SciHub or GPOD datasets,            or crossings between the satellite tracks and river center line.
highlighting the value of considering multiple processing op-          Advancements in instrument design and processing tools
tions beyond global altimetry-based WSE databases. In par-          have steadily improved the accuracy of data products to the
ticular, we show that the processing options available on           order of decimeters (see, e.g., Vu et al. (2018) and Villadsen
GPOD affect the number of useful VSs; specifically, extend-         et al. (2016) for a summary of mission performance evalua-
ing the size of the receiving window considerably improved          tions across the literature). Satellite radar altimetry has been
data at 13 Sentinel-3 VSs. This was largely related to the im-      widely used in hydrological studies, for instance, to monitor
plementation of GPOD parameters. While correct on-board             and quantify storage variations at regional scale (e.g., Arsen
elevation information is crucial, the postprocessing options        et al., 2015; Jiang et al., 2017a; Boergens et al., 2017; Klein-

Published by Copernicus Publications on behalf of the European Geosciences Union.
334                                                     C. M. M. Kittel et al.: Sentinel-3 radar altimetry for river monitoring

herenbrink et al., 2015; Villadsen et al., 2015), to assess river   ing mode determines how the range window is repositioned
dynamics and estimate river discharge (e.g., Domeneghetti           as the satellite proceeds along its orbit. The positioning of
et al., 2014; Kittel et al., 2018; Michailovsky et al., 2013;       the range window, which is typically 60 m wide, ensures that
Schneider et al., 2017; Bogning et al., 2018) and to constrain      the echo reflected by expected surface targets is correctly
hydrologic/hydrodynamic model parameters (e.g., Getirana            recorded by the altimeter. CryoSat-2 and SARAL/AltiKa
and Peters-Lidard, 2013; Liu et al., 2015; Jiang et al., 2019b).    both operate in closed loop; that is, the range window is po-
Altimetry has proven extremely valuable in poorly gauged            sitioned based on information from previous measurements.
regions for hydrologic modeling. For example, in Kittel et al.      However, if the satellite fails to correctly record the river
(2018), WSE from Envisat and Jason-2 was used to calibrate          echo, e.g., in steep river valleys where the satellite records
a rainfall-runoff model of the Ogooué River. The observa-           the valley top instead of the valley bottom, the error will
tions supplemented historical discharge records by providing        be transmitted to future measurements as the satellite locks
contemporary observations of river levels and were shown to         on the wrong target. Studies have demonstrated this chal-
help constrain routing model parameters in the poorly gauged        lenge for steep river valleys, e.g., in France (Biancamaria
catchment.                                                          et al., 2018) and in China (Jiang et al., 2017b). In open-
   Wetlands and floodplains provide important economic and          loop mode, a priori information about the surface topogra-
ecological services and are intrinsically linked to river dy-       phy controls the range window position in the form of an
namics. Several studies have used altimetry WSE to char-            on-board lookup table, i.e., the Open-Loop Tracking Com-
acterize river–floodplain interactions (e.g., Park, 2020; Za-       mand (OLTC) tables. Previous studies have demonstrated
kharova et al., 2014; Ovando et al., 2018; da Silva et al.,         the advantages of open-loop tracking and have indicated that
2012; Dettmering et al., 2016). Park (2020) recently showed         Sentinel-3 is less affected by abrupt changes in topography,
the potential of using satellite altimetry for this purpose us-     provided the on-board elevation information is correct (Jiang
ing Jason-2 WSE in the Amazon, and Zakharova et al. (2014)          et al., 2020, 2019a). The OLTC is based on digital eleva-
assessed the seasonal variability of boreal wetlands in west-       tion model (DEM) information, which must be accurate and
ern Siberia using Envisat altimetry. Due to the temporal res-       up to date, as new dams, for instance, can alter the sur-
olution of Envisat (35 d), an interannual characterization of       face elevation significantly (Zhang et al., 2020). Sentinel-3
the wetland processes was not possible. By definition, the          is a marine and land mission, with the altimetric gauging of
satellite orbit is a compromise between spatial and temporal        inland water being a secondary objective to the ocean and
sampling. Dettmering et al. (2016) used Envisat altimetry to        ice topographic mission objectives (Drinkwater and Rebhan,
characterize water levels in the Pantanal wetlands, but their       2007). However, the OLTC tables on board Sentinel-3A and
methods were constrained by the accuracy of the method              Sentinel-3B contain a database of over 65 000 VSs, or hydro-
compared to the level variations in large regions of the Pan-       logical targets, defined using state-of-the-art water surface
tanal. They cited synthetic aperture radar (SAR) technology         masks and high-resolution DEMs. The OLTC is expected to
as a potential solution to overcome these limitations.              be a key factor in establishing global databases of water level
   The Sentinel-3 mission was developed by the European             and to be integrated on future altimetry missions (Le Gac
Space Agency (ESA) mission for the Copernicus program.              et al., 2019). It is therefore important to understand the im-
The mission currently operates in a two-satellite constel-          plications of the open-loop tracking mode and interactions
lation; Sentinel-3A and Sentinel-3B launched in Febru-              between the OLTC and postprocessing choices on the WSE
ary 2016 and April 2018, respectively. The satellites both          datasets.
carry dual-frequency (Ku- and C-band) synthetic aperture               The Sentinel-3 tracks are spaced 52 km apart at the Equa-
radar altimeters (SRAL instruments) on board, building on           tor, offering a high spatial density of potential VSs on rivers
the heritage of the CryoSat-2 and Jason missions (Drinkwater        globally, with a return period of 27 d. This is interesting when
and Rebhan, 2007). In SAR mode, the altimeter has a higher          compared to traditional short-repeat missions such as the Ja-
along-track resolution of 300 m compared to 1.64 km in low-         son mission (10 d repeat period and 315 km intertrack in-
resolution mode (LRM). The instruments operate 100 % in             terval) or Envisat (35 d and 80 km) and geodetic missions
SAR mode between 60◦ N and 60◦ S, making Sentinel-3 the             such as CryoSat-2 (369 d and 7.5 km). Sentinel-3 provides a
first satellite altimetry mission to provide near global cover-     denser VS network than Jason-2 and Envisat, with a shorter
age in SAR mode. SAR altimeters have improved data qual-            return period than Envisat. This creates interesting possibili-
ity and accuracy in coastal areas and over inland water thanks      ties for monitoring rivers and wetlands at catchment scale.
to the smaller along-track footprint, which is less affected by        Several databases provide global, ready-to-use and pub-
land contamination (Dinardo et al., 2018; Jiang et al., 2017b;      licly available time series of WSE for inland water bod-
Nielsen et al., 2017; Wingham et al., 2006). Thus smaller           ies derived from satellite altimetry observations, including
water bodies, including narrower rivers, can be sensed by the       from Sentinel-3, e.g., Hydroweb (http://hydroweb.theia-land.
altimeter (Villadsen et al., 2016).                                 fr/, last access: 15 January 2021), DAHITI (https://dahiti.
   The on-board tracking mode of Sentinel-3 is different from       dgfi.tum.de/en/, last access: 15 January 2021) and HydroSat
the previous SAR altimetry mission CryoSat-2. The track-            (http://hydrosat.gis.uni-stuttgart.de/php/index.php, last ac-

Hydrol. Earth Syst. Sci., 25, 333–357, 2021                                           https://doi.org/10.5194/hess-25-333-2021
C. M. M. Kittel et al.: Sentinel-3 radar altimetry for river monitoring 335
cess: 15 January 2021). However, they do not provide full
catchment-scale coverage and there is a time lag between
data acquisition and the inclusion of the VSs in the database.
The Sentinel-3 dataset is available on public processing plat-
forms with dedicated tools for WSE extraction over inland
water. In order to benefit from the high spatiotemporal cov-
erage of Sentinel-3 and large number of hydrological tar-
gets, automatic processing workflows and evaluation tools
are necessary. For instance, the mission has operated in a
dual-satellite constellation since November 2018, providing
over a year of non-time-critical data from Sentinel-3B not yet
available in the aforementioned databases.
The aim of this study is to demonstrate the potential of the
Sentinel-3 mission in hydrological applications (e.g., moni-
toring, modeling or assessing river–floodplain interactions)
by extracting a catchment-scale WSE monitoring network
of VSs using the full Sentinel-3 records. We evaluate the
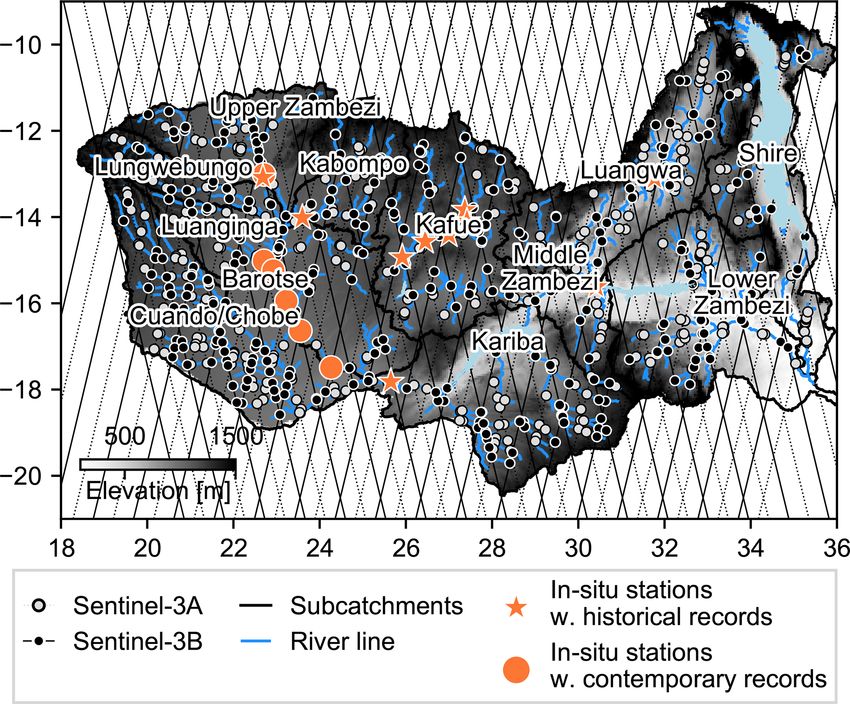
satellite performance directly against in situ data where these Figure 1. Base map of the study area with in situ stations used for
are available and investigate the impact of processing choices validation of the Sentinel-3 WSE time series. All Sentinel-3 tracks
on the WSE time series at selected VSs. Finally, we explore and river-track crossings, so-called virtual stations (VSs), are shown
the potential of the dual-satellite constellation for spatiotem- for the entire Zambezi basin.
poral monitoring of wetlands and floodplains. To address
these objectives, we use two publicly accessible databases
and present an automatically extracted catchment-scale river forts. Remote sensing observations of WSE can provide use-
WSE monitoring network based on Sentinel-3 radar altime- ful monitoring information and inform forecasting and plan-
try for the Zambezi. All processing steps are performed on ning tools in poorly instrumented areas. The collection of
publicly accessible databases or use open-access code. consistent water level data remains a challenge for the mem-
ber states, especially in the upper parts of the Zambezi, where
system failure and vandalism are a constant disruption of the
existing ground monitoring system. Thus, a WSE monitoring
2 Study area and data
network based on altimetry observations could ensure steady
2.1 The Zambezi information on water levels in the catchment even if the ex-
isting ground system is not in operation.
The Zambezi is the largest river in southern Africa and drains
2.2 Auxiliary data
1 390 000 km2 stretching over eight countries (Fig. 1). Wa-
ter resources in the basin are crucial for human consump- 2.2.1 Virtual station localization
tion, hydropower production, irrigation and ecosystem ser-
vices (Beilfuss, 2012). There are three distinct seasons: the A VS is defined as the intersection between a river line and
wet and warm season from November to April, the cool and a satellite ground track. Each time the satellite returns on the
dry season from May to July and the hot and dry season be- given pass, new observations of the river can be added to the
tween August and October. The river and its tributaries dis- WSE time series at the VS. The river line is from the open
play a strong seasonal signal, which should be reflected by dataset of global river networks from Yan et al. (2019), which
the satellite altimetry dataset. is based on two DEMs: the SRTM (Shuttle Radar Topogra-
Previous studies have evaluated other altimetry missions phy Mission) and ASTER GDEM v.2 (Advanced Spaceborne
over the Zambezi, providing a reference in terms of the Thermal Emission and Reflection Radiometer Global Digital
performance of new satellites (Michailovsky et al., 2012; Elevation Model) datasets at 90 and 30 m resolutions, respec-
Michailovsky and Bauer-Gottwein, 2014). As shown in tively. Yan et al. (2019) included a stream burning step prior
Fig. 1, satellite tracks cross the river and its tributaries at to the application of the river delineation algorithm to im-
multiple locations and several ground tracks cross important prove the river localization compared to the DEM processing
wetlands (e.g., the Barotse floodplain, Chobe floodplain and alone, particularly over plain areas.
the Kafue flats).
Water resources in the Zambezi River basin are increas-
ingly subject to stress, as several drought episodes have af-
fected southern Africa in the last 30 years (Abiodun et al.,
2019). Monitoring is key to adaptation and mitigation ef-
https://doi.org/10.5194/hess-25-333-2021 Hydrol. Earth Syst. Sci., 25, 333–357, 2021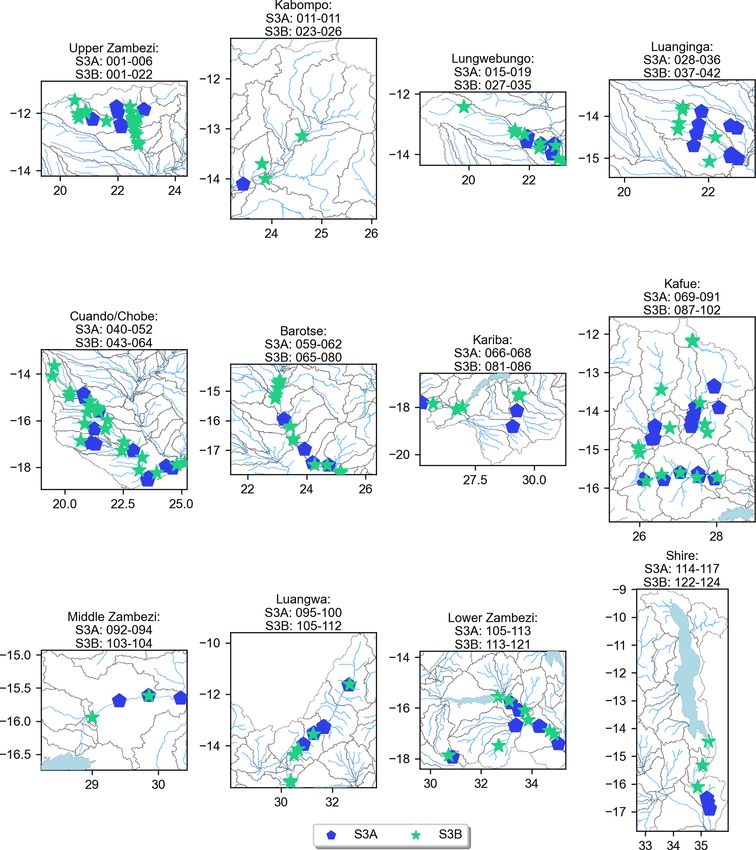
336                                                     C. M. M. Kittel et al.: Sentinel-3 radar altimetry for river monitoring

2.2.2   Water mask                                                   Table 1. OLTC versions considered in this study. The number
                                                                     of targets corresponds to the latest version and can be visualized
To ensure that observations are over water, we use v.1.1 of          and found on https://www.altimetry-hydro.eu/ (last access: 15 Jan-
the water occurrence maps from Pekel et al. (2016). The              uary 2021).
maps are based on 3 million satellite images from Landsat
from 1984 to 2018 and indicate seasonal and annual changes                                     Sentinel-3A         Sentinel-3B
in global surface water occurrence at 30 m resolution. The                 Initial version     4.2 (24 May 2016)   2.0 (27 Nov 2018)
occurrence map indicates the percentage occurrence of wa-                  Update              5.0 (9 Mar 2019)
ter. We use a threshold of 10 % water occurrence frequency                 Targets             33 261              32 515
over the 34 years of record. A low threshold is chosen on
purpose to ensure all valuable data, including seasonal wa-
ter, is extracted at the cost of a higher outlier frequency. This
                                                                        In total, there are 87 new hydrology targets over the Zam-
ensures that data points are not masked out because of low
                                                                     bezi River from hydrology databases represented in v. 5 of
water occurrence probability, which could be partly due to
                                                                     the Sentinel-3A OLTC compared to only two in v. 4.2, which
cloud cover.
                                                                     mainly used ACE2 DEM data. In v. 4.2, 64 additional targets
2.2.3   Digital elevation model (DEM)                                were defined at VSs. These targets have been updated with
                                                                     refined elevation information in v. 5 to improve spatial cov-
We use the MERIT DEM (Multi-Error-Removed Improved-                  erage. The Sentinel-3B OLTC v. 2 contains 115 hydrology
Terrain DEM) as reference surface elevation (Yamakazi                targets.
et al., 2017). MERIT is based on widely used DEMs, in-
cluding SRTM, which have been corrected for several error            2.2.5    In situ water level stations
sources (speckle noise, tree height bias, etc.). It is provided at
3 s resolution and referenced to the EGM96 geoid. We repro-          Level observations from 14 operational gauging stations
ject the DEM onto the EGM2008 geoid using the VDatum                 were kindly provided by the Zambezi River Author-
software (Myers et al., 2007) to consistently use the same           ity (ZRA), who maintain the dataset. Six of the in situ gaug-
geoid for all datasets.                                              ing stations are in sufficient proximity to a Sentinel-3 VS
                                                                     (< 20 km) and located on the same stream; they are therefore
2.2.4   Open-Loop Tracking Command (OLTC) tables                     suitable for direct comparison. The catchment areas are suf-
                                                                     ficiently similar between the in situ and VSs to justify com-
The OLTC contains targets based on elevation information             parison (e.g., no major tributaries between the two stations);
from either hydrology databases (e.g., Hydroweb), VS net-            the contributing areas differ by less than 5.5 % in all cases.
works and a global DEM (e.g., the Altimeter Corrected El-            At all selected stations the level records are labeled as “Very
evations v.2 Digital Elevation Model, ACE-2). Details about          good quality” and provided at daily temporal resolution with
the generation of the OLTC tables for inland water targets           an accuracy of 1 mm.
can be found in Le Gac et al. (2019). The on-board ta-                  Additionally, historical records from 2000–2010 are avail-
ble is updated periodically for both satellites. Relevant to         able at 12 additional gauging stations. At 10 stations, the in
this study in particular is the March 2019 update of the             situ station and Sentinel-3 VS are located on the same stream
Sentinel-3A OLTC. The OLTC can be visualized at https:               and within close enough proximity to be representative of
//www.altimetry-hydro.eu/ (last access: 15 January 2021),            similar catchment areas. All stations considered are shown
where contributions can be submitted for future updates. An          in Fig. 1.
overview of the OLTC updates on board the two satellites
is shown in Table 1. In this paper, the latest Sentinel-3B           2.3     Sentinel-3 Level-1b and Level-2 data
update in June 2020 is not considered due to the limited
records available at the time of writing. Since March 2019,          Table 2 summarizes mission specifications for the Sentinel-
over 65 000 VSs on inland water bodies have been defined             3 satellites. Level-1b and Level-2 data for the area of inter-
on board Sentinel-3A and Sentinel-3B.                                est are retrieved from (1) the ESA GPOD SARvatore (Grid
   Sentinel-3A and Sentinel-3B have been operating in open           Processing on Demand SAR Versatile Altimetric Toolkit
loop between 60◦ N and 60◦ S since 9 March 2019 and                  for Ocean Research and Exploitation) service (available at
since the beginning of mission life, respectively. Prior to          https://gpod.eo.esa.int/, last access: 15 January 2021) and
9 March 2019, Sentinel-3A followed a mode mask, switch-              (2) the Copernicus Open Access Hub (SciHub, available at
ing between closed and open loop, and operated in open loop          https://scihub.copernicus.eu/, last access: 15 January 2021).
over the Zambezi catchment, with the exception of a short            Both services are freely available upon registration and use
transition phase in March 2019 when the OLTC was updated.            the exact same Level-1a data for processing. With the excep-
                                                                     tion of in situ observations, none of the processing steps or
                                                                     data are catchment specific.

Hydrol. Earth Syst. Sci., 25, 333–357, 2021                                                  https://doi.org/10.5194/hess-25-333-2021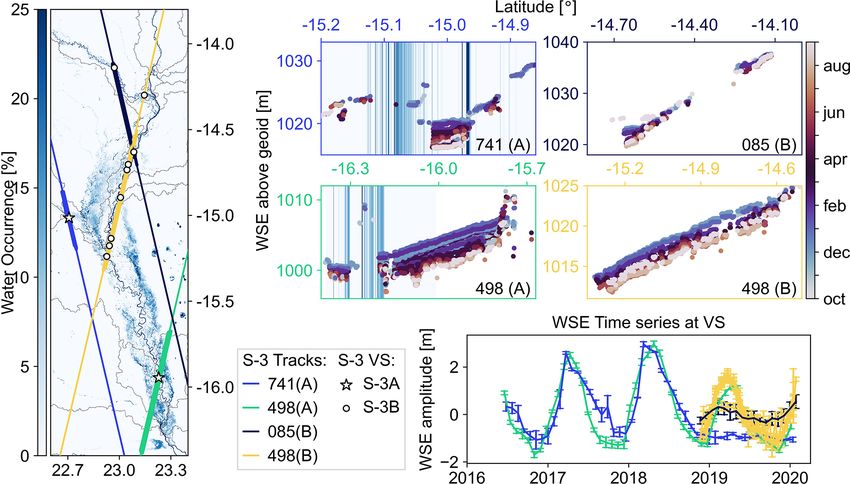
C. M. M. Kittel et al.: Sentinel-3 radar altimetry for river monitoring                                                        337

Figure 2. Outline of the processing workflow applied in this study to obtain water surface elevation (WSE) time series and waveform
statistics. The differences between the two datasets are highlighted left (SciHub) and right (GPOD).

   Figure 2 illustrates the processing workflow used for the             to reduce the impact from off-nadir bright targets by re-
two datasets from download to the data later presented in                ducing the side-lobes of the delay-Doppler beam.
the results section. The Level-1b data and Level-2 data are
specific to the two databases and both datasets contain the           – A factor of 2 oversampling of the radar waveform prior
auxiliary data necessary to compute the WSE. The datasets               to the range FFT improves sampling efficiency of peaky
are evaluated at multiple stages. The following sections de-            echoes from bright targets.
tail the specific processing on each of the two platforms and         – An extension of the receiving window N times bet-
provide additional information on each local processing step.           ter accommodates the Level-1b echoes in the receiving
2.3.1   Grid processing on demand (GPOD)                                window over rough topography.

                                                                       The range window is the vertical window during which
A processing configuration tailored for inland water is avail-
                                                                    the altimeter records the return echo from the emitted pulse.
able on GPOD. In particular, four specific options are applied
                                                                    During processing, the return echoes from several pulses are
during processing (Dinardo et al., 2018):
                                                                    stored in a so-called receiving window (i.e., a temporal ma-
  – A Hamming weighting window is applied on the burst              trix) and combined to form an echogram. For satellites op-
    data prior to the azimuth fast Fourier transform (FFT)          erating in closed-loop mode, there may be a transition phase

https://doi.org/10.5194/hess-25-333-2021                                           Hydrol. Earth Syst. Sci., 25, 333–357, 2021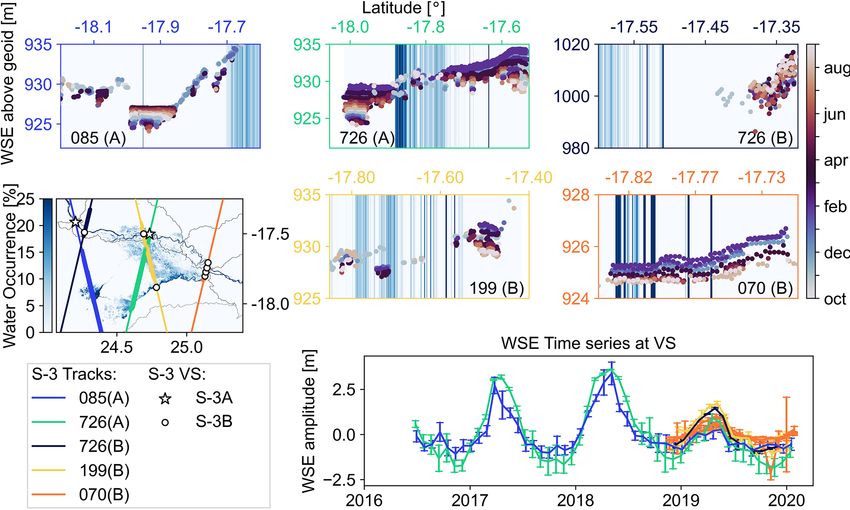
338                                                                  C. M. M. Kittel et al.: Sentinel-3 radar altimetry for river monitoring

Table 2. Sentinel-3 mission specifications.                                      sulting dataset is referred to as the “SciHub dataset” in the
                                                                                 following sections.
                            Sentinel-3A            Sentinel-3B
  Launch                    16 Feb 2016            25 Apr 2018                   2.3.3   Data selection
  Data coverage             1 Jun 2016–present     1 Nov 2018–present
                                                                                 First, we coarsely select observations less than 2 km from
  Planned lifespan          7 years                7 years                       a VS. We then filter the observations over the water occur-
  Elapsed lifespan          4 years                2 years                       rence mask. The along-track resolution is 300 m. Therefore,
  Orbit                     Polar, sun-synchronous                               a buffer of one observation around each water body is al-
                            27 d repeat cycle                                    lowed. The water mask is based on Landsat observations and
  Ground track separation   104 km at the Equator                                thus sensitive to cloud and tree cover. In order to avoid dis-
                            (52 km in two-satellite constellation)               carding valid observations over water due to gaps in the wa-
  Instrument                Synthetic Aperture Radar Altimeter (SRAL)            ter mask, observations with high maximum range integrated
                            Ku-band                                              power (RIP) (> 10−13 W) or a high backscatter coefficient
                            (300 m resolution after SAR processing)              (σ0 > 30 dB) are also classified as water at this stage. The
  Operating mode            Open loop                                            backscatter coefficient threshold is set based on trial and error
  Footprint                 300 m × 1.64 km (along-track × across-track)         for the basin and previous studies (e.g., Michailovsky et al.,
                                                                                 2012). This step also ensures that valid observations are not
                                                                                 removed in case smaller tributaries are not present in the wa-
                                                                                 ter mask.
before the range window is correctly positioned in regions
with rapidly changing topography (Dinardo et al., 2018). If                      2.3.4   Correction of the retracked range
the topography is too steep, the standard fixed-size receiv-
ing window of 256 samples cannot store the elevation of                          The retracked range must be corrected for instrumental and
all the samples in the echogram prior to Level-1b process-                       geophysical effects. In both datasets, instrumental correc-
ing (e.g., Fig. 5 in Dinardo et al., 2018). By extending the                     tions have already been applied to the 20 Hz retracked range,
receiving window, all the echoes can be stored in the same                       Runc (i.e., USO (ultrastable oscillator) drift correction, inter-
matrix without truncating the leading edge, which will be re-                    nal path correction, distance antenna-COG (center of grav-
tracked to obtain the WSE. In open-loop mode, truncation                         ity) and Doppler corrections). Runc must also be corrected
might occur close to changes in the OLTC, where the receiv-                      for geophysical and propagation effects (i.e., pole tides, solid
ing window may still be positioned according to the previous                     Earth tides, ionosphere, and dry and wet troposphere), here
target. OLTC targets might be far apart due to space limita-                     summed into Rgeo to obtain the corrected range, Rc (Eq. 1).
tions of the OLTC (Le Gac et al., 2019), resulting in steep
changes when a new target is introduced. Extending the re-                       Rc = Runc − Rgeo                                             (1)
ceiving window can accommodate these sudden shifts in the
position of the range window as well. We therefore process                       In the GPOD dataset, the geophysical corrections are aggre-
all tracks using a double and triple receiving window to iden-                   gated and provided as a single variable to be subtracted from
tify where the extension might be useful.                                        the retracked range. In the SciHub dataset, the geophysical
   GPOD uses the Samosa+ retracker to retrieve the nadir                         corrections have already been subtracted from the OCOG-
range. Samosa+ is a physically based retracker specifically                      retracked elevation. In both cases, all corrections are also
dedicated to coastal regions and described in detail in Di-                      available separately.
nardo et al. (2018). The GPOD datasets are referred to as the                       The WSE is the satellite’s altitude, h, relative to the ref-
“GPOD dataset” in the following sections, with 2x and 3x,                        erence WGS84 ellipsoid minus the corrected satellite range.
respectively, indicating the double and triple receiving win-                    The final WSE, HWSE , is projected onto the EGM2008 geoid
dow extension.                                                                   by subtracting the geoid height, Hgeoid (Eq. 2).

2.3.2     Copernicus Open Access Hub (SciHub)                                    HWSE = h − Rc − Hgeiod                                       (2)

The Copernicus Open Access Hub (previously Sentinels Sci-                        All variables are expressed in meters. The corrections and
entific Data Hub) provides Sentinel-3 SAR data at vari-                          geoid data are provided along with the retracked data in each
ous processing levels, including Level-1b and Level-2. In                        respective dataset. Although both use the EGM2008 geoid
the Level-1b dataset, the echo waveforms are provided in                         model, the geoid model parameters as well as the geophysi-
“counts” and are therefore not directly comparable to the                        cal corrections can differ slightly. We observe a bias between
GPOD waveforms. In the Level-2 dataset, several retrack-                         the two datasets of varying magnitude throughout the basin.
ers are used. Over land, the empirical OCOG (offset center                       Therefore, only the relative change in WSE is considered
of gravity) retracker is used (Wingham et al., 1986). The re-                    when comparing the datasets.

Hydrol. Earth Syst. Sci., 25, 333–357, 2021                                                        https://doi.org/10.5194/hess-25-333-2021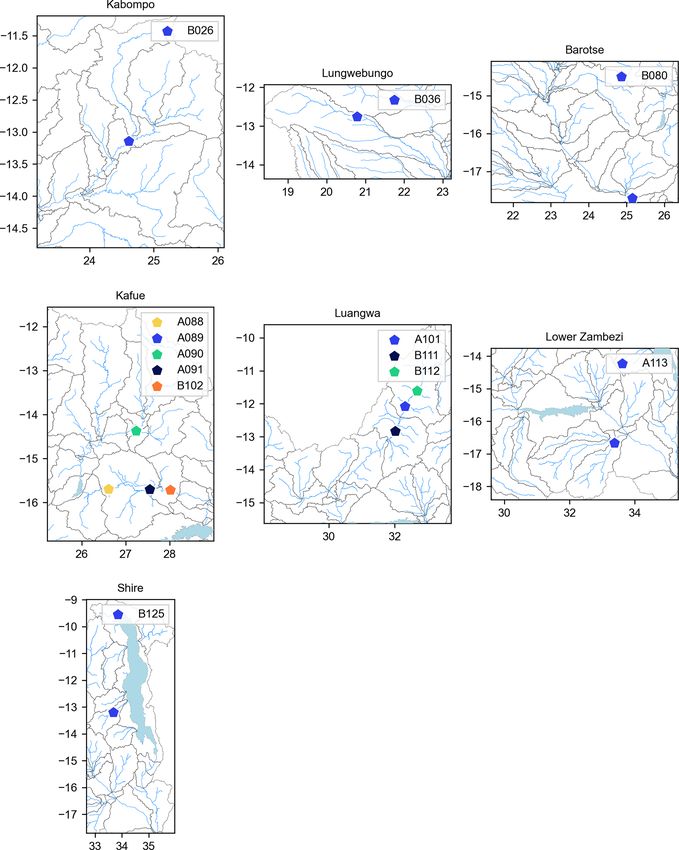
C. M. M. Kittel et al.: Sentinel-3 radar altimetry for river monitoring                                                         339

2.3.5   Outlier filtering                                          be impacts on the tracker range depending on how the tran-
                                                                   sition is handled, e.g., by extending the receiving window.
Outlier filtering is based on digital elevation values using the      On Sentinel-3, the tracker range is positioned at one-third
ACE-2 DEM included in the GPOD dataset and the MERIT               of the full window, at bin 43 (counting from 0, also called the
DEM for the SciHub dataset. Differences in height exceed-          nominal tracking position). The positioning of the window
ing 30 m are considered outliers. The expected uncertainty         is done through the so-called window delay, or the delay be-
of the MERIT DEM is less than 2 m for 58 % of land pixels          tween the pulse emission and the time of record of the tracker
globally (Yamakazi et al., 2017). Based on the project accu-       range. The epoch is the distance between the nominal track-
racy matrix, ACE-2 has an accuracy better than 10 m for over       ing position and the retracking position after Level-2 pro-
half of the VSs in the basin and better than 16 m throughout       cessing. The GPOD dataset contains the epoch (in m), which
the catchment (Berry et al., 2010, 2019). Thus, we do not          can be converted to number of bins and used to extract the re-
expect a significant number of false negative outliers due to      tracking position. Repositioning to the center of the original
DEM accuracy based on the allowed window of uncertainty.           reception window requires taking into account (1) oversam-
One exception may be new dams and reservoirs altering the          pling and (2) the receiving window extension (2x or 3x), as
surface elevation by more than 30 m; however, this does not        described in Sect. 2.3.1. The tracker range (in m and refer-
appear to be an issue in this catchment. We also do not expect     enced to the nominal tracking position) is directly provided
the choice of DEM to impact the final results, especially as       in the enhanced measurement file from SciHub.
both DEMs are based on the SRTM DEM. A σ0 threshold of
30 dB ensures that only observations of bright targets (such       2.3.7   Level-2 water surface elevation (WSE)
as water) are included in the final selection used to produce
WSE time series at each VS.                                        We calculate the along-track mean of all observations re-
                                                                   tained at a given VS to produce a WSE time series. At
2.3.6   Level-1b waveforms                                         six VSs, the time series was evaluated against ground obser-
                                                                   vations of water level. In order to account for any vertical bias
To evaluate and summarize the Level-1b waveforms, we cal-          between the two ground and satellite observations, the mean
culate the following parameters (Jiang et al., 2020):              level at overlapping sensing dates is subtracted from the in
  – stack peakiness (SP): ratio between the maximum RIP            situ and satellite WSE, respectively. Performance is evalu-
    and sum of RIP                                                 ated by calculating the RMSD (root-mean-square deviation),
                                                                   DRMS , between the relative in situ (wg ) and satellite (ws ) lev-
  – maximum power (MP): maximum value of a waveform                els (Eq. 3), and the WRMSD (weighted RMSD) by dividing
  – pulse peakiness (PP): ratio between maximum power              with the residuals with the in situ standard deviation.
    and the sum of the waveform                                              v
                                                                                    N
                                                                             u
                                                                             u1 X                   2
  – number of peaks (NP): number of peaks in a waveform            DRMS = t             wg,i − ws,i                               (3)
    – a peak is defined as exceeding 25 % of the MP (Jiang                      N i=1
    et al., 2020).
                                                                   Based on past mission performance as summarized in Vil-
   MP and NP are indicators of the presence and number of          ladsen et al. (2016), RMSD values below 30 cm are consid-
bright targets, respectively, while SP and PP provide infor-       ered good, and between 30 and 60 cm are considered moder-
mation on the shape of the waveform. A river-like surface          ate. We calculate Pearson’s correlation coefficient to evaluate
is typically smooth and highly reflective, resulting in quasi-     the linear correlation between the in situ and remote sensing
specular reflections. This will typically translate into narrow,   WSE. The correlation coefficient should be above 0.9.
peaky waveforms and consequently high SP and PP values.               Additionally, the annual water level variations recorded by
We use NP to classify the VS at Level-1b, assuming stations        Sentinel-3 are assessed against records from 10 in situ gaug-
with over 90 % single-peak waveforms are likely to be good         ing stations using historical observations from 2000–2010.
water targets with useful time series.                             Although the stations could not be used directly due to the
   The tracker range is the on-board positioning of the ex-        lack of temporal overlap, they can still support a visual as-
pected leading edge according to the OLTC. Plotting the            sessment of the annual water level variations recorded by
along-track tracker range reveals how the range window po-         Sentinel-3.
sition changes based on the OLTC targets and updates to the
OLTC. The on-board surface elevation must be correct and
the surface elevation must be within the range window to           3   Results
obtain useful observations of the water surface. The tracker
range also provides insight into the Level-1b processing op-       The Sentinel-3 VSs in the Zambezi are shown in Fig. 3. In to-
tions of the two datasets, particularly where the range win-       tal, 364 Sentinel-3A and 367 Sentinel-3B VSs are identified.
dow is repositioned. If this occurs close to a VS, there may       At each VS, the percentage of missing data is calculated as

https://doi.org/10.5194/hess-25-333-2021                                           Hydrol. Earth Syst. Sci., 25, 333–357, 2021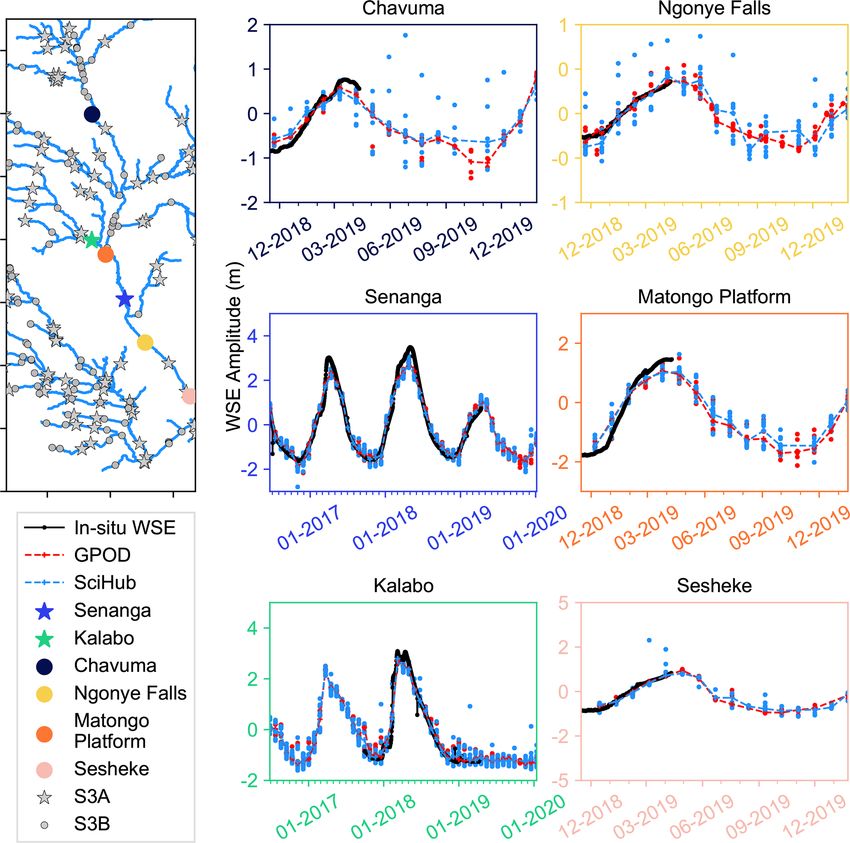
340                                                    C. M. M. Kittel et al.: Sentinel-3 radar altimetry for river monitoring

Figure 3. Zambezi Sentinel-3A and 3B VSs after outlier filtering. Stations that improved by modifying processing steps (either on board
through the Sentinel-3A OLTC update or on ground by extending the receiving window on GPOD) are highlighted separately. The frames
indicate examples highlighted in the next sections of this study. Additional maps are included in the Appendix (Figs. A1–A3).

the number of days with WSE observations divided by the               how the waveform is derived and will be different in the two
number of days the satellite passed over the VS. In general,          datasets. We note that σ0 is around 30 % higher in the SciHub
the VSs with complete records are predominantly located on            dataset. We use the same threshold because the intention is
higher-level branches and tributaries of the basin and close to       to remove obvious nonwater targets. Increasing the threshold
or on floodplains (Fig. 3). These targets are generally wider         for the OCOG dataset does not improve outlier filtering as
and perennial, and the topography is flatter. Conversely, sev-        clearly defined nonwater targets still have much lower σ0 val-
eral VSs with a high percentage of missing data are located           ues, while some SciHub outliers have very high backscatter
in the headwater subcatchments on smaller tributaries.                (high standard deviation within the selected pass, no consis-
                                                                      tent seasonal pattern, poor L1b statistics, etc.).
3.1   Evaluation of Sentinel-3 virtual stations (VSs) in                 At 30 Sentinel-3A stations, no observations are available
      the Zambezi catchment                                           in either dataset before the March 2019 OLTC update, sug-
                                                                      gesting the WSE was outside the range window causing the
Table 3 summarizes the number of Sentinel-3A and Sentinel-            poor results prior to the update. Indeed, at over 90 % of these
3B number of VSs in the Zambezi catchment with less than              stations, the Level-1b statistics are consistent with water tar-
20 % missing data (L2 columns) in each dataset and in both            gets. We also see that for 13 VSs a triple extension of the
datasets combined. The rejection rate is slightly higher when         receiving window improves the time series from the GPOD
using the GPOD dataset than when using the SciHub dataset             dataset, confirming the importance of considering this option
(respectively, 67 % and 62 % for Sentinel-3A and 66 % and             at certain locations.
63 % for Sentinel-3B). This difference can be attributed to              We evaluate the Level-1b data to assess whether the obser-
the higher proportion of no-data values and the generally             vations at the VSs are consistent with observations of water
lower σ0 values in the GPOD dataset. The higher percent-              (L1b columns in Table 3). In the GPOD dataset, a high per-
age of no-data values is due to the nature of the Samosa+             centage of the VSs have high PP and SP values (respectively,
retracker: it is a physically based model and more sensi-             above 0.1 and 0.2) combined with single peak waveforms
tive to erroneous waveforms than the empirical OCOG re-               (NP = 1) and high power (MP > 1 × 10⁻¹⁵ W). High SP and
tracker. σ0 is inherently related to the Level-1b processing:         PP values indicate a quasi-specular reflection, consistent with

Hydrol. Earth Syst. Sci., 25, 333–357, 2021                                              https://doi.org/10.5194/hess-25-333-2021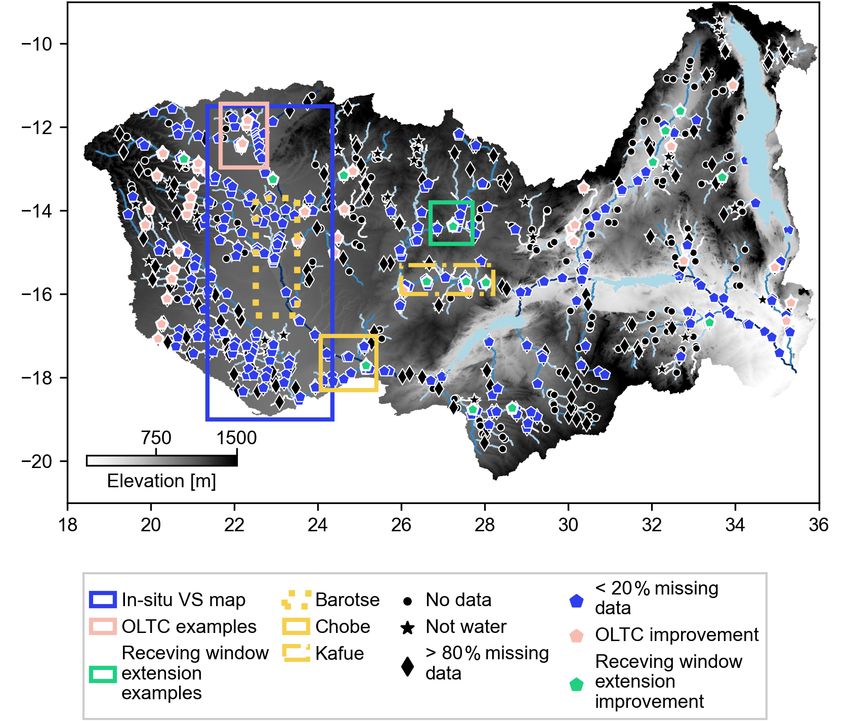
C. M. M. Kittel et al.: Sentinel-3 radar altimetry for river monitoring                                                                 341

Table 3. Number of VSs fulfilling criteria of Level-1b (L1b, % of VSs retained from Level-2) and Level-2 (L2) in GPOD and SciHub datasets
using the Samosa+ and OCOG retrackers, respectively, and in both datasets. We consider S3A VSs with data only after the OLTC update in
March 2019 (line “OLTC v. 5”) as well as the two processing settings on GPOD (line “3x window extension”) separately. The total contains
all stations present in both datasets.

                                                  GPOD                    SciHub                   Both
                                             L2           L1b        L2       L1b            L2        L1b
                            Sentinel-3A – 364 VSs
                            OLTC v. 4.2      82      75 (91 %)      139    60 (43 %)         82     54 (66 %)
                            3x extension      7       6 (86 %)        –        –              –         –
                            OLTC v. 5        32      31 (97 %)       45    21 (47 %)         32     20 (63 %)
                            Total           121     112 (93 %)      184    81 (44 %)        121     78 (64 %)
                            Sentinel-3B – 367 VSs
                            OLTC v. 2       113     107 (94 %)      176    86 (49 %)        113     75 (66 %)
                            3x extension     10       7 (70 %)        –        –              –         –
                            Total           123     114 (93 %)      176    86 (49 %)        123     78 (63 %)

river surfaces, while a unique peak and high power indicate
low contamination from surrounding bright targets.
   The majority of stations with complete time series also
have a high number of single-peak waveforms. A number
of VSs have high PP and SP values but multipeak waveforms
due to nearby bright targets (Fig. 4). Furthermore, as the
SP and PP cannot be calculated based on the waveforms pro-
cessed on SciHub, the VSs are evaluated at Level-1b based
on the NP. We select stations with predominantly single-peak
waveforms (along-track median NP = 1 in over 90 % of the
observations associated to the VS). In total, 74 Sentinel-3A
and 77 Sentinel-3B VSs have complete records and promis-
ing waveform statistics in both datasets (112 and 81 Sentinel-
3A VSs and 114 and 85 Sentinel-3B VSs from GPOD and
                                                                       Figure 4. Stations fulfilling the Level-1b (L1b) selection criteria in
SciHub, respectively).                                                 percentage of virtual stations (VSs) selected based on Level-2 data.
   The rejection rate is higher in the SciHub dataset with re-         Note that ESA SciHub does not provide the waveform in power;
jected stations throughout the basin. This is mainly due to the        therefore, the stack peakiness (SP) and maximum power (MP) are
lower percentage of missing data in the Level-2 data. OCOG             not calculated and are not part of the “all criteria fulfilled” evalu-
is an empirical retracker that is less likely to fail on nonwa-        ation. OLTC indicates the waveform statistics after the Open-Loop
ter waveforms. Samosa+ is a physical retracker developed               Tracking Command (OLTC) update on Sentinel-3A in March 2019.
for coastal regions but suited to inland water targets. If the
model misfit is too high, the retracker fails and the VS is re-
jected based on this missing data.                                     ing out with the VSs most likely to hold useful river WSE
   A closer look at the stations with a large fraction of miss-        observations.
ing observations or multipeak waveforms in both datasets re-              It is interesting to note that 13 VSs are improved by ex-
veals that at some stations the outliers that cause the rejection      tending the receiving window in the GPOD dataset. Extend-
could be removed with dedicated, manual postprocessing if              ing the receiving window ensures that the leading edge of
the stations are located in areas of interest. In several cases,       the L1b echo is preserved. This is an advantage at VSs where
the rejected stations are located on narrow rivers crossing            topography changes abruptly, as the full return echo can be
seasonal floodplains with along-track standard deviations ex-          contained in the receiving window from all beams used dur-
ceeding the seasonal variation. This is mostly the case when           ing multilooking.
the station is rejected based on the single-peak criteria, justi-
fying the rejection of the station. The proposed approach al-
lows users to group the VSs for further inspection, e.g., start-

https://doi.org/10.5194/hess-25-333-2021                                                Hydrol. Earth Syst. Sci., 25, 333–357, 2021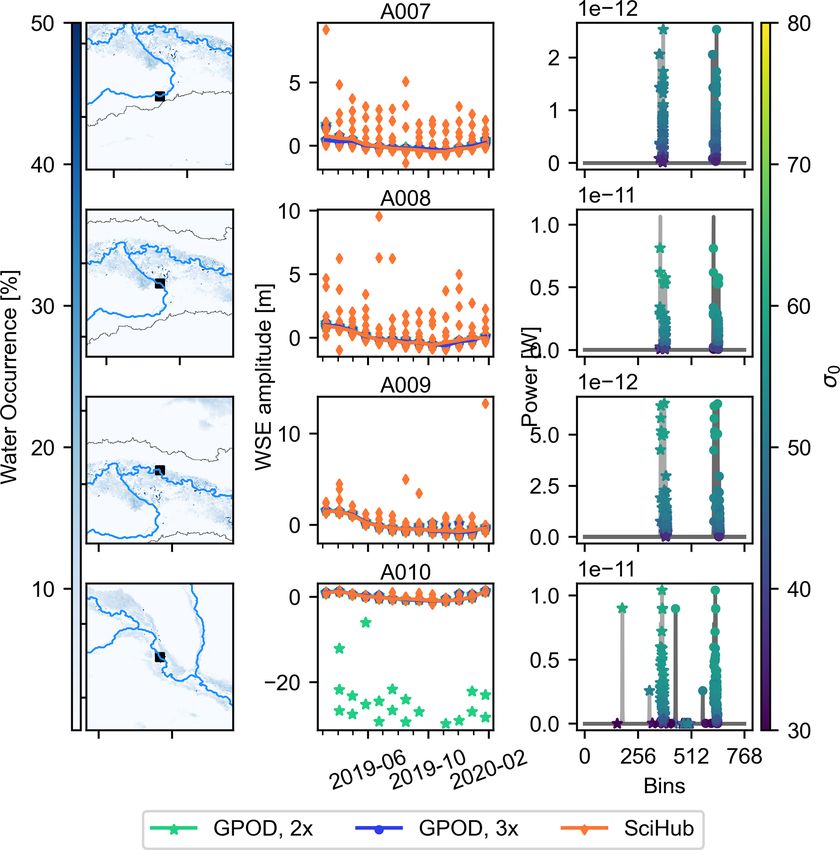
342                                                       C. M. M. Kittel et al.: Sentinel-3 radar altimetry for river monitoring

Figure 5. In situ and satellite water surface elevation (WSE) at six locations in the upper Zambezi basin (blue polygon in Fig. 3). The plot
colors correspond to the marker colors for each station in the map. The lines indicate the along-track mean WSE.

3.2     OLTC tables and geographical location of                        six cases, the twice-extended receiving window is sufficient.
        hydrological targets                                            The OLTC did not significantly change at the VSs consid-
                                                                        ered, meaning WSE observations are available for the entire
Table 4 shows the geographical distribution of the VSs se-              Sentinel-3 sensing period.
lected in Sect. 3.1 in the Zambezi basin and the corre-                    Performance at all six stations is highly satisfactory based
sponding number of expected VSs based on the OLTC.                      on visual inspection, performance statistics and in compari-
The Sentinel-3A OLTC update introduced several new VSs,                 son to performance reported in past studies (Villadsen et al.,
which had no useful information prior to the update. Most               2016). The RMSD between the in situ and satellite rela-
new VSs are located in the western part of the catchment                tive river levels is below 30 cm at five out of six stations;
(upper Zambezi, Lungwebungo and Cuando/Chobe), where                    only the Matongo platform has a moderate RMSD of 32 cm
there were fewer targets in v. 4.2. The number of VSs consis-           (Table 5). The largest RMSDs are seen for the two VSs
tently exceeds the number of targets, which is to be expected           furthest away from the closest in situ gauge (19.3 km for
for plane areas, where even a single target may be sufficient           Senanga and 15.8 km for the Matongo platform). The sys-
to correctly track the WSE at multiple nearby crossing points.          tematic deviations between the in situ and satellite WSE is
                                                                        to be expected given the long distance. For the remaining
3.3     Evaluation of the water surface elevation                       four stations, the RMSD is less than 15 cm with the GPOD
                                                                        dataset. Michailovsky et al. (2012) obtained an RMSD be-
3.3.1    Validation at in situ stations                                 tween 24 and 106 cm at Envisat VSs in the Zambezi catch-
                                                                        ment. The improvement in performance is consistent with the
The retracked WSE data are compared to the in situ gauge                instrumental improvement between the two missions. The
levels at six locations in the basin, where VSs and in situ             GPOD dataset performs better than the SciHub dataset at all
stations are sufficiently close geographically (Fig. 5). In all         stations, improving the RMSDs by between 1.1 cm (7.5 %, at

Hydrol. Earth Syst. Sci., 25, 333–357, 2021                                                 https://doi.org/10.5194/hess-25-333-2021
C. M. M. Kittel et al.: Sentinel-3 radar altimetry for river monitoring 343
Table 4. Open-Loop Tracking Command (OLTC) targets before and after March 2019 for the Zambezi catchment and their source (ACE-2 –
global DEM or hydrology databases, HDBs). The targets are obtained from https://www.altimetry-hydro.eu/ (last access: 15 January 2021).
The Hydroweb Theia S3A virtual stations (VSs) within each watershed are available at http://hydroweb.theia-land.fr/ (last access: 15 Jan-
uary 2021). The VSs are grouped by major watersheds and according to the processing setting required. The versions indicate the OLTC
version after which useful water surface elevation observations could be retrieved at the VSs. The total sums correspond to the values in
Table 3.
S3A S3B
OLTC version v. 4.2 v. 5 Number of VSs v. 2 Number of VSs
ACE2 HDB HDB Hydroweb GPOD SciHub HDB GPOD SciHub
v. 4.2 v. 4.2 v. 5 v. 4.2 v. 5 v. 2 v. 2 v. 2
2x 3x 2x 3x
Upper Zambezi and Luena 0 0 6 1 6 0 4 4 4 8 22 0 16
Kabompo 0 0 3 3 1 0 3 0 3 2 1 1 2
Lungwebungo 3 0 7 3 5 0 7 5 5 8 8 1 6
Luanginga 0 0 0 0 8 0 3 7 2 0 5 0 5
Cuando/Chobe 1 0 2 4 12 0 6 10 3 3 21 0 17
Barotse 5 0 5 5 3 0 3 4 2 18 11 1 10
Middle Zambezi (Kariba) 15 1 9 0 3 0 6 1 0 12 5 0 3
Kafue 7 0 17 14 17 4 3 14 0 14 14 1 10
Maputo 2 0 3 2 3 0 0 2 0 4 2 0 1
Luangwa 4 0 9 6 6 1 3 4 1 6 4 2 4
Lower Zambezi (Tete) 25 1 20 8 7 1 0 7 0 33 8 0 7
Shire 2 0 6 2 4 0 2 2 1 7 3 1 1
Total 64 2 87 48 75 6 31 60 21 115 107 7 86
Table 5. Performance statistics compared to neighboring in situ gauge stations using the G. GPOD processing platform and S. SciHub to
obtain satellite water surface elevation (WSE). The relative root-mean-square deviation (RMSD) is given in percent of the in situ standard
deviation. At all six stations, observations are available until April 2019. All stations have complete WSE records since the start of the
Sentinel-3A time series (June 2016), with the exception of Kalabo (October 2017).
In situ station VS Distance River RMSD [cm] Dry season Wet season WRMSD r2
platform to VS width (% of the mean annual RMSD RMSD [%]
and ID [km] [m] amplitude) [cm] [cm]
Senanga S3A 19.5 260 G. 25.8 (5.6) 15.2 36.4 17.9 0.987
A062 S. 28.2 (6.1) 16.0 39.6 19.6 0.985
Kalabo S3A 4.8 35–600 G. 13.6 (3.1) 8.6 18.8 9.4 0.998
A037 (floodplain) S. 14.7 (3.4) 11.4 18.6 10.1 0.998
Ngonye Falls S3B 1.7 1100 G. 2.9 (1.5) 3.0 3.7 4.9 0.997
B077 S. 7.2 (3.6) 7.0 7.3 12.0 0.992
Chavuma S3B 7.6 210 G. 15.8 (3.3) 15.9 15.7 11.9 0.997
B021 S. 26.0 (5.4) 25.5 26.6 19.6 0.973
Matongo platform S3B 15.8 95 G. 31.3 (6.3) 35.3 28.2 18.9 0.990
B068 S. 29.9 (6.0) 32.0 28.4 18.1 0.992
Sesheke S3B 2.7 430 G. 10.5 (1.7) 13.6 7.8 5.4 0.991
B078 S. 15.4 (2.5) 19.2 12.2 7.9 0.979
Kalabo) and 10.2 cm (39.2 % at Chavuma). The only excep- Thus, the error represents less than 20 % of the variation
tion was Matongo platform, where the SciHub dataset im- in water level expected at each given location. The error
proves the RMSD by 1.4 cm (4.5 %). is equivalent to 1.5 %–6.3 % of the mean annual amplitude.
The WRMSD from the GPOD dataset varies between This confirms a low degree of uncertainty relative to the sea-
4.9 % and 18.9 % of the in situ standard deviation (Table 5). sonal water level amplitudes. A closer look at the seasonal
https://doi.org/10.5194/hess-25-333-2021 Hydrol. Earth Syst. Sci., 25, 333–357, 2021344 C. M. M. Kittel et al.: Sentinel-3 radar altimetry for river monitoring
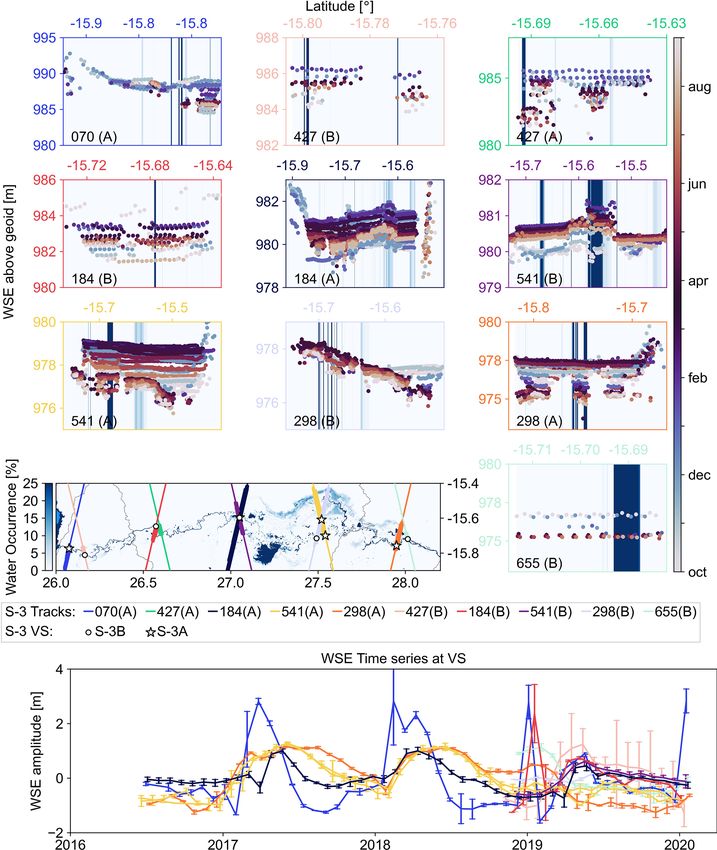
In general, the patterns at several stations are consistent
with the annual hydrological cycle observed in the corre-
sponding region over the last two decades. The WSE ob-
served by the satellite corresponds well with the amplitudes
recorded at the gauging stations. The satellite time series ap-
pear smoother (e.g., at stations 3045, 4669 and 5099). This is
logical as the 27 d return period increases the risk of missing
the peak or low flow compared to a daily gauging record. We
do note some obvious outliers, e.g., at station 5650, in the
Sentinel-3A time series.
3.3.3 Annual amplitude of water surface elevation
Figure 7 shows boxplots of all selected VSs based on the
evaluation of the Level-1b and Level-2 data (< 20 % miss-
ing data and along-track NP = 1 for 90 % of the tracks).
The boxes delimit the IQR (interquartile range, or, be-
tween the first and third quartiles, Q75 and Q25 , respec-
tively) and the whiskers extend from Q25 − 1.5 × IQR to
Q25 + 1.5 × IQR. The amplitude within the whiskers varies
between 1 and 8.3 m. We note that for Sentinel-3B, the am-
plitudes are smaller than for Sentinel-3A. This is due to the
length of records, with indications of 2019 being a dryer year
than 2016–2018, as seen in Fig. 5 at Senanga and Kalabo and
by comparing the Sentinel-3B records to in situ records in
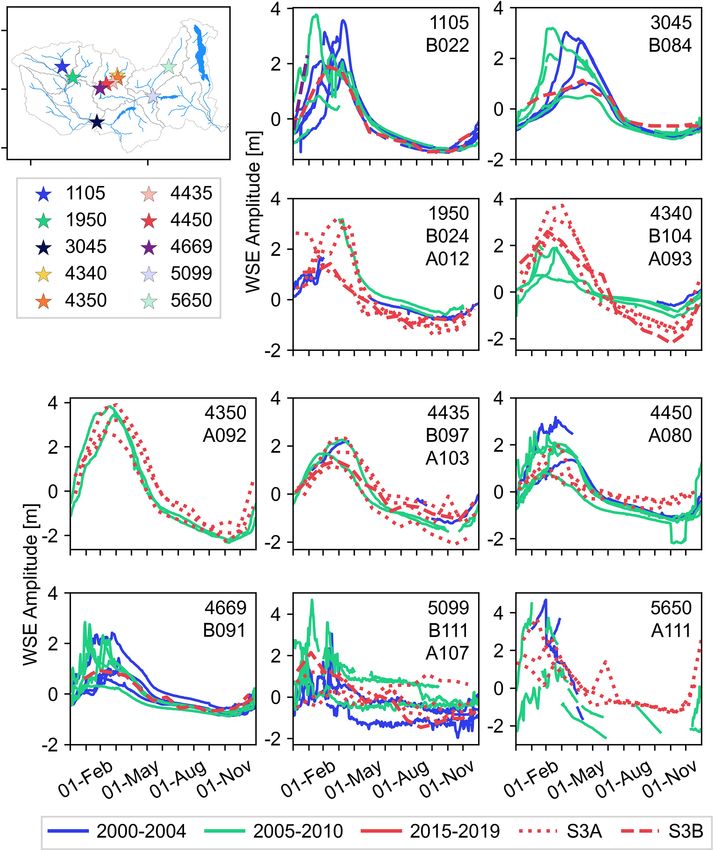
Figure 6. Comparison between in situ annual water surface eleva- Fig. 6.
tion (WSE) and satellite WSE at 10 virtual stations in the Zambezi A closer look at the WSE recorded at the selected VSs re-
basin. The colors indicate the time of observation. All elevations are
veals a large number of extreme values in the initial dataset
referenced to the long-term average WSE to avoid bias due to the
(Fig. 7a). Even after outlier removal, there are still stations
vertical datum. Stations 4340–4669 are all located on the Kafue in
close proximity. with very large amplitudes (> 20 m), which, based on the
overall basin statistics, is unlikely. Ground observations of
WSE indicate annual amplitudes on the order of magnitude
deviations provides additional insight into the uncertainty. As of 5 m and similar values are obtained from Sentinel-3 at di-
expected from Fig. 5, the underestimation of the peak wa- rectly comparable stations.
ter level is the main source of error at Senanga and Kalabo, There are outlier removal approaches that could be used
whereas the error is similar across seasons at Ngonye Falls to address this issue (e.g., IQR outlier removal, where points
and Chavuma, and larger in the dry season at Sesheke and outside of the boxplot whiskers would be removed); how-
Matongo platform. ever, in several cases, the filtering also removes peak annual
The in situ stations are mainly located in the upper Zam- discharge. In some cases, the 3x window extension reduces
bezi, therefore the validation is geographically constrained. this amplitude, as does the OLTC update. At other stations,
However, the river morphology at the ground stations is di- the amplitude increases with the temporal coverage and data
verse, ranging from 95 m wide rivers to 35–600 m on the volume. If we consider the stations with less than 20 % miss-
Barotse floodplain. Therefore the validation is presumed to ing data and over 90 % single-peak waveforms, there are
be an encouraging indication of the performance basin-wide. 156 Sentinel-3 VSs in the Zambezi that contain potentially
valuable information about WSE. Thus, automatically pro-
3.3.2 Evaluation of hydrological pattern at catchment cessing all Sentinel-3 observations within an area of inter-
level est can provide a highly valuable addition to global altimet-
ric WSE databases by increasing the spatial density of VSs
In situ water level observations are available at 10 other loca- at catchment scale. The assessment based on the degree of
tions where records end in the 2000s. As there is no overlap missing data and on single-peak waveforms constitutes a pre-
between the in situ and VS time series, the stations cannot liminary validation of the VSs, although dedicated outlier fil-
be used to quantitatively validate the nearest VSs. Instead, tering and validation might be necessary at some stations to
we visualize the annual water level variations to evaluate ensure consistency with the catchment dynamics.
whether the time series appear consistent with the expected
hydrologic patterns (Fig. 6).
Hydrol. Earth Syst. Sci., 25, 333–357, 2021 https://doi.org/10.5194/hess-25-333-2021C. M. M. Kittel et al.: Sentinel-3 radar altimetry for river monitoring 345
Figure 7. Boxplots of valid water surface elevation (WSE) for each virtual station (VS, along the x axis): (a) all S3A VSs, (b) all S3B VSs,
(c) S3A VSs improved with the 3x receiving window extension, (d) S3B VSs improved with the 3x receiving window extension, and (e) and
(f) S3A VSs with observations after the OLTC update only in the GPOD dataset and SciHub datasets, respectively. The gaps in (a) and
(b) correspond to the VSs shown in (c)–(f). The points are WSE outside of 1.5 times the interquartile range (IQR), a common measure to
identify outliers, to improve readability; the extreme outliers are cropped out of the plots. See the Appendix for the coordinates of the VSs.
4 Discussion 2019). Unfortunately, at 30 VSs in the Zambezi, two and a
half years of Sentinel-3A observations are invalid due to the
4.1 Catchment-scale processing lack of OLTC targets.
Figure 9 illustrates the stack waveforms for VS A011
At four stations in the upper Zambezi, there are no obser- before and after the OLTC update and the positioning of
vations prior to the OLTC update (Fig. 8). The four VSs are the altimeter reception window. The bright water target is
unavailable in global river WSE databases from radar altime- clearly visible in the stack waveform after the OLTC up-
try (e.g., Hydroweb, DAHITI). These examples illustrate the date, whereas the waveform prior to the update is clearly
benefit from processing the Sentinel-3 records on GPOD or just noise. A closer look at the tracker range clearly indi-
SciHub as Level-1a data is published. For global databases, it cates the discrepancy between the on-board elevation infor-
might be impractical to process short time series (in this case mation and the actual surface elevation before the update.
less than a year) although they might contain useful informa- The changes in the on-board DEM after the OLTC update
tion for hydrological studies at catchment level. Furthermore, introduce sharp transitions in the reception window close to
the OLTC update and ensuing increase in number of hydrol- the VS, mimicking the effect of steep topographical changes.
ogy targets increase the number of potential VSs and are key The short closed-loop transition during the OLTC update re-
to the success of the open-loop tracking mode (Le Gac et al., veals that the topography at the target is in fact relatively
https://doi.org/10.5194/hess-25-333-2021 Hydrol. Earth Syst. Sci., 25, 333–357, 2021346 C. M. M. Kittel et al.: Sentinel-3 radar altimetry for river monitoring
3x extension of the receiving window is necessary to obtain
data at this particular VS.
The tracker range from the SciHub dataset suggests that
the range window was correctly positioned within ±10 m of
the surface elevation at around 1111 m (Le Gac et al., 2019).
The discrepancy can instead be attributed to the waveform
processing as illustrated in Fig. 11. After the OLTC update,
a target is defined for the VS at 1113 m and the transition
occurs earlier on the pass. The altimeter reception window
has shifted just enough that the VS elevation is within the
receiving window for all three datasets, including the GPOD
dataset with the double-extended receiving window.
The standard processing produces an abrupt change in the
tracker range, consistent with the Sentinel-3 operating mode,
where a target is retained until a new one is defined. If we
consider the standard GPOD processing, the transition be-
tween two targets is smoothed. Increasing the window pre-
serves the Level-1b echoes leading edge (Dinardo et al.,
2018), creating a stepwise transition (Fig. 11). The effect of
the pseudo-DEM is akin to that of sharp changes in elevation
in coastal or mountainous areas for closed-loop operations
Figure 8. Water surface elevation (WSE) time series in the upper (Dinardo et al., 2018). While a smoother transition may be
Zambezi and GPOD waveforms after the OLTC update at four vir- an advantage for closed-loop processing, as demonstrated in
tual stations (VSs). The columns show the VS location (left), the Dinardo et al. (2018), in open-loop processing, where the tar-
WSE time series from March 2019 to January 2020 (middle) and gets are immediately known, an unnecessary delay is intro-
the waveforms (right). For clarity, we only show the GPOD wave-
duced and the window extension becomes necessary to miti-
forms as the conclusions are not affected by the Level-1b process-
ing in any of these cases. Due to the window extension and padding
gate this.
of the Hamming window on GPOD, the waveforms are shifted by In such cases, mitigation options include ensuring that the
256 and 512 bins for the double and triple extensions, respectively. target is defined early enough on the track to avoid conse-
quences for the dataset and extending the receiving window,
thus making sure that the full echo can fit in the receiv-
ing window and that the leading edge is preserved (Dinardo
flat. Figure 8 reveals several outliers at the last VS (A011) et al., 2018). In the example above, the latter is necessary
when using the standard GPOD processing options for in- when using the GPOD dataset, and although not critical to
land water (GPOD 2x). This is caused by incorrect retracking data retrieval, the position of the target was also shifted in
(points on the y = 0 axis in the waveform subplot) and erro- the OLTC update of March 2019. Based on these findings,
neous heights (WSE 10 to 20 m below the mean WSE). At we recommend using the triple window extension when pro-
the three other VSs, increasing the window extension factor cessing catchment-scale datasets on GPOD to maximize the
has no effect. The time series at A011 indicates that the triple number of VSs.
extension may be more robust even for plain areas. There-
fore, processing decisions should not be based on the topog- 4.3 River–floodplain interaction
raphy alone but instead take into account the on-board infor-
mation as well. Furthermore, we note that while the along- The Zambezi is home to several significant wetlands, e.g., the
track spread of the SciHub WSE is wider than the GPOD 3x Barotse floodplain, Kafue Flats and Chobe floodplain. At
observations, the final time series are similar. some VSs, the WSE reflects the river–floodplain interac-
tion. Figure 12 is an example from the Barotse flood-
4.2 Processing options on GPOD plain (VS B074). The crossing tracks are both close to the
river. The ascending track directly crosses the river, and
The Level-1b processing steps to generate the waveforms the waveforms and backscatter coefficients closely support
are different on GPOD and SciHub, and at some VSs this a good target. We do see multiple peaks in the waveform as
has clear consequences. Figure 10 shows the waveforms and the target nears the edge of the river. The other track crosses
WSE time series at VS A102 on the Kafue, located at 1116 m the floodplain. When considering the two tracks separately,
above the geoid. Using the OCOG retracker and the standard the interaction is clearly visible: the river level rises until it
SciHub dataset successfully produces a WSE time series with reaches the floodplain level. Subsequently, the river floods
a clear seasonal pattern. When using the GPOD dataset, a and water levels in the floodplain increase, before decreasing
Hydrol. Earth Syst. Sci., 25, 333–357, 2021 https://doi.org/10.5194/hess-25-333-2021You can also read