Sensitive environmental DNA (eDNA) methods to detect hemlock woolly adelgid and its biological control predators Leucotaraxis silver flies and a ...
←
→
Page content transcription
If your browser does not render page correctly, please read the page content below
Received: 29 September 2021 | Revised: 18 April 2022 | Accepted: 9 May 2022
DOI: 10.1002/edn3.317
ORIGINAL ARTICLE
Sensitive environmental DNA (eDNA) methods to detect
hemlock woolly adelgid and its biological control predators
Leucotaraxis silver flies and a Laricobius beetle
Anish Kirtane1,2 | Nicholas J. Dietschler1 | Tonya D. Bittner1 |
Marshall Bigler Lefebvre1 | Sabrina Celis1 | Katharine O'Connor1 | Nathan Havill3 |
Mark C. Whitmore1
1
New York State hemlock Initiative,
Cornell University, Ithaca, New York, USA Abstract
2
Institute of Biogeochemistry and Environmental DNA (eDNA) analysis can be a powerful tool for the early detec-
Pollutant Dynamics, Eidgenössische
Technische Hochschule Zürich, Zürich,
tion of invasive organisms. However, research on terrestrial eDNA detection from
Switzerland foliage surfaces has been limited. In this study, we developed methods to capture
3
USDA Forest Service, Northern Research and detect eDNA using qPCR from an invasive forest pest, hemlock woolly adelgid
Station, Hamden, Connecticut, USA
(Adelges tsugae), and three of its biological control predators Leucotaraxis piniperda,
Correspondence Leucotaraxis argenticollis, and Laricobius nigrinus. We designed four highly efficient
Anish Kirtane, New York State hemlock
Initiative, Cornell University, Ithaca, NY, qPCR assays with a low limit of detection (1–10 copies/reaction). The assay targeting
USA. A. tsugae was species-specific. The assays targeting Le. piniperda, and Le. argenticollis
Emails: dna.anish@gmail.com; anishajay.
kirtane@usys.ethz.ch were biotype-specific in addition to being species-specific demonstrating applications
of eDNA analysis beyond species-level detection. The La. nigrinus assay also detected
Funding information
New York State Department of DNA from closely related and hybridizing Laricobius rubidus. The eDNA methods were
Environmental Conservation, Grant/ evaluated against traditional detection methods. We collected foliage samples from
Award Number: #CM04068
three strata (bottom, middle, and top) of eastern hemlock trees to detect the pres-
ence of A. tsugae. The detection of the biological control predators was evaluated
using western hemlock foliage samples collected from the predators' native range in
western Washington. The eDNA methods had significantly higher positive detection
rates (2.8–4.5 times) than conventional methods of all target species. The strata of
sampling were not significant in determining the presence of A. tsugae infestation.
The eDNA concentration positively correlated with the observed density for all spe-
cies. This study demonstrates the efficacy of eDNA analysis as a more sensitive tool
for early detection of A. tsugae and to track the establishment of its biological control
predators.
KEYWORDS
Adelges tsugae, biological control, biotype-specific qPCR, eDNA, hemlock woolly adelgid,
invasive species, Laricobius nigrinus, Leucopis argenticollis, Leucopis piniperda
This is an open access article under the terms of the Creative Commons Attribution License, which permits use, distribution and reproduction in any medium,
provided the original work is properly cited.
© 2022 The Authors. Environmental DNA published by John Wiley & Sons Ltd.
Environmental DNA. 2022;00:1–14. wileyonlinelibrary.com/journal/edn3 | 12 | KIRTANE et al.
1 | I NTRO D U C TI O N of management programs. Current methods to identify A. tsugae in-
festation largely rely on visual observation of its characteristic white
Hemlock woolly adelgid, Adelges tsugae Annand, is a non-native pest wool from November through June (Costa & Onken, 2006; Fidgen
of eastern hemlock Tsuga canadensis Carrière and Carolina hemlock et al., 2016). The only known mode of reproduction in the introduced
Tsuga caroliniana Engelmann, two ecologically important foundation range is through parthenogenesis (Havill et al., 2016; McClure, 1989)
species in eastern North America providing a unique habitat for a with new populations able to establish with as few as one individual
diversity of wildlife species (Ellison et al., 2005; Orwig et al., 2012). (Tobin et al., 2013). New disjunct populations, therefore, consist of
A. tsugae is native to East Asia and western North America, whereas very few individuals and are difficult to detect. Adelgid predators are
in eastern North America, a single invasive genotype clone was in- also likely to be present in low numbers after local establishment and
troduced from Japan (Havill et al., 2016). In eastern North America, are difficult to detect visually. La. nigrinus is usually sampled by look-
A. tsugae was first reported in Virginia in the early 1950s (Stoetzel ing for immatures under a microscope on cut adelgid-infested hemlock
et al., 2002) and has spread to 21 states in the United States and branches in a laboratory, using simple traps to catch adults in the field
two Canadian provinces (Fidgen et al., 2014; Limbu et al., 2018). (Wiggins et al., 2016), beat-sheet sampling, or sampling larvae drop-
Throughout the introduced range in the east, A. tsugae has caused the ping from adelgid-infested hemlock branches in the laboratory (Mausel
decline and extensive mortality of its host tree species (Abella, 2018; et al., 2010). Techniques to evaluate the establishment of Leucotaraxis
Eschtruth et al., 2013; Gómez et al., 2015; Orwig et al., 2002). Cold spp. in the east have yet to be developed, but examining adelgid-
temperatures in the northern introduced range can cause mortal- infested branches under a dissecting microscope (Grubin et al., 2011)
ity of the overwintering A. tsugae sistens generation, leading to a and laboratory observation of adult emergence from adelgid-infested
temporary population reduction (McAvoy et al., 2017; Skinner branches have been used in the native western range (Neidermeier
et al., 2003; Trotter III & Shields, 2009). Adaptation of increased cold et al., 2020). Development of novel environmental DNA (eDNA) ap-
tolerance and climate change leading to milder winters are expected proaches may increase the detection sensitivity of both the pest and
to accelerate the northward spread of A. tsugae (Elkinton et al., 2017; predators, leading to better management of the pest and resources.
Ellison et al., 2018; Paradis et al., 2008), increasing the need for early Environmental DNA methods have aided in increasing the de-
detection techniques. Reliable methods of rapid and scalable early tection sensitivity of rare and invasive species in both aquatic and
detection of A. tsugae infestations are necessary for effective mo- terrestrial systems (Beng & Corlett, 2020; Rees et al., 2014; Ruppert
bilization of resources to implement management strategies and in- et al., 2019). eDNA is the DNA released by organisms through dead
crease their rate of success (Liebhold & Kean, 2019). cells, feces, mucus, etc. into the environment. This can be extracel-
Of the management strategies proposed for reducing tree mortal- lular DNA, or intracellular in individual cells or tissue. This eDNA
ity, silvicultural thinning (Brantley et al., 2017), chemical treatments can be collected and identified using molecular methods such as
(Doccola et al., 2007), biological control (Reardon & Onken, 2011), quantitative polymerase chain reaction (qPCR) for sensitive and
and host resistance (Kinahan et al., 2020; McKenzie et al., 2014) are species-specific detection. While eDNA-based detection methods
the most researched. Classical biological control involves the intro- have led to increased sensitivity in detecting rare or invasive spe-
duction of specialized predators from the pest's native range to re- cies in aquatic systems, their development and use in terrestrial sys-
duce pest populations to innocuous levels. Three potential specialist tems are limited (Beng & Corlett, 2020; Rees et al., 2014; Ruppert
predators of A. tsugae were identified from the Pacific Northwest of et al., 2019). This is primarily because eDNA released in aquatic en-
the USA, where A. tsugae is native (Havill et al., 2016; Havill, Vieira, vironments disperses readily allowing the eDNA to travel away from
& Salom, 2014). These include two species of Chamaemyiidae sil- the release site and still be detected (Andruszkiewicz et al., 2019;
ver flies, Leucotaraxis argenticollis Zetterstedt and Leucotaraxis pin- Sansom & Sassoubre, 2017). Unlike aquatic environments, eDNA
iperda Malloch, and a Derodonidae beetle Laricobius nigrinus Fender released on terrestrial substrates is not likely to homogeneously
(Kohler et al., 2008). All three predators are most abundant as ju- disperse in the environment. Early studies investigating eDNA on
veniles and adults during the A. tsugae egg-laying stages (Grubin terrestrial substrates relied on collecting soil samples for analysis
et al., 2011; Kohler et al., 2016). Other predators sourced from Asia (Buxton et al., 2018; Kirtane et al., 2019; Leempoel et al., 2020).
have been evaluated and some have been approved and released However, eDNA adsorbed to soil particles may remain preserved
(reviewed in Havill et al. 2014), but here we focused on these three from degradation and not represent the current occupancy of a spe-
because current research indicates they hold the most promise for cies (Cai et al., 2006; Demanèche et al., 2001; Kirtane et al., 2020).
the management of A. tsugae. Evaluating the success of biological Recently, species from Diptera and Coleoptera orders were identi-
control releases requires monitoring for the establishment and dis- fied using eDNA metabarcoding via non-invasive baited traps (Camila
persal of predators over time to inform management decisions such et al., 2021). However, few studies have focused on eDNA analysis
as augmenting releases and where to target future releases. This is directly from plant surfaces. eDNA methods have been employed
crucial, especially for the silver flies that are the newest agents to be to identify foraging mammals using DNA left behind on browsed
released (Grubin et al., 2011). woody vegetation (Nichols et al., 2012). Valentin et al. (2020) used
Increasing sensitivity to detect small populations, that is, early de- crop washing stations to aggregate eDNA from an invasive crop
tection of A. tsugae and its predators, is key to improving the impact pest, the brown marmorated stink bug (Halyomorpha halys, Stål). ThisKIRTANE et al. | 3
study also concluded that their eDNA method was more sensitive adult A. tsugae lay eggs in their woolly ovisacs in the native west-
in determining the presence of the pest, compared to conventional ern and introduced eastern range. During the time of this study,
blacklight or pheromone traps. However, it might be more challeng- any eastern A. tsugae present on branches would be expected to
ing to aggregate eDNA from forest pests than crop pests and thus range from first to third-instar nymphs (Gray & Salom, 1996; Joseph
require the development of additional capture methodologies. Spray et al., 2011). Pineus strobi Hartig, Pineus pini Macquart, Pineus pinifo-
aggregation and tree rolling methods to capture eDNA from another liae Fitch, Adelges abietis Linnaeus, Adelges cooleyi Gillette, Adelges
invasive forest pest in Northeastern USA, the spotted lanternfly laricis Vallot, and Adelges piceae Ratzeburg are closely related spe-
(Lycorma delicatula, White), were able to detect their presence ahead cies to A. tsugae and included in this study to test the specificity of
of visual surveys (Valentin et al., 2020). the eDNA methods.
While eDNA analysis is proven to be a useful tool for determining La. nigrinus belongs to a genus of beetles that have specialized on
presence/absence, an increasing body of research is geared towards adelgids and is one of the target biological control predators in this
estimating the abundance of the target species (Yates et al., 2019). study (Montgomery et al., 2011). Closely related non-t arget species
Most of the studies to date determining the abundance of target or- include that Laricobius rubidus LeConte is native to eastern North
ganisms using eDNA signals have focused on aquatic organisms (Rees America and hybridizes with the target La. nigrinus, Laricobius lati-
et al., 2014; Ruppert et al., 2019). eDNA concentration is determined collis Fall is native to western North America and co-occurs with the
by numerous factors influencing eDNA shedding, decay, and trans- target La. nigrinus, and Laricobius osakensis Montgomery is native to
port (e.g., life stage, density, temperature, sunlight exposure, pH, and Japan and released in the eastern United States for biological control
microbial activity), apart from the number or biomass of the organism of A. tsugae (Montgomery et al., 2011; Toland et al., 2018). These
(Andruszkiewicz et al., 2017; Barnes et al., 2014; Collins et al., 2018; related and potentially co-occurring species were included in this
Eichmiller et al., 2016; Goldberg et al., 2018; Jo et al., 2017; Lance study to test the specificity of eDNA methods. Photographs of all
et al., 2017; Seymour et al., 2018). Thus, the first step in developing life stages of La. nigrius are available in Limbu et al. (2018).
models to determine abundance using eDNA concentration is to de- The silver flies (Diptera: Chamaemyiidae) are a large group with
termine an empirical relationship between the two. at least 340 described species whose larvae are predatory on ster-
In this study, we develop and evaluate novel qPCR assays for norrhynchus Hemiptera (Gaimari & Havill, 2021). Both Leucotaraxis
the detection of A. tsugae (HWA), Le. argenticollis (LA), Le. piniperda species of interest, Le. argenticollis and Le. piniperda, have two bio-
(LP), and La. nigrinus (LARI). The acronyms, HWA, LA, LP, and LARI types with a different host and prey preferences (Havill et al., 2018;
are used to refer to the qPCR assays, while the species themselves Kohler et al., 2008; Motley et al., 2017). The non-t arget eastern lin-
are referred to using their Latin name in this manuscript. LA and LP eages (defined as North America east of the Great Plains) feed pri-
qPCR assays were designed to be specific to the western biotype in marily on pine bark adelgid (Pineus strobi), while the target western
addition to being species-specific. Using paired field samples of east- lineages (defined as North America west of the Great Plains) feed on
ern hemlock foliage from A. tsugae northern invasion front, we com- A. tsugae (Havill et al., 2018; Kohler et al., 2008; Motley et al., 2017).
pare the sensitivity of the eDNA (using HWA assay) approach with Since the eastern and western lineages cannot be distinguished mor-
the currently established visual detection methods. Using western phologically, post-release identification of Leucotaraxis spp. is one of
hemlock foliage infested with the western lineage of A. tsugae and the major challenges in monitoring the establishment of the silver
potentially with its native predators, we evaluated the sensitivity of flies released as biological controls. Photographs of these silver flies
detection of the predator species via eDNA and traditional sampling are available in Limbu et al. (2018) and Gaimari and Havill (2021).
methods. We also determined the relationship between eDNA con- Closely related non-t arget species Neoleucopis pinicola Malloch, and
centration and the density of the target species. Neoleucopis atratula Ratzeburg were also included to test the speci-
ficity of the eDNA methods.
2 | M E TH O D S
2.2 | Field sample collections
2.1 | Study species
We collected foliage of two hemlock species, eastern hemlock from
A. tsugae is a member of a small family of sap-sucking insects, which Dome Island at Lake George, New York, USA, and western hemlock
use conifers as host plants and have complex life cycles (Havill & from Washington, USA. Eastern hemlock foliage was collected to
Foottit, 2007). The largest of the A. tsugae adults average 1.4 mm test methods for detecting the invasive A. tsugae clone, while the
long and are covered with white wax extruded from pores to form western hemlock foliage was collected to detect the biological con-
a wool-like ovisac and are sedentary except for a brief first-instar trol predators.
dispersal stage (for photographs, see Limbu et al., 2018). During the Eastern hemlock foliage from Dome Island was collected be-
late summer months, the smaller settled first-instar nymphs enter tween October 21 and 23, 2020. The island was divided into 16
aestivation and lack conspicuous wool, thus making detection ex- sectors (of ~1 acre each), and one eastern hemlock tree was chosen
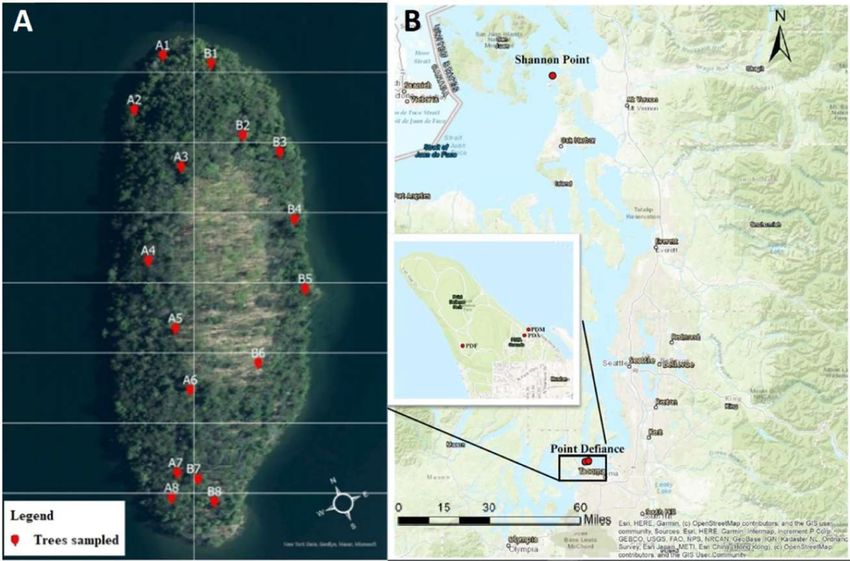
tremely difficult (McClure, 1989). In late winter through spring, from each of the 16 sectors based on height, branch distribution4 | KIRTANE et al.
(high live crown ratio), and structural integrity for safe climbing using 13, June 10, and October 10, and two tree-level samples from
single rope technique (Figure 1). We collected three samples from Shannon Point on May 1 and 27 (Table S2). All western hemlock
each tree at different heights, resulting in a total of 48 samples from foliage samples were collected from the lower and mid-canopy
the island. We collected the first sample from the lowest possible between 1 and 7 meters using a 5-meter pole pruner. The pruner
point on the tree, the second from the highest point that could be was sterilized and gloves change between each sample collection.
climbed, and the third approximately halfway between them. The Collaborators placed 15–60 g of foliage in 1 gal zip lock bags and
height of each sample collection, as well as the height of the tree, shipped overnight to the quarantine laboratory, Sarkaria Arthropod
was determined using a hypsometer. We collected 15–60 g samples Research Laboratory (SARL), in Ithaca, NY (USDA APHIS permit
of foliage (needles and stems) and sealed them in a 1 gal zip-seal bag P526P-18-0 0945). Samples were stored at −20°C for up to three
at each sampling height. Gloves were changed, and clippers were weeks before visual inspection and eDNA analysis.
rinsed with 4.5% hydrogen peroxide (Peroxigard™, Oakville, ON)
before each climb to reduce eDNA contamination. Preliminary ob-
servations had indicated denser infestation at the southern end of 2.3 | Visual inspection
the island; thus, we sampled from North to South to reduce eDNA
contamination through clothes, ropes, and climbing gear that could We conducted a visual inspection under a dissecting microscope
not be sterilized. Foliage samples were stored and transported on ice (10x-4 0x magnification) to count A. tsugae nymphs on eastern hem-
to the laboratory, where they were stored at −20°C for up to 3 weeks lock foliage. A similar process was used to find Leucotaraxis flies and
before visual inspection and eDNA analysis. La. nigrinus larvae on the western hemlock foliage. During the time
We collected western hemlock foliage samples infested with of western collections for this study, we could expect to find three
A. tsugae from three sites at Point Defiance Park (Marina: 47.31, larval instars or puparia (enclosed or intact) of Leucotaraxis flies,
−122.52; Aquarium: 47.30, −122.52; Fort: 47.30, −122.53) and one and larvae of La. nigrinus on western hemlock foliage (Dietschler
location at Shannon Point (48.51, −122.69) in western Washington, et al., 2021; Grubin et al., 2011; Kohler et al., 2016; Rose et al., 2020;
USA, between April and October 2020 (Table S2). Nine tree-level Zilahi-Balogh et al., 2003). For the enumeration of A. tsugae on
samples were collected from Point Defiance Park on April 15, May eastern hemlock, approximately half of the sampled foliage was
F I G U R E 1 (a) Map of Dome Island in Lake George, NY, indicating trees sampled in each of the 16 quadrants for detection of A. tsugae. (b)
Map showing sampling sites at Point Defiance and Shannon PointKIRTANE et al. | 5
separated (total length ranging from 64 to 270.5 cm) and the re- with freshly prepared 10% bleach after use. After every ten foliage
mainder was stored at −20°C for subsequent eDNA analysis. Foliage samples, one full-process negative control (total of 8 throughout the
length refers to the cumulative length of hemlock branchlets in the experiment) of 500 ml of DI water was filtered and processed along-
sample measured during the visual inspection process. Measuring side the samples, including filtration, DNA extraction, and qPCR to
the foliage while collecting and dividing can increase the probability monitor for the presence of eDNA contamination during the labora-
of eDNA contamination and was thus avoided. All results were nor- tory procedure.
malized by the foliage length (e.g., individuals per cm) before analysis.
We counted all visible nymphs on the subsample under a dissecting
microscope. Then, the cumulative length of the stems on the foliage 2.5 | DNA extraction
sample was measured to the nearest 0.1 cm and discarded. This sub-
sampling was done to reduce the probability of eDNA contamination We conducted all DNA extractions using the Qiagen DNeasy Blood
between samples during the enumeration. and Tissue kit. For eDNA extraction from filters, whole filters were
A. tsugae predators were sampled from their native range on used in place of animal tissues in the manufacturer's protocol and in-
western hemlock foliage. Since A. tsugae predators were expected cubated with 180 μl buffer ATL and 20 μl proteinase K for 3 h at 56°C
to be less abundant than A. tsugae on the foliage, we passed the en- with constant shaking at 300 rpm. The resulting lysate (no filter) was
tire (1.8–13.3 m) samples of western hemlock foliage through visual transferred to another microcentrifuge tube, and the remaining pro-
inspection before eDNA analysis. All Leucotaraxis larvae and puparia cedure was carried out according to the manufacturer's protocol.
found on the foliage were removed from the foliage and stored in- DNA extracted from filters was eluted in 50 μl of buffer AE, while
dividually in 2-ml microcentrifuge tubes for subsequent DNA ex- the DNA from Leucotaraxis larvae and reference samples was eluted
traction and identification to the species level using multiplex qPCR. in 100 μl of buffer AE. At least one full-process negative control was
Laricobius larvae were removed and discarded as they can be accu- included in each batch of DNA extractions to track contamination at
rately identified morphologically on western hemlock sampled from each stage of the process.
selected sites. This was done to ensure no intact target organisms
were accidentally included in the eDNA analysis. After visual inspec-
tion, the foliage was placed back in the bags and frozen at −20°C for 2.6 | qPCR assay development and testing
eDNA analysis.
We designed novel qPCR primers to amplify the mitochondrial cy-
tochrome oxidase subunit 1 (COI) gene of A. tsugae (HWA), Le. ar-
2.4 | eDNA collection from hemlock genticollis (LA), Le. piniperda (LP), and La. nigrinus (LARI) using NCBI
foliage samples Primer-BLAST (NCBI, Bethesda MD) and verified them for optimal
annealing temperature using Oligo Analyzer (IDT, Coralville, CA). For
We processed both eastern and western hemlock foliage samples LA and LP assays, sequences of only the western biotypes were used
similarly to capture the eDNA of target species. We removed the fo- as input to generate primers in Primer-BLAST. The accession num-
liage from the bags and placed it in bleach-sterilized 500-ml Nalgene bers for all sequences used for qPCR assay design are provided in
bottles. Gloves were changed before handling each sample. We Table S4. For designing the HWA and LARI assays, we aligned the se-
added 450 ml of DI water to each Nalgene, then capped and agitated quences of the PCR targets generated by Primer-BLAST in MEGA7
bottles by hand for 10 s to dislodge eDNA from the foliage and into (Pennsylvania State University, PA) along with the sequences of
the water. We pre-filtered the water through 0.3-mm nylon mesh to closely related and co-occurring species. The TaqMan® probes were
remove whole organisms and any large debris that may clog the fil- then designed “by-eye” probes that maximize species specificity
ters. The water was then directly poured into 500-ml vacuum filtra- and verified for specificity using the BLAST sequence analysis tool
tion funnels with a 0.8-μm track-etched polycarbonate membrane (Madden, 2013). For designing the biotype-specific assays for silver
(Whatman, Pittsburg, PA). The filtration was powered by a built-in flies, the species-specific primers generated in Primer-BLAST with
laboratory vacuum port in the fume hood. After the filtration, we most mismatches with the eastern biotypes were selected. Le. ar-
removed the filters using sterilized forceps and stored them in 2-ml genticollis and Le. piniperda target sequences were aligned in MEGA7
microcentrifuge tubes at −20°C until DNA extraction. Preliminary with their corresponding sequences from the eastern biotypes of
experiments showed that samples with over 60 g of foliage either the silver flies. The TaqMan® probes were designed “by-eye” to
clogged the filters during filtration or the silica spin column during maximize mismatches with the eastern biotypes (Figure S1). The LA
DNA extraction. Thus, we divided samples with over 50 g of foliage and LP assays targeting the western biotype had 6 and 8 mismatches
into two portions. We filtered and extracted the two portions sepa- with the corresponding sequences of the eastern biotypes Le. ar-
rately, but their eluates were combined at the end of DNA extrac- genticollis and Le. piniperda. Hairpin, self-dimer, and hetero-dimer
tion. This process was performed for 5 eastern hemlock samples, analyses were also conducted on the primer and probe sequences
and 24 western hemlock samples. All materials including Nalgene using Oligo Analyzer to ensure efficient qPCR. For simplex qPCR,
bottles, nylon mesh, filtration funnels, and tweezers were cleaned we labeled all TaqMan probes with FAM fluorophore and double6 | KIRTANE et al.
quenched with ZEN™ quencher (IDT, Coralville, CA). For multiplex fragment (Table S3). We quantified the copy number of the gBlocks
qPCR, we designed an additional probe for Le. argenticollis with the using Qubit 4.0 (Life Technologies, Carlsbad, CA). We ran 7-point
same sequence but with TAMRA fluorophore and quencher (IDT, gBlock standard curves ranging from 1 to 106 copies per reaction
Coralville, CA). in triplicate on each qPCR plate of a given assay to ensure consis-
While all qPCR assays were tested for specificity in silico using tently efficient qPCRs. Limit of quantification (LOQ) was defined
Primer-BLAST during the design process, we also tested the spec- as the lowest standard concentration at which all qPCR replicates
ificity of the assays experimentally using qPCR with the template amplified above the threshold (Ambruster & Pry, 2008; Kirtane
DNA from all possibly co-occurring and closely related species to et al., 2019; Xia et al., 2018). All samples above the LOQ were con-
our targets. In the case of A. tsugae (HWA assay), this included test- verted from cycle threshold (Ct) values to copies/reaction using the
ing the specificity using DNA extracted from P. strobi, P. pini, P. pin- standard curve equation of the given assay (Table 1). For analysis,
ifoliae, A. abietis, A. cooleyi, A. laricis, and A. piceae. Both LA and LP copies/reaction was then converted to copies/g foliage for eastern
assays (targeting Le. argenticollis and Le. piniperda, respectively) were hemlock and copies/cm foliage for western hemlock foliage. The
tested against DNA extracted from closely related and co-occurring standard curve equation was determined by pooling all the standard
N. pinicola and N. atratula. The LA qPCR assay targeting Le. argenti- curves obtained throughout the experiment. All samples with Ct
collis was tested against Le. piniperda DNA and vice versa to check values above the LOQ or in which only one or two replicates were
for non-specific amplification of the two closely related species amplified were retested to check for contamination at the qPCR
often released at the same sites for biological control. Apart from level. If the results remained unchanged after the re-test, indicating
being species-specific, the LA and LP assays were also designed to no qPCR contamination, the samples were considered positive, but
be specific to western biotypes of Le. argenticollis and Le. piniperda. below the limit of quantification (BLOQ).
The biotype level specificity was tested with triplicate qPCR using
a 7-point standard curve (1–106 copies/reaction) made from Gene
Fragments (Twist Bioscience, San Francisco, CA) designed using 2.7 | qPCR protocol
corresponding sequences from eastern biotypes of Le. argenticollis
and Le. piniperda (Figure S1). The LARI assay (targeting La. nigrinus) All qPCRs were run in 96-well plates in a ViiA 7 Thermocycler (Applied
was tested for specificity using the DNA extracted from La. rubidus, Biosystems, Foster City, CA) at the Biotechnology Resource Center
La. laticollis, and La. osakensis. at Cornell University. All environmental samples were analyzed in
To test for the efficiency of the qPCR assays, gBlocks™ Gene triplicate. Each qPCR plate had a triplicate standard curve and three
Fragments were obtained from IDT (Coralville, IA) (Table S3). We reaction wells designated for qPCR negative controls. Each reaction
placed Le. piniperda and La. nigrinus target sequences individually on well contained 10 μl 2x TaqMan Environmental Mastermix, 0.6 μM
separate gBlock fragments, while Le. argenticollis and A. tsugae target final concentration of each primer, 0.3 μM concentration of TaqMan
sequences were placed adjacent to each other on the same gBlock probe, 2 μl template DNA, and molecular grade water to bring volume
TA B L E 1 qPCR parameters for assays developed in this study
LOQ (copies / Amplicon
Target species Oligonucleotide sequence (5′ → 3′) Slope Intercept Efficiency reaction)a size (bp)
Adelges tsugae HWA forward—ACAGGATGAACAATTTACCCAC −3.43 41.62 0.96 1 246
HWA reverse—AGCACCTGCTAGAACAGGTAAGG
HWA probe—
CCATTATTCCCATGATCAATTTTAATTACTGC
Leucotaraxis LA forward—ACCCGGGAGCATTAATTGGA −3.34 39.33 0.99 1 242
argenticollis LA reverse—ACCAGCTCCATTTTCCACTCT
LA probe—TGTAATTGTAACAGCCCACGCATTTG
TAATAAT
Leucotaraxis LP forward—AGGAGCCCCTGATATGGCTT −3.43 42.38 0.96 1 168
piniperda LP reverse—ACAGAAGCACCTCTATGGGC
LP probe—AGGTTGAACAGTTTACCCCCCTTTAT
CATCTAA
Laricobius LARI forward—GGCGCCTGAGCAGGAATAGT −3.47 39.85 0.94 10 120
nigrinus LARI reverse—AGCATGGGCTGTTACAATAACG
LARI probe—
ACTTCTCTTAGACTTTTAATTCGGGCAGA
a
LOQ refers to the limit of quantification defined as the lowest gBlock standard concentration at which all qPCR replicates amplify above the
threshold.KIRTANE et al. | 7
up to 20 μl. Cycling parameters started with incubation at 95°C for The LA assay and LP assay did not cross-amplify DNA from Le. pin-
10 min followed by 40 cycles of denaturation at 95°C for 30 s, and iperda and Le. argenticollis, respectively, allowing multiplex qPCR for
an annealing/extension step at 60°C for 45 s. The qPCR threshold the identification of larvae and pupae dissected from foliage sam-
was set at 0.03 ΔRn throughout the experiment for consistency in ples. The LA and LP assays were also determined to be biotype-
comparing results throughout the study (Baccari et al., 2020; Cao specific in addition to being species-specific. The LA assay did not
et al., 2013; Kirtane et al., 2019). detect gene fragments from the eastern biotype of Le. argenticollis
Simplex qPCRs were run in triplicate for all environmental sam- on a gBlock standard curve of 106 to 1 copy/reaction. The LP assay
ples, and the average of the three values was used in statistical only amplified one of the three replicates of Le. piniperda eastern
analyses. Simplex qPCR was also used for all the standard curves biotype gBlock at the highest concentration tested, 106 copies/reac-
and assay specificity tests. We conducted duplex qPCR to identify tion, with a high Ct value (37.4) and showed no amplification at lower
Leucotaraxis larvae and puparia from foliage samples to the species concentrations. This reduces the probability of accidentally detect-
level. For the duplex PCR, we followed the same protocol as simplex ing eDNA from native eastern biotypes of the two species (Table 1).
but added both assays, LP (FAM-labeled) and LA (TAMRA-labeled), All assays had high amplification efficiencies (94–99%). The LA, LP,
in the qPCR mix. and HWA assays had a low limit of detection (LOD) of 1 copy/reac-
tion and 10 copies/reaction for the LARI assay (Table 1). None of the
full process negative controls or the qPCR negative controls showed
2.8 | Statistical analysis amplification for any of the target species indicating a low chance of
contamination during the sample process and qPCR analysis.
We performed McNemar's test to determine whether there was a
significant increase in positive detection rates using eDNA methods
when compared with conventional visual inspection methods for 3.2 | Detection of A. tsugae on eastern hemlock
each of the four target species. We used single-factor ANOVA to de- using visual inspection and eDNA analysis
termine differences in A. tsugae infestation between the three strata
(Bottom, Mid, and Top) using both nymph density (visual inspection) Sub-samples collected from each of the eastern hemlock samples
and A. tsugae eDNA concentration. We analyzed the relationship be- for visual inspection at Dome Island ranged from 64 to 270.5 cm
tween density as measured by visual inspection, and eDNA concen- of cumulative branch length per sample (Table S1). The presence of
tration using linear regression for each of the four target species. We A. tsugae was detected visually on 11of 48 samples. The densities of
log-transformed eDNA concentration since the data deviated from a A. tsugae nymphs ranged from 0.005 to 6.921 nymphs/cm. These 11
normal distribution. The target eDNA concentration in samples cat- positive foliage samples were collected from 6 out of the 16 trees
egorized as BLOQ is likely to be very low. Thus, for the regression sampled (Table 2 and Table S1).
analyses, we assigned them a concentration value of one order of
magnitude lower than the lowest quantifiable concentration for the TA B L E 2 Cross-t abulation of the number of detects and non-
given target. The BLOQ samples with A. tsugae, Le. piniperda, Le. ar- detects of target species using visual and eDNA based methods
genticollis, and La. nigrinus targets were assigned eDNA concentra-
eDNA eDNA
tion values of 0.3 eDNA copies/g, 53.4 eDNA copies/cm, 0.5 eDNA detects non-detects Total
copies/cm, and 3.4 eDNA copies/cm, respectively. Alpha value was
Target species: Adelges Tsugae
set to 0.05 for all statistical analyses. All statistical analyses we con-
Visual detects 11 0 11
ducted using R (R Core Team, 2021).
Visual non-detects 31 6 37
Total 42 6 48
3 | R E S U LT S Target species: Leucotaraxis piniperda
Visual detects 12 0 12
3.1 | Performance of qPCR assays Visual non-detects 22 4 26
Total 34 4 38
All qPCR assays were tested for specificity and efficiency before Target species: Leucotaraxis argenticollis
using them for sample analysis. No cross-amplification was detected Visual detects 6 1 7
using the HWA assay against DNA from any of the non-t arget adelgid Visual non-detects 14 17 31
species. For the LARI assay, no cross-amplification was detected for
Total 20 18 38
La. laticollis and La. osakensis, but DNA from La. rubidus did amplify.
Target species: Laricobius nigrinus
Despite multiple attempts to re-design and improve the specificity
Visual detects 8 1 9
of the LARI assay, non-specific amplification on La. rubidus DNA was
Visual non-detects 23 6 29
still detected in all five individuals of La. rubidus tested. Neither the
Total 31 7 38
LA nor the LP assays amplified DNA from N. pinicola or N. atratula.8 | KIRTANE et al.
The remainder of eastern hemlock foliage (i.e., the sub-sample not ranging from 1.63 m to 13.33 m (Table S2). In total, 92 silver fly larvae
used in visual inspection) collected from Dome Island was used for and puparia were removed, and their DNA extracted and identified
eDNA analysis. The mass of the foliage samples ranged from 16.1 using duplex qPCR. Le. argenticollis larvae and puparia (n = 28) were
to 58.7 g (Table S1). A. tsugae eDNA was detected on each of the identified from 7 samples with densities ranging from 0.09–1.54
16 trees sampled. qPCR amplification using the HWA assay was ob- individuals/m (Table S2). Le. piniperda larvae and puparia (n = 63)
served in 43 out of 48 foliage samples, in at least one of the three were identified from 12 foliage samples with densities ranging from
qPCR replicates (Table 2 and Table S1). Out of the 43 foliage sam- 0.11 to 4.17 individuals/m (Table S2). One larva did not amplify using
ples that were positive for A. tsugae eDNA, 40 amplified in all three either LA or LP qPCR assays, so could have been N. atratula, which
qPCR replicates, while 3 samples amplified in one or two replicates is occasionally found feeding on A. tsugae in western North America
(Table S1). We repeated triplicate qPCR on these three samples (Neidermeier et al., 2020). Only 2 samples had individuals from both
and obtained the same result (i.e., amplification below the limit of Leucotaraxis species, while neither species was observed in 21 of 38
quantification or amplification of fewer than three replicates). This samples (Table S2). A total of 67 La. nigrinus larvae were identified
confirmed the absence of contamination at the qPCR level in these from seven foliage samples with densities ranging from 0.09 to 7.14
samples. Thus, these samples were considered positive, but below individuals / m (Table S2). Either Le. argenticollis or Le. piniperda were
the limit of quantification (BLOQ). The concentrations of quantifiable found alongside La. nigrinus on 5 of those samples, while 17 samples
samples ranged from 3.12 to 203521.31 eDNA copies / g of eastern had none of the three predators (Table S2). At Point Defiance, the
hemlock foliage (Table S2). McNemar's test reported a significant in- April 15 sample had Le. piniperda and La. nigrinus, May 13 had all
crease in positive detection rates using eDNA analysis to indicate the three predators, June 10 had Le. argenticollis and La. nigrinus, and
presence of A. tsugae (p < 0.001). There was no significant difference October 10 had Le. piniperda and Le. nigrinus. Shannon Point had
in A. tsugae infestation between the three strata of eastern hemlock La. nigrinus present in both samples, and Le. argenticollis was pre-
trees sampled on Dome Island when measured by both ovisac den- sent in only the May 27 sample. While nine tree-level samples were
sity (ANOVA, p = 0.58) and A. tsugae eDNA concentration (ANOVA, collected at each Point Defiance sampling period, the presence of
p = 0.39) (Figure 2). There was a weak positive relationship between both species was only found in one tree level sample during the May
A. tsugae density as measured by visual inspection and its eDNA con- 13 and October 10 sample periods, respectively. Using the conven-
centration (n = 42, R 2 = 0.22, p = 1.0e-03) (Figure S2). tional visual inspection methods, none of the samples had all three
predator species.
After visual inspection, removal, and identification of target pred-
3.3 | Detection of biological control species using ators, the same 38 foliage samples were assayed using eDNA analy-
visual inspection and eDNA analysis sis. Le. argenticollis eDNA was detected on 21 samples out of which
9 were categorized as BLOQ and 12 were quantified with concen-
A total of 234.93 m of foliage over 38 western hemlock samples trations ranging from 5.4 to 1431.9 copies / m (Table 2 and Table S2).
was carefully examined under a dissecting microscope in search of Le. piniperda eDNA was detected in 34 samples out of which 9 were
A. tsugae predators, with an average length per sample of 6.18 m categorized as BLOQ and 25 were quantified with concentrations
F I G U R E 2 Detection of A. tsugae on three strata of eastern hemlock trees on Dome Island, NY, using (a) visual and (b) eDNA identificationKIRTANE et al. | 9
ranging from 533.7 to 5,261,438.5 copies / m (Table 2 and Table S2). of A. tsugae infestations and evaluating successes of biological con-
eDNA, from both Le. piniperda and Le. argenticollis, was detected in trol releases.
18 samples with only one sample with no eDNA from either of the
silver flies (Table 2 and Table S2). La. nigrinus eDNA was detected in
31 samples out of which 3 were categorized as BLOQ and 28 were 4.1 | qPCR assay performance
quantified with concentrations ranging from 34.6 to 226,951.5 cop-
ies / m (Table 2 and Table S2). eDNA belonging to all the three species All the qPCR assays designed and tested in this study had a high
was detected in 16 samples, and there were no samples from which amplification efficiency and low limit of detection making them ideal
eDNA was not detected from any of the three predators (Table S2). for use in identifying and quantifying eDNA. All qPCR assays except
McNemar's test showed an increase in positive detection rates for all LARI, targeting La. nigrinus, were species-specific. The LA and LP as-
three biological control predator species (Le. piniperda, p = 9.44E-07; says targeting Le. argenticollis and Le. piniperda, respectively, were
Le. argenticollis, p = 1.15E-03; La. nigrinus, p = 1.81E-05). There was not only species-specific but also biotype-specific. This broadens the
a weak positive relationship between eDNA concentration and the scope of eDNA applications to monitor biological diversity beyond
2
density of Le. piniperda (n = 34, R = 0.22, p = 5.0E-03) and La. ni- species-level to population-level detection. Studies using metabar-
grinus (n = 31, R 2 = 0.18, p = 1.0E-02), but the relationship was not coding approaches have also been able to acquire population-level
significant for Le. argenticollis (n = 21, R 2 = 0.12, p = 0.14) (Figure S2). genetic information from eDNA samples collected from seawater
(Parsons et al., 2018; Sigsgaard et al., 2016). Identification below
the species level is especially important for tracking introduced bio-
4 | DISCUSSION logical control agents because there can be an intraspecies variation
that is correlated with the differences in biological control specificity
Adelges tsugae infestation is a critical threat to eastern hemlocks, a or efficiency (Andersen & Wagner, 2016).
foundation species impacting the dependent ecosystems and wild- The LARI assay amplified non-t arget La. rubidus, a co-occurring
life (Orwig et al., 2002). Rapid and early detection of infestations is species that hybridizes with La. nigrinus in eastern release sites
critical for making effective management decisions and their success (Fischer et al., 2015; Havill et al., 2012). While the LARI assay may
(Liebhold & Kean, 2019). The northward movement of the infesta- not be ideal for monitoring the establishment and dispersal of La. ni-
tions and the recent first discovery in Adirondack Forest Preserve grinus in the east, this non-specific amplification did not impede
in New York are especially concerning due to the abundance of La. nigrinus detection on western hemlock samples as La. rubidus is
hemlock in the region (Albright et al., 2020; DEC, 2020). The eDNA not distributed in western North America (Brown, 1944; Lawrence
methods described in this study may be a step in widespread simul- & Vaurie, 1983). It may be possible to design additional qPCR assays
taneous monitoring of very early-stage A. tsugae infestations and targeting other mitochondrial or nuclear genes specific to La. nigri-
detecting the establishment of three of its most promising special- nus. This would require efforts to build up reference libraries for new
ist biological control predators. The positive detection rate of the target genes for both species. However, currently, we cannot elimi-
pest and its biological control predators was 2.8–4.5 times higher nate the chance of detecting hybridized La. nigrinus x La. rubidus indi-
using eDNA methods than conventional methods (Tables 2 and 3). viduals or pure La. rubidus individuals co-occurring in the same forest
A similar increase in detection sensitivity has been reported in a stand without further tests like sequencing qPCR amplicons, or PCR
previous study detecting invasive spotted lanternflies in vineyards restriction fragment length polymorphism (Davis et al., 2011).
(Allen et al., 2021). Furthermore, the visual inspections in this study
were considerably time-consuming with a total of 58.2 m of eastern
hemlock and 234.9 m of western hemlock foliage being visually in- 4.2 | Interpreting positive detection rates of
spected. Due to additional benefits of the eDNA methods such as eDNA and traditional sampling methods
lower cost and higher efficiency especially when scaled up (Davy
et al., 2015; Kirtane et al., 2019; Smart et al., 2016), we strongly rec- As eDNA methods gain more widespread use in pest and natural
ommend the incorporation of this technique for regular monitoring enemy detection (Valentin et al., 2020), it is important to clarify how
TA B L E 3 Positive detection rate
Number of Positive detection rate Positive detection rate
of target species using conventional
Species samples (visual inspection) (eDNA analysis)
methods and novel eDNA based methods
developed in this study Adelges tsugae 48 22.9% 89.6%
Leucotaraxis 38 18.4% 55.3%
argenticollis
Leucotaraxis 38 31.6% 89.6%
piniperda
Laricobius nigrinus 38 18.4% 81.6%10 | KIRTANE et al.
the data can be interpreted and what conclusions can be drawn. decisions. This study only collected samples from the invasion front
McNemar's test indicated the results provided by the eDNA test which typically has smaller populations, thus the concentration of
were significantly more sensitive than visual inspection for all target data points near zero (Figure S2). Future studies could utilize con-
species in this study. In the case of A. tsugae detection, the eDNA trived samples from varying levels of infestation to potentially de-
was detected on all 16 trees, while visual inspection detected them termine a relationship between A. tsugae eDNA concentration and
on only 6 trees. A similar increase in sensitivity using eDNA detec- infestation level for A. tsugae over a broader range. Understanding
tion of another terrestrial insect pest, the spotted lanternfly, has environmental factors that contribute to the temporal persistence of
been reported (Allen et al., 2021). Visual inspection methods can be eDNA on foliage surfaces can further bolster the model predictions.
limited spatially and temporally, while eDNA can persist over time
and be transported easily through space. While studies exploring
eDNA degradation rates on foliage are limited, agromyzid leafminer 4.3 | Ecological insights from detection of
(Liriomyza sativae Blanchard) eDNA was found 28 days after the biological control predators on western hemlock
leafmines became empty (Pirtle et al., 2021) and mammal eDNA has
been reported to persist for up to 24 weeks on foliage after brows- Data from eDNA surveys in conjunction with traditional sampling
ing (Nichols et al., 2012), but eDNA associated with A. tsugae wool techniques can also be used to advance the ecological knowledge
may be protected for longer periods through shading or adsorption of target species. Previous studies have found a temporal overlap of
(Kessler et al., 2020; Kirtane et al., 2020; Valentin et al., 2021). these two Leucotaraxis species during the larval stage when aggre-
Similar to understanding its persistence, it is important to ac- gating observations from multiple locations (Dietschler et al., 2021;
count for the influence of eDNA transport while interpreting posi- Rose et al., 2020), but that adult emergence is temporally asyn-
tive results. eDNA may be transported over short distances through chronous at the site level (Dietschler et al., 2021; Neidermeier
wind or from higher branches through rainfall (Valentin et al., 2021). et al., 2020). Our study only found both species in the same tree
Just like the spread of A. tsugae themselves, their eDNA can be sample in two out of the 21 samples where Leucotaraxis were de-
transported over long distances via birds and other insect vectors tected, with overlap occurring in only the May 13 and October 10,
(Russo et al., 2016; Russo et al., 2019). For these reasons, it is im- 2020, sampling periods. Only Le. piniperda were detected in Point
portant to acknowledge that eDNA methods may result in false pos- Defiance samples collected in April, with species overlap in May,
itives and may not indicate localized infestations. However, these transitioning to only Le. argenticollis in June, suggesting site-level
false positives can be used to predict new invasions ahead of time, sequential trends at the tree level. By contrast, 18 samples had posi-
especially in the case of A. tsugae, as the dispersal agents of eDNA tive eDNA detection for both Le. argenticollis and Le. piniperda, likely
likely also transport the pest. Furthermore, the scalability and cost- due to persistence of eDNA on foliage. While further exploration of
effectiveness of eDNA-based methods could be used for regular site-level community dynamics and niche separation of the preda-
surveying of vast expanses of habitat and can help narrow down tors in this system is needed, our data suggest that larval presence
specific areas for subsequent visual surveys or management (Biggs could follow similar trends as adults when evaluated at site and/or
et al., 2015; Davy et al., 2015; Evans et al., 2017; Huver et al., 2015; tree level. The potentially limited physical overlap of the two spe-
Kirtane et al., 2019). For example, sites with positive signals for cies of Leucotaraxis highlights the importance of being able to detect
A. tsugae eDNA can be prioritized for visual inspection. Sites with the presence of preserved eDNA in the absence of the organism.
visual confirmation of the pest can then be treated to eradicate or Further studies exploring the persistence of eDNA associated with
contain the spread as early detection increases the success rate of foliage surfaces and A. tsugae wool will enhance the interpretation
these measures (Liebhold & Kean, 2019). of positive eDNA detections, and aid in developing strategies to use
Understanding the relationship between eDNA concentration visual inspection complimentary with eDNA surveillance.
and observed density can help estimate the level of infestation of
the pest and the success of the establishment of the predators.
There were positive relationships among visually observed density 4.4 | Next steps and new frontiers
and eDNA detection for A. tsugae, Le. piniperda, La. nigrinus, and
Le. argenticollis but the observed density only accounted for 22%, This study provides progress towards developing comprehen-
22%, 18%, and 12% of the variation, respectively (Figure S2). The sive rapid detection techniques for monitoring forest pests.
relationship was not considered statistically significant (p > 0.05) in Improvements in sampling protocol and eDNA processing that re-
the case of Le. argenticollis. A recent study investigating a similar cor- duce costs and control contamination, as well as the development of
relation with spotted lanternflies in grape vineyards found that 71% on-site methods, will enhance the utility of this tool. Our data from
of the variation in visual observations could be explained by their Dome Island showed no significant difference between eDNA con-
eDNA signal (Allen et al., 2021). Determining a more precise level centrations detected on three strata of eastern hemlock sampled,
of A. tsugae infestations could greatly enhance the utility of eDNA demonstrating that collections from ground level (low strata) may
data generated from surveys and in turn aid in better management be sufficient for detecting infestations thus reducing survey time,KIRTANE et al. | 11
costs, and potential contamination from the use of climbing gear. REFERENCES
Sampling water from streams or rivers for A. tsugae and its predators Abella, S. R. (2018). Forest decline after a 15-year “perfect storm” of inva-
may also be a viable method. Small amounts of rain can significantly sion by hemlock woolly adelgid, drought, and hurricanes. Biological
Invasions, 20(3), 695–707.
reduce eDNA on aboveground surfaces (Valentin et al., 2021), caus-
Albright, T. A., Butler, B. J., Crocker, S. J., Drobnack, J. M., Kurtz, C.
ing it to flow into streams or rivers. Since eastern hemlocks dominate M., McWilliams, W. H., Morin, R. S., Nelson, M. D., Riemann, R.,
riparian habitats (Ellison et al., 2005), rivers could act as “conveyor Vickers, L. A., Walters, B. F., Westfall, J. A., & Woodall, C. W.
belts” collecting and transporting eDNA used to detect presence in (2020). New York forests 2017. Resource bulletin NRS-121 (p. 118).
US Department of Agriculture, Forest Service, Northern Research
the entire watershed (Deiner et al., 2016; Deiner & Altermatt, 2014).
Station. https://doi.org/10.2737/NRS-RB-121 121, 1–118.
If A. tsugae eDNA can be detected in rivers and streams, it could Allen, M. C., Nielsen, A. L., Peterson, D. L., & Lockwood, J. L. (2021).
result in broader resolution sampling that could be followed up by Terrestrial eDNA survey outperforms conventional approach for
targeted sampling to zero in on infestation. Recent advances in the detecting an invasive pest insect within an agricultural ecosystem.
Environmental DNA.
development of air eDNA capture methodology may present an ad-
Alzaylaee, H., Collins, R. A., Shechonge, A., Ngatunga, B. P., Morgan, E.
ditional route to monitor the terrestrial insect community, including R., & Genner, M. J. (2020). Environmental DNA-based xenomoni-
invasive species (Clare et al., 2021; Roger et al., 2022). With novel toring for determining Schistosoma presence in tropical freshwa-
capture methods, advancements in on-site eDNA processing will ters. Parasites & Vectors, 13(1), 63.
allow surveyors to process eDNA samples within 30 min, as dem- Ambruster, D., & Pry, T. (2008). Limit of blank, limit of detection and limit
of quantification. Clinical Biochemist Reviews, 29(Suppl 1), S49–S52.
onstrated in the case of invasive silver carp (Hypophthalmichthys
Andersen, J. C., & Wagner, D. L. (2016). Systematics and biological con-
molitrix Valenciennes) (Doi et al., 2020). Furthermore, develop- trol. In Integrating Biological Control into Conservation Practice (pp.
ment in species-specific Loop-Mediated Isothermal Amplification 105–129). Wiley Blackwell.
(LAMP) could be developed to replace qPCR (Alzaylaee et al., 2020; Andruszkiewicz, E. A., Koseff, J. R., Fringer, O. B., Ouellette, N. T., Lowe,
A. B., Edwards, C. A., & Boehm, A. B. (2019). Modeling environmen-
Williams et al., 2017). LAMP analysis can be conducted with minimal
tal DNA transport in the coastal ocean using Lagrangian particle
equipment and report the presence/absence of target DNA based tracking. Frontiers in Marine Science, 6, 477.
on a color change observable through the naked eye (Alzaylaee Andruszkiewicz, E. A., Sassoubre, L. M., & Boehm, A. B. (2017).
et al., 2020; Williams et al., 2017) can further improve rapid on-site Persistence of marine fish environmental DNA and the influence of
sunlight. PLoS One, 12(9), e0185043.
detection of eDNA.
Baccari, O., Elleuch, J., Barkallah, M., Boukedi, H., Ayed, N. B., Hammami,
A., Fendri, I., & Abdelkafi, S. (2020). Development of a new TaqMan-
AU T H O R C O N T R I B U T I O N S based PCR assay for the specific detection and quantification of
AK, ND, TDB, and MW conceptualized the experiments. All authors Simkania negevensis. Molecular and Cellular Probes, 53, 101645.
Barnes, M. A., Turner, C. R., Jerde, C. L., Renshaw, M. A., Chadderton,
contributed to sample collection and/or processing. All authors con-
W. L., & Lodge, D. M. (2014). Environmental conditions influence
tributed to drafting and revising the manuscript. eDNA persistence in aquatic systems. Environmental Science &
Technology, 48(3), 1819–1827.
AC K N OW L E D G M E N T S Beng, K. C., & Corlett, R. T. (2020). Applications of environmental DNA
(eDNA) in ecology and conservation: Opportunities, challenges and
We thank Peter Schweitzer and Cornell's Biotechnology Resource
prospects. Biodiversity and Conservation, 29(7), 2089–2121.
Center for access to the qPCR facility, Metropolitan Parks Tacoma, Biggs, J., Ewald, N., Valentini, A., Gaboriaud, C., Dejean, T., Griffiths,
and Western Washington University for providing sampling sites, R. A., … Brotherton, P. (2015). Using eDNA to develop a national
Matthew E. Lonsdale, Carol Brouillette, and Ian Roberts for collect- citizen science-based monitoring programme for the great crested
ing western hemlock samples, and Lynn Johnson from the Cornell newt (Triturus cristatus). Biological Conservation, 183, 19–28.
Brantley, S. T., Mayfield, A. E., III, Jetton, R. M., Miniat, C. F., Zietlow,
Statistical Consulting Unit. Thank you to the NYS Department
D. R., Brown, C. L., & Rhea, J. R. (2017). Elevated light levels re-
of Environmental Conservation, the Nature Conservancy, and duce hemlock woolly adelgid infestation and improve carbon bal-
the Lake George Land Conservancy for providing access to ance of infested eastern hemlock seedlings. Forest Ecology and
Dome Island. Lastly, we thank the New York State Department Management, 385, 150–160.
Brown, W. J. (1944). Some new and poorly known species of coleoptera,
of Environmental Conservation (Grant number: #CM04068) for
II. The Canadian Entomologist, 76(1), 4–10.
funding this research. Buxton, A. S., Groombridge, J. J., & Griffiths, R. A. (2018). Seasonal vari-
ation in environmental DNA detection in sediment and water sam-
C O N FL I C T O F I N T E R E S T ples. PLoS One, 13(1), e0191737.
Cai, P., Huang, Q.-Y., & Zhang, X.-W. (2006). Interactions of DNA with
The authors of this manuscript report no conflicts of interest.
clay minerals and soil colloidal particles and protection against
degradation by DNase. Environmental Science & Technology, 40(9),
DATA AVA I L A B I L I T Y S TAT E M E N T 2971–2976.
The data generated in this study is publicly available in a Dryad re- Camila, L., Tony, D., Alice, V., Pauline, J., & Pierre, J.-R . (2021). A novel
trap design for non-lethal monitoring of dung beetles using eDNA
pository DOI https://doi.org/10.5061/dryad.rn8pk0 pcz
metabarcoding. Journal of Insect Conservation, 25(4), 629–6 42.
https://doi.org/10.1007/s10841-021-0 0329- 4
ORCID Cao, Y., Sivaganesan, M., Kinzelman, J., Blackwood, A. D., Noble, R. T.,
Anish Kirtane https://orcid.org/0000-0001-8898-4275 Haugland, R. A., Griffith, J. F., & Weisberg, S. B. (2013). Effect ofYou can also read