Secondary aerosol formation alters CCN activity in the North China Plain
←
→
Page content transcription
If your browser does not render page correctly, please read the page content below
Atmos. Chem. Phys., 21, 7409–7427, 2021
https://doi.org/10.5194/acp-21-7409-2021
© Author(s) 2021. This work is distributed under
the Creative Commons Attribution 4.0 License.

Secondary aerosol formation alters CCN activity in the
North China Plain
Jiangchuan Tao1,2 , Ye Kuang1,2 , Nan Ma1,2 , Juan Hong1,2 , Yele Sun3,4,5 , Wanyun Xu6 , Yanyan Zhang1 , Yao He3 ,
Qingwei Luo1 , Linhong Xie1,2 , Hang Su7 , and Yafang Cheng7
1 Institutefor Environmental and Climate Research, Jinan University, Guangzhou, Guangdong 511443, China
2 Guangdong-Hongkong-Macau       Joint Laboratory of Collaborative Innovation for Environmental Quality, Guangzhou, China
3 State Key Laboratory of Atmospheric Boundary Layer Physics and Atmospheric Chemistry, Institute of Atmospheric

Physics, Chinese Academy of Sciences, Beijing 100029, China
4 College of Earth and Planetary Sciences, University of Chinese Academy of Sciences, Beijing 100049, China
5 Center for Excellence in Regional Atmospheric Environment, Institute of Urban Environment,

Chinese Academy of Sciences, Xiamen 361021, China
6 State Key Laboratory of Severe Weather, Key Laboratory for Atmospheric Chemistry, Institute of Atmospheric Composition,

Chinese Academy of Meteorological Sciences, Beijing 100081, China
7 Multiphase Chemistry Department, Max Planck Institute for Chemistry, 55128 Mainz, Germany

Correspondence: Jiangchuan Tao (taojch@jnu.edu.cn) and Nan Ma (nan.ma@jnu.edu.cn)

Received: 8 September 2020 – Discussion started: 12 October 2020
Revised: 19 April 2021 – Accepted: 20 April 2021 – Published: 17 May 2021

Abstract. Secondary aerosols (SAs, including secondary or-        (high RH conditions), SA formation significantly contributed
ganic and inorganic aerosols, SOAs and SIAs) are predom-          to the particle mass and size changes in a broad size range of
inant components of aerosol particles in the North China          150 to 1000 nm, leading to NCCN (0.05 %) increases within
Plain (NCP), and their formation has significant impacts on       the size range of 200 to 500 nm and mass concentration
the evolution of particle size distribution (PNSD) and hy-        growth mainly for particles larger than 300 nm. During peri-
groscopicity. Previous studies have shown that distinct SA        ods with daytime minimum RH below 30 % (low RH condi-
formation mechanisms can dominate under different relative        tions), SA formation mainly contributed to the particle mass
humidity (RH). This would lead to different influences of         and size and NCCN changes for particles smaller than 300 nm.
SA formation on the aerosol hygroscopicity and PNSD under         As a result, under the same amount of mass increase induced
different RH conditions. Based on the measurements of size-       by SA formation, the increase of NCCN (0.05 %) was stronger
resolved particle activation ratio (SPAR), hygroscopicity dis-    under low RH conditions and weaker under high RH condi-
tribution (GF-PDF), PM2.5 chemical composition, PNSD,             tions. Moreover, the diurnal variations of the SPAR param-
meteorology and gaseous pollutants in a recent field cam-         eter (inferred from CCN measurements) due to SA forma-
paign, McFAN (Multiphase chemistry experiment in Fogs             tion varied with RH conditions, which was one of the largest
and Aerosols in the North China Plain), conducted during the      uncertainties within NCCN predictions. After considering the
autumn–winter transition period in 2018 at a polluted rural       SPAR parameter (estimated through the number fraction of
site in the NCP, the influences of SA formation on cloud con-     hygroscopic particles or mass fraction of SA), the relative de-
densation nuclei (CCN) activity and CCN number concentra-         viation of NCCN (0.05 %) predictions was reduced to within
tion (NCCN ) calculation under different RH conditions were       30 %. This study highlights the impact of SA formation on
studied. Results suggest that during daytime, SA formation        CCN activity and NCCN calculation and provides guidance
could lead to a significant increase in NCCN and a strong diur-   for future improvements of CCN predictions in chemical-
nal variation in SPAR at supersaturations lower than 0.07 %.      transport models and climate models.
During periods with daytime minimum RH exceeding 50 %

Published by Copernicus Publications on behalf of the European Geosciences Union.
7410                               J. Tao et al.: Secondary aerosol formation alters CCN activity in the North China Plain

1   Introduction                                                       SA formation affects the CCN activity of accumulation-
                                                                    mode particles, not only by enlarging their size, but also
The cloud condensation nuclei (CCN) activity of aerosol par-        by changing their chemical compositions. At a specific
ticles describes the ability to activate and grow into cloud        particle size, the CCN activity is determined both by the
droplets at given supersaturations and thus has important im-       chemical composition of particles which originally were
pacts on cloud microphysics and the aerosol indirect effect         and stayed this size and that of particles which grew into
on climate. CCN activity is dependent on the physicochemi-          this size via added SA mass. These two groups of parti-
cal properties of aerosol particles, including particle size dis-   cles can exert different variations to CCN activity at the
tributions, hygroscopicity (determined by chemical compo-           same particle size (Wiedensohler et al., 2009, and references
sition) and mixing state. Thus, atmospheric processes influ-        therein). In general, the SA formation can increase the hygro-
encing these aerosol properties may exert influences on CCN         scopicity of particles by adding chemical compounds with
activity.                                                           lower volatility and higher oxidation state, which are usu-
   Secondary aerosol (SA) formation contributes greatly to          ally more hydrophilic, thereby enhancing the CCN activity
aerosol populations and impacts CCN properties in many              of accumulation-mode particles (Mei et al., 2013; Yue et al.,
ways, generally increasing CCN number concentrations                2016). However, CCN activity may also remain unchanged
(NCCN ) and leading to changes in the CCN activity (Wieden-         (Wiedensohler et al., 2009) or be weakened in some cases
sohler et al., 2009; Kerminen et al., 2012; Wu et al., 2015;        (Thalman et al., 2017; Duan et al., 2018). In SA formation
Farmer et al., 2015; Ma et al., 2016; Zhang et al., 2019,           observed in central Amazon forests, Thalman et al. (2017)
and references therein). Differences in precursor and oxidant       reported enhanced CCN activity in the dry season and con-
concentrations as well as SA formation mechanisms lead to           stant CCN activity in the wet season. In SA formation events
particle size growth in different size ranges (Dal Maso et al.,     under polluted conditions in Guangzhou (Pearl River Delta,
2005; Kulmala et al., 2007; Zhang et al., 2012; Farmer et al.,      China), Duan et al. (2018) found that bulk CCN activity
2015; Cheng et al., 2016; Kuang et al., 2020c), thus impact-        can be enhanced in summer due to the formation of large
ing CCN activities in different ways. SA formation includes         and inorganic-rich particles but weakened in winter due to
both the formation and subsequent growth of new particles           the formation of small and organic-rich particles, where RH
(new particle formation, NPF) and the growth of existing            seemed to have been an important factor in the variations of
particles. NPF can directly provide particles large enough          bulk CCN activity due to different particle formation path-
to act as CCN (Wiedensohler et al., 2009; Kerminen et al.,          ways. Aside from variations of particle chemical composi-
2012; Farmer et al., 2015), generally affecting aerosol parti-      tion, changes in aerosol mixing states caused by SA forma-
cles smaller than 100 nm, thereby elevating NCCN at higher          tion can also change CCN activity (Su et al., 2010; Rose
supersaturations (SSs > 0.2 %) (Wiedensohler et al., 2009;          et al., 2011; Cheng et al., 2012). The fast condensation of
Kerminen et al., 2012; Ma et al., 2016; Zhang et al., 2019,         SA components on accumulation-mode particles led to the
and references therein). SA formation on existing particles,        turnover of soot particle mixing state from externally to in-
especially under polluted conditions, significantly adds mass       ternally mixed, which contributed mostly to enhancements
to and changes the chemical composition of accumulation-            of CCN activity (Cheng et al., 2012). Thus, SA formation
mode particles (Farmer et al., 2015), thus affecting CCN at         influences the CCN activity of accumulation-mode particles
lower SSs (< 0.2 %) (Wiedensohler et al., 2009; Mei et al.,         through its integrated impacts on their size, hygroscopicity
2013; Yue et al., 2016; Thalman et al., 2017; Duan et al.,          and mixing state, which requires more detailed and compre-
2018). SSs vary greatly among different clouds categories.          hensive investigations.
Cumulus clouds are formed under higher SSs and are thus                The North China Plain (NCP) frequently experiences se-
mostly influenced by Aitken-mode particles formed in NPF            vere aerosol pollution due to both strong emissions of pri-
events (Reuter et al., 2009; Gryspeerdt and Stier, 2012; Fan        mary aerosol and strong SA formation caused by the abun-
et al., 2016; Jia et al., 2019, and references therein). Stratus    dance of gaseous precursors and oxidants (Zheng et al., 2015;
clouds and fogs that exert stronger effects on climate and en-      Liu et al., 2010; Huang et al., 2014; Xu et al., 2019). In
vironment, however, are generally formed at SSs lower than          the SA formation events on the NCP, both aqueous-phase
0.2 %, indicating that only accumulation-mode particles can         processes and gas-phase photochemical processes can play
serve as CCN (Ditas et al., 2012; Hammer et al., 2014a, b;          important roles, depending on atmospheric conditions such
Krüger et al., 2014; Shen et al., 2018). Numerous studies           as RH (Hu et al., 2016; Xu et al., 2017a; Wang et al.,
have investigated the impact of NPF on CCN (Gorden et al.,          2019). A recent observational study on the NCP found that
2016; Ma et al., 2016; Yu et al., 2020, and references therein);    SA formation dominantly contributed to different particle
however, only few studies have focused on the influence of          size since SA formation mechanisms varied with RH con-
SA formation on CCN activity of accumulation-mode par-              ditions (Kuang et al., 2020c). Under dry conditions, SAs
ticles, which might exhibit strong climate and environment          were mainly formed through gas-phase photochemical pro-
impacts and urgently requires attention.                            cessing and mostly added mass to accumulation-mode parti-
                                                                    cles. While under high RH conditions or supersaturated con-

Atmos. Chem. Phys., 21, 7409–7427, 2021                                              https://doi.org/10.5194/acp-21-7409-2021
J. Tao et al.: Secondary aerosol formation alters CCN activity in the North China Plain                                  7411

ditions, SA was also formed in the aqueous phase, contribut-      Roberts and Nenes, 2005). The system was operated in a
ing to the formation of both accumulation-mode and coarse-        size-scanning mode over the particle size range from 9 to
mode particles. The difference in particle size where SA for-     400 nm. SPAR can be obtained by combining the measure-
mation took place and the difference in SA chemical com-          ments of CPC and CCNC at different particle size. The sam-
positions could result in distinct variations of CCN activity,    ple and sheath flow rate of the DMA were set to 1 and
which has not been evaluated yet. In this study, we will study    5 L min−1 , respectively; hence the resultant measured parti-
the influence of SA formation on the size-resolved particle       cle diameter ranged from 9 to 500 nm. Since the low number
activation ratio (SPAR) of accumulation-mode particles in         concentration of particles above 300 nm could lead to large
the NCP under different RH conditions, which fills a gap of       uncertainty in CCNC counting, the measurements for parti-
knowledge within CCN studies in the NCP and may provide           cles larger than 300 nm were excluded, except for 0.05 % SS.
guidance for the improvement of current CCN parameteriza-         In order to characterize the variations of particles with low
tion schemes in chemical-transport and climate models.            hygroscopicity of about 0.1, SPAR measurement up to about
                                                                  400 nm is used at 0.05 % SS. There are 12 size distribution
                                                                  scans during a complete 1 h cycle, with four scans for the
2     Method                                                      first SS and two scans for each of the remaining four SSs.
                                                                  Only the last scan for each SS is used as the CCNC needs
2.1     Measurements                                              time for SS stabilization. The SSs of CCNC were calibrated
                                                                  with monodispersed ammonium sulfate particles (Rose et al.,
2.1.1    Site
                                                                  2008) both before and after the campaign. The flow rates
Under the framework of McFAN (Multiphase chemistry ex-            were checked regularly (every few days) during the cam-
periment in Fogs and Aerosols in the North China Plain)           paign, as the flows (sample flow and sheath flow) of the in-
(Li et al., 2021), from 16 November to 16 December 2018,          strument can affect both the counting of droplets and the SS
physical and chemical properties of ambient aerosol parti-        in the column. A modified algorithm based on Hagen and
cles as well as meteorological parameters were continuously       Alofs (1983) and Deng et al. (2011, 2013) was used to correct
measured at the Gucheng site in Dingxing County, Hebei            the influence of multiple-charge particles and DMA transfer
Province, China. This site is an Ecological and Agricul-          function on SPAR. Details about the system are described
tural Meteorology Station (39◦ 090 N, 115◦ 440 E) of the Chi-     in Ma et al. (2016), and the description about the inversion
nese Academy of Meteorological Sciences, which is located         method can be found in the Supplement.
between Beijing (∼ 100 km) and Baoding (∼ 40 km), two                Non-refractory particulate matter (NR-PM) including
megacities in the North China Plain, and surrounded by farm-      SO2−         −      +
                                                                      4 , NO3 , NH4 , Cl
                                                                                            − and organics with dry aerody-

lands and small towns. Measurements at this site can rep-         namic diameters below 2.5 µm was measured by an Aero-
resent the polluted background conditions of the NCP well.        dyne Time-of-Flight Aerosol Chemical Speciation Monitor
All aerosol measurement instruments were placed in a con-         (ToF-ACSM hereafter) equipped with a PM2.5 aerodynamic
tainer with temperature maintained at 24 ◦ C, while conven-       lens (Williams et al., 2010) and a capture vaporizer (Xu et
tional trace gas instruments including CO were housed in an       al., 2017b; Hu et al., 2017a) at 2 min time resolution. The
air-conditioned room on a two-story building located ∼ 80 m       ToF-ACSM data were analyzed with standard data analy-
to the south of the container, with no taller buildings between   sis software (Tofware v2.5.13; https://sites.google.com/site/
them blocking the air flow.                                       ariacsm/, last access: 21 January 2020). The organic mass
                                                                  spectra from m/z 12 to 214 were analyzed with an Igor Pro-
2.1.2    Instrumentation                                          based positive matrix factorization (PMF) evaluation tool
                                                                  (v3.04) and then evaluated following the procedures de-
In this study, ambient aerosol was sampled by an inlet sys-       scribed in Zhang et al. (2011). The chosen five-factor solu-
tem consisting of a PM10 inlet (Rupprecht & Patashnick Co.,       tion includes four primary factors, i.e., hydrocarbon-like OA
Inc., Thermo, 16.67 L min−1 ), a Nafion dryer that dried rel-     (HOA), cooking OA (COA), biomass burning OA (BBOA)
ative humidity to below 30 % and an isokinetic flow splitter      and coal combustion OA (CCOA), and a secondary factor,
directing the air sample to each instrument.                      i.e., oxygenated OA (OOA). More detailed descriptions on
   A DMA-CCNC (differential mobility analyzer–cloud con-          the ACSM measurements and data analysis can be found in
densation nuclei counter) system measured SPAR at five            Kuang et al. (2020b) and Sun et al. (2020).
supersaturations (SSs), 0.05 %, 0.07 %, 0.2 %, 0.44 % and            A hygroscopocity-tandem differential mobility analyzer
0.81 %, with a running time of 20 min for 0.05 % and 10 min       (HTDMA; Tan et al., 2013) measured the size-resolved
for the other SSs. This system consisted of a differen-           aerosol growth factor (GF) at 90 % RH. The sampled par-
tial mobility analyzer (DMA model 3081; TSI, Inc, MN              ticles were subsequently charged by a neutralizer (Kr85, TSI
USA), a condensation particle counter (CPC model 3772;            Inc.) and size-selected by a DMA (DMA1, model 3081L, TSI
TSI, Inc., MN USA) and a continuous-flow CCN counter              Inc.). A Nafion humidifier (model PD-70T-24ss, Perma Pure
(model CCN200, Droplet Measurement Technologies, USA;             Inc., USA) was used to humidify the monodisperse particles

https://doi.org/10.5194/acp-21-7409-2021                                          Atmos. Chem. Phys., 21, 7409–7427, 2021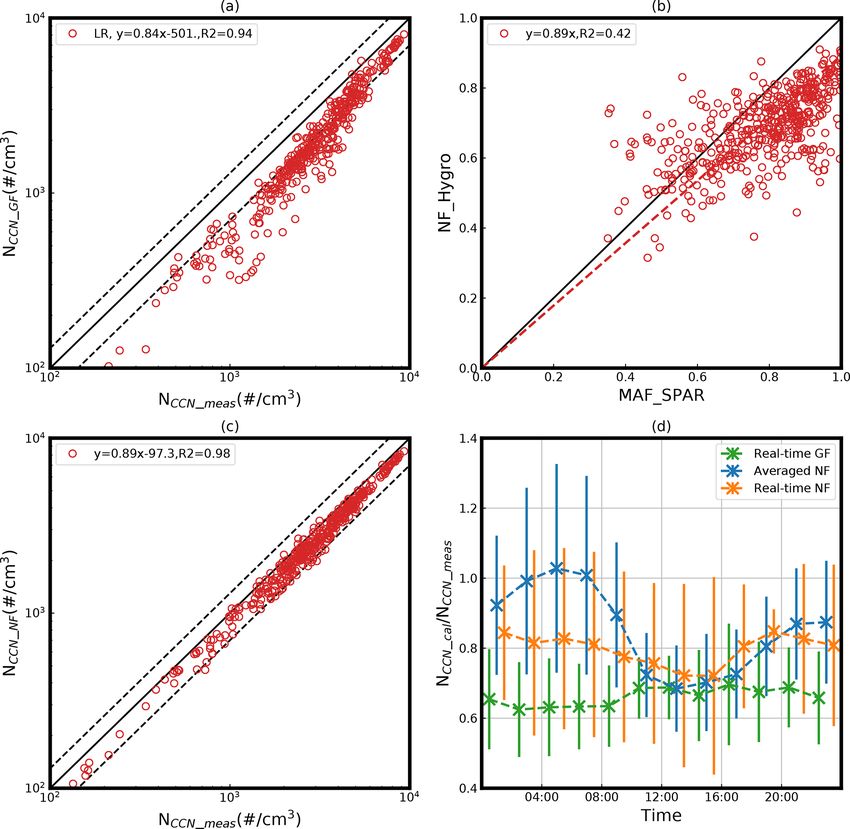
7412                              J. Tao et al.: Secondary aerosol formation alters CCN activity in the North China Plain

with a specific diameter (Dd ) at a fixed RH of (90 ± 0.44) %,    saturation ratio (which is generally supersaturated) is defined
and then the number size distribution of the humidified par-      as the critical SS for CCN activation. As a result, the varia-
ticles (Dwet ) was measured by another DMA (DMA2, model           tion of the critical diameter (Da ) for particles with different
3081L, TSI Inc.) and a condensation particle counter (CPC,        hygroscopicity (or GF at a specific RH) at different SSs can
model 3772, TSI Inc.). Thus, the GF of the particles can be       be determined.
calculated as
        Dwet                                                      2.2.2   Aerosol growth factor and its probability density
GF =         .                                                            function
        Dd
During the campaign, four dry mobility diameters (60, 100,        In practice, the growth factor probability density function
150 and 200 nm) were selected for the HTDMA measure-              (GF-PDF) was inversed from the measured GF distribu-
ments. A full scan takes about 1 h in order to cover the four     tion using a TDMAinv algorithm (Gysel et al., 2009). Af-
sizes. Regular calibration using standard polystyrene latex       ter obtaining the GF-PDF, the ensemble average GF and
spheres and ammonium sulfate was performed to ensure the          corresponding critical diameter under a certain SS (Da,GF )
instrument functioned normally. The tandem differential mo-       can be calculated. Furthermore, the number fraction and the
bility analyzer (TDMA) inversion algorithm (Gysel et al.,         weighted-average GF of hygroscopic particles (κ > 0.1 and
2009) was applied to calculate the probability density func-      GF(90 %, 200 nm) > 1.22) were calculated as
tion of GF (GF-PDF). More details about this system can be
found in Cai et al. (2018) and Hong et al. (2018).                         Z∞
   Particle number size distributions (PNSDs) were measured       NFhygro = PDF(GF) × dGF                                     (2)
by combining the measurements of a scanning mobility par-                     1.2
ticle sizer (SMPS; TSI model 3080) and an aerodynamic par-                     Z∞
ticle sizer (APS; TSI Inc., Model 3321), that measured parti-     GFhygro =         GF × PDF(GF) × dGF.                       (3)
cle mobility diameter size distributions in the range of 12 to
                                                                              1.2
760 nm and particle aerodynamic diameter size distribution
in the range of 700 nm to 10 µm, respectively. A commercial       Based on the κ-Köhler theory, the hygroscopicity parame-
instrument from Thermo Electronics (Model 48C) was used           ter κ and corresponding critical diameter (Da,hygro ) under a
to measure CO concentration. Besides monthly multipoint           certain SS for particles with GFhygro can be calculated. As
calibrations and weekly zero-span check, additional 6-hourly      GFhygro is higher than the average GF, Da ,hygro is smaller
zero checks were also performed for the CO instrument.            than Da,GF .
2.2     Data processing
                                                                  2.2.3   Calculations of aerosol hygroscopicity from
2.2.1    Aerosol hygroscopicity and cloud activation:                     aerosol chemical composition measurements
         κ-Köhler theory
                                                                  For the calculation of aerosol hygroscopicity parameter κ
The ability of particles to act as CCN and their depen-           based on measured chemical composition data (κchem ), de-
dence on particle size and particle chemical composition on       tailed information on the chemical species is needed. The
CCN activity can be described by the Köhler theory (Köhler,       ACSM can only provide bulk mass concentrations of SO2−     4 ,
1936). A hygroscopic parameter κ is calculated based on the       NO−  3 , NH +
                                                                              4  and Cl − ions and organic components, which

κ-Köhler theory (Petters and Kreidenweis, 2007) to evaluate       cannot be used to calculate size-resolved hygroscopicity.
the influence of particle chemical compositions:                  However, in the North China Plain, accumulation-mode par-
                   !                                              ticles are the dominant contributors to the bulk particle mass
         3 − D3
       Dwet

                                                                  concentration (Liu et al., 2014; Xu et al., 2015; Hu et al.,
                 d     1        4σs/a Mw
κ=                       exp                − 1   ,     (1)       2017b), and thus the bulk chemical compositions can be used
           Dd3         S       RT ρw Dwet
                                                                  as a proxy for those of accumulation-mode particles. For
where S represents the saturation ratio, ρw is the density of     the inorganic ions, a simplified ion pairing scheme was used
water, Mw is the molecular weight of water, σs/a is the sur-      to convert ion mass concentrations to mass concentrations
face tension of the solution–air interface, R is the universal    of corresponding inorganic salts (Gysel et al., 2007; Wu et
gas constant, T is the temperature, Dd is the diameter of dry     al., 2016). Thus, mass concentrations of SO2−         −
                                                                                                                4 , NO3 , NH4
                                                                                                                              +

particle and Dwet is the diameter of the humidified particle.              −
                                                                  and Cl are specified into ammonium sulfate (AS), ammo-
In this study, σs/a is assumed to be the surface tension of the   nium nitrate (AN), ammonium chloride (AC) and ammonium
pure water–air interface. Based on the κ-Köhler theory, the       bisulfate (ABS), for which the κ values under supersaturated
surface equilibrium water vapor saturation ratio of particles     conditions were specified according to Petters and Kreiden-
with a specific κ at different wet particle size can be cal-      weis (2007). For a given internal mixture of different aerosol
culated, and the maximum value of the surface equilibrium         chemical species, the Zdanovskii–Stokes–Robinson (ZSR)

Atmos. Chem. Phys., 21, 7409–7427, 2021                                               https://doi.org/10.5194/acp-21-7409-2021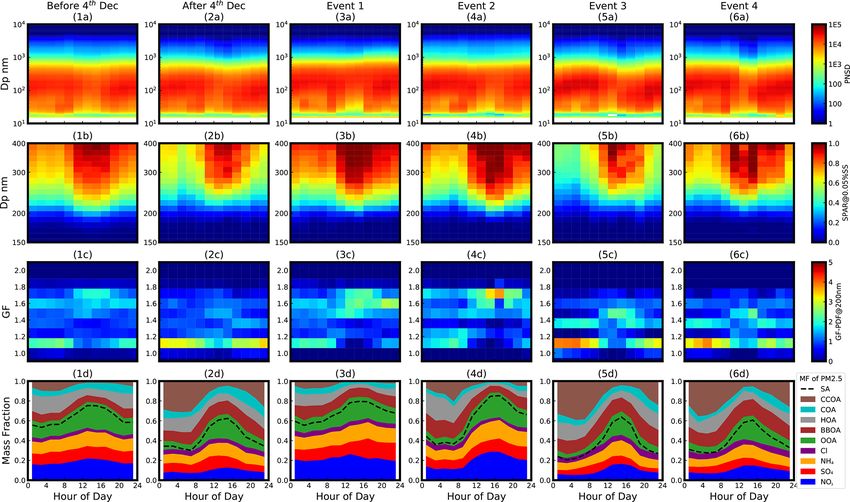
J. Tao et al.: Secondary aerosol formation alters CCN activity in the North China Plain                                     7413

mixing rule can be applied to predict the overall κchem us-       where erf is the error function, MAF is the asymptote of
ing volume fractions of each chemical species (εi ) (Petters      the measured SPAR curve at large particle sizes, Da is the
and Kreidenweis, 2007):                                           midpoint activation diameter and is associated with the hy-
        X                                                         groscopicity of CCN and σ is the standard deviation of the
κchem =    κi · εi ,                                     (4)      cumulative Gaussian distribution function and indicates the
            i                                                     heterogeneity of CCN hygroscopicity. As reported by Jiang
                                                                  et al. (2021), based on the investigation of the covariations
where κi and εi represent the hygroscopicity parameter κ
                                                                  between SPAR curves and parameterized hygroscopicity dis-
and volume fraction of chemical component i in the mixture.
                                                                  tribution, it was found that the MAF can be used to estimate
Based on Eq. (2), κchem can be calculated as follows:
                                                                  the number fraction of hygroscopic (thus CCN-active) par-
                                                                  ticles, for aerosol hygroscopicity distributions generally ob-
κchem = κAS εAS + κAN εAN + κABS εABS + κAC εAC
                                                                  served in the ambient atmosphere, and thus half MAF can be
        + κBC εBC + κOrg εOrg ,                            (5)    used to represent the number fraction of CCN to total parti-
                                                                  cles at particle size around Da . Although the influence of par-
where κBC is assumed to be zero as black carbon is non-           ticles whose κ is less than 0.1 on SPAR cannot be considered
hygroscopic. κorg and εorg represent κ and volume fraction        in this parameterization scheme, significant deviations were
of total organics. The values of hygroscopicity parameter for     only found under higher SSs (Tao et al., 2020) and need not
inorganic compounds can be found in Table 1 of Petters and        be considered under the low SSs discussed in this study.
Kreidenweis (2007). Large variations in κorg have been re-           It should be noted that the meaning of MAF can be dif-
ported in former studies, and a linear relationship between       ferent with regards to the SS, and SPAR measurement up
κorg and organic aerosol oxidation state (f44 ) was detected in   to about 400 nm is needed for the MAF fitting for SPAR at
our campaign (Kuang et al., 2020b), which was adopted to          SS of 0.05 % to represent the particles with κ values higher
calculate κorg in this study:                                     than 0.1. For SPAR at SS of 0.8 %, MAF should be 1 at
                                                                  400 nm diameter. However, a MAF of 1 in this case can lead
κOrg = 1.04 × f44 − 0.02.                                  (6)    to overestimations of hygroscopic particle number fraction
                                                                  due to the significant difference between SPAR curves and
It should be noted that the κ-Köhler theory is not perfect,
                                                                  sigmoidal fitting curves. In the former study on SPAR fitting
even for inorganic compounds. Numerous studies have been
                                                                  curves in the NCP, it was found that a fitting parameteriza-
focusing on the performance of its application on measure-
                                                                  tion with the combination of two sigmoidal fitting curves was
ments under different RH conditions (Liu et al., 2011; Wang
                                                                  needed for SPAR fitting at SSs higher than 0.4 % (Tao et al.,
et al., 2017). And κorg used in this study was determined
                                                                  2020). However, in this study, we investigate SA formation
by the measurement of a humidified nephelometer at RH of
                                                                  on accumulation-mode particles and particle CCN activity
85 % in Kuang et al. (2020b), due to the lack of κorg mea-
                                                                  at SSs below 0.1 %, under which condition non-hygroscopic
sured under supersaturated conditions. In this study, we focus
                                                                  particles smaller than 400 nm are typically CCN-inactive.
on the variations of κ values derived from HTDMA and CCN
                                                                  The MAF fitted in the particle size range below 400 nm was
measurement during the SA formation events, rather than the
                                                                  used to indicate the variations of SPAR that was of the main
closure between κ values derived using different techniques,
                                                                  focus here in this work. In addition, due to the very low NCCN
which will be addressed in an upcoming study.
                                                                  in particle size ranges larger than 400 nm, the deviations of
2.2.4    Fitting parameterization scheme of SPAR                  NCCN due to the limited range of measured particle size are
                                                                  also very small.
In general, the variation in CCN activity of a particle popu-
lation can be attributed to the variation in the number frac-
tion of hygroscopic particles or its hygroscopicity, which can    3     Results
be indicated by fitting parameters of SPAR curve parame-
terization. SPAR curves are often parameterized using a sig-      3.1    Overview of the measurements
moidal function with three parameters. This parameterization
assumes aerosols to be an external mixture of apparently hy-      The time series of meteorological parameters, SPAR, NCCN
groscopic particles that can act as CCN and non-hygroscopic       at SS of 0.05 % and mass concentration of non-refractory
particles that cannot be measured by CCNC within the mea-         particulate matter of PM2.5 (NR-PM2.5 ), PM2.5 SA (inor-
sured particle size range below 400 nm (Rose et al., 2010).       ganic compounds and OOA) and PM2.5 PA (primary aerosol,
SPAR (Ra(Dp )) at a specific SS can be described as follows       defined as the sum of POA) are shown in Fig. 1. The mass
(Rose et al., 2008):                                              concentration of OOA and four POAs were quantified by the
                                                                  ACSM PMF analysis (Zhang et al., 2011). During the cam-
                                                                  paign, PM2.5 PA was generally lower than 100 µg m−3 under

             MAF              Dp − Da
Ra(Dp ) =            1 + erf √             ,               (7)    both high and low RH periods. Meanwhile, PM2.5 SA can
               2                 2π σ

https://doi.org/10.5194/acp-21-7409-2021                                           Atmos. Chem. Phys., 21, 7409–7427, 2021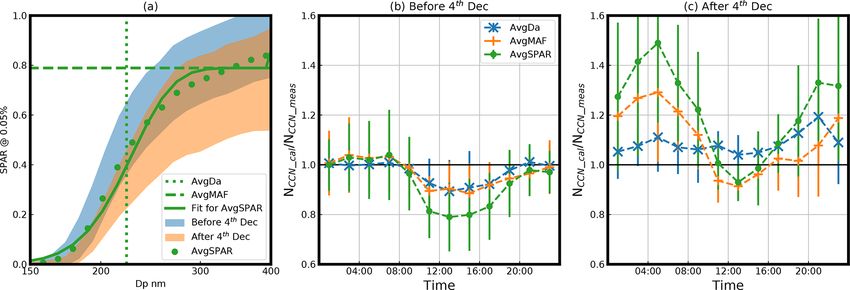
7414                             J. Tao et al.: Secondary aerosol formation alters CCN activity in the North China Plain

approach about 400 µg m−3 , especially during the strong SA     NCCN (0.05 %) to the different SA formation mechanisms
formation events under high RH conditions, but can be lower     will be discussed comprehensively in the following parts.
than 100 µg m−3 under low RH conditions. Strong diurnal
variations were found in SPAR with varying meteorological       3.2   The influence of different secondary aerosol
parameters. During the whole period, the wind speed was               formation on the diurnal variation of CCN activity
generally lower than 4 m s−1 , which is in favor of aerosol
particle accumulation and SA formation on existing parti-       The diurnal averages of PNSD, SPAR at SS of 0.05 %, GF-
cles. However, RH, NCCN (0.05 %), PM2.5 SA and NR-PM2.5         PDF for 200 nm particle and mass fraction of particle chem-
mass concentrations revealed very distinct levels before and    ical compositions during high RH periods before 4 Decem-
after 4 December, and thus the whole campaign was divided       ber, low RH periods after 4 December and the four events
into two stages with different RH and SA pollution condi-       are shown in Fig. 2, respectively. It should be noted that the
tions: higher RH and stronger SA pollution before 4 Decem-      “high (or low) RH events” is used to refer to the SA for-
ber and lower RH and lighter SA pollution after 4 Decem-        mation events under high (or low) RH conditions for conve-
ber. In the following discussions, the high RH stage corre-     nience, and it does not mean that RH caused variations of
sponds to days before 4 December with daily maximum and         CCN behavior. As can be seen in Fig. 2(1b) and (2b), dif-
minimum RH higher than 75 % and 50 %, respectively. Two         ferent variations of SPAR due to SA formation can be found
events that occurred during 25 to 27 November (Event 1)         during the periods with different RH conditions. The aver-
and 30 November to 2 December (Event 2), respectively, dis-     age diurnal variations of these parameters for the entire high
played especially high RH conditions with successive night-     RH stage and low RH stage as shown in Fig. 2(1a)–(1d) and
time fogs (blue shaded areas). The low RH stage corresponds     (2a)–(2d) revealed similar but more smoothed variations as
to the period after 4 December with daily maximum and min-      in the four selected events. The four events are discussed
imum RH below 70 % and 30 %, which was represented by           and intercompared in the following to magnify the differ-
two events that occurred during 9 to 11 December (Event 3)      ences under distinct RH conditions. For accumulation-mode
and 13 to 15 December (Event 4), respectively. These events     particles, particle number concentrations were higher during
were selected based on the similarity of PM2.5 concentra-       daytime in high RH events, while stronger diurnal variations
tion and evolution, while the time window was fixed to 2 d      occurred in low RH events. Simultaneous daytime increases
for the convenience of intercomparison. In addition, during     in particle SPAR in the size range from 200 to 400 nm, GF-
these events, the wind speed was generally low, the RH fol-     PDF in the GF range from 1.2 to 1.8 and SA mass fraction
lowed a general diurnal variations and SA mass grew steadily    were found in all four events, suggesting that SA formation
and continuously. Thus the interference of the variations of    led to increasing hygroscopic particle number concentration,
air mass and short-term local emissions can be eliminated,      which in turn enhanced particle CCN activity. This effect was
and the influence of SA formation can be highlighted. It        more pronounced in Events 1 and 2 than in Events 3 and 4. In
should be noted that variations of NCCN at 0.07 % were simi-    Events 1 and 2, SPAR values were generally higher than 0.4
lar to those at 0.05 %, which followed the variations of SA     at 200 nm and reached the maximum of 1 during noontime
mass concentration, while at higher SSs, the variations of      at 300 nm. A hygroscopic mode with GF > 1.4 was found
NCCN differed from those of SA mass concentration, es-          throughout the day, which dominated aerosol hygroscopicity
pecially under high RH conditions, suggesting different re-     during daytime. Mass fractions of SA were generally higher
sponses of CCN activity towards distinct SA formation pro-      than 70 % and reach a maximum of 80 % at noon, while in
cesses. As reported in Kuang et al. (2020c), during the high    Events 3 and 4, SPAR at 200 nm was lower than 0.4 at night,
RH stage, aqueous-phase SA formation was promoted, lead-        and the maximum SPAR at 300 nm was lower than 0.9. A
ing to persistent increases in NCCN (0.05 % and 0.07 %), mass   particle mode with GF < 1.1 dominates particle hygroscop-
concentration of NR-PM2.5 and especially mass concentra-        icity, and the mass fraction of SA was lower than 60 % and
tion of PM2.5 SA during Events 1 and 2. During the low          30 % at noon and at night, respectively. However, a stronger
RH stage, the SA formation dominantly occurred in the gas-      daytime increase of SA mass fraction and accordingly larger
phase, that generated much less SA than aqueous-phase for-      variation in SPAR was observed in Events 3 and 4 than in
mation (Kuang et al., 2020c). Thus, the persistent increases    Events 1 and 2.
of NCCN (0.05 % and 0.07 %) and PM2.5 during Events 3 and          Besides SS of 0.05 %, variations of SPAR at SSs of 0.07 %
4 were much weaker than those in Events 1 and 2. Due to         and 0.2 % are also shown in Figs. S1 and S2 in the Supple-
the different SA mass fractions, SPAR during the high RH        ment. And as shown in Figs. S1 and S2, the variations of
stage was generally higher than that during the low RH stage.   SPAR and NCCN / PM at SS of 0.07 % are similar but lighter,
However, the ratios between NCCN (0.05 %) and mass con-         compared with those at SS of 0.05 %, while for SS of 0.2 %,
centration of PM2.5 SA or NR-PM2.5 were lower during the        the difference of SPAR between different periods or events is
high RH period and demonstrated strong decreases, espe-         smaller (Fig. S1) and so were the diurnal variations of SPAR
cially in Event 1 and 2. The response of CCN activity and       and GF-PDF at a particle size of 100 nm (Fig. S2). Because
                                                                CCN activity at SS of 0.2 % was strong enough (indicated by

Atmos. Chem. Phys., 21, 7409–7427, 2021                                          https://doi.org/10.5194/acp-21-7409-2021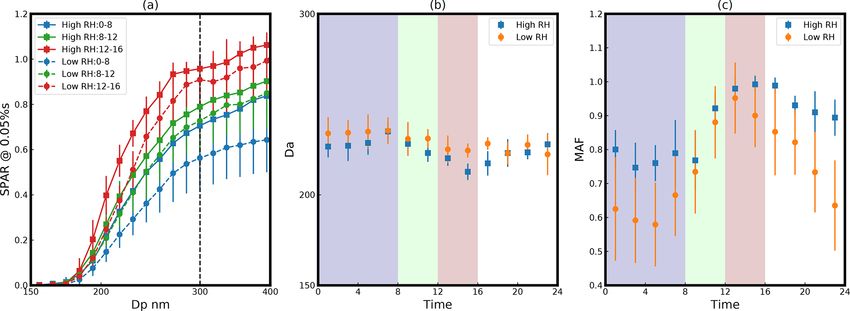
J. Tao et al.: Secondary aerosol formation alters CCN activity in the North China Plain                                          7415

Figure 1. Overview of the measurements during the campaign: (a) dots represent wind speed, with color indicating wind direction, and
black lines represent RH; (b) SPAR under SS of 0.05 %; (c) blue, green and yellow dots represent NCCN under SS of 0.05 % and 0.07 %
and mass concentration of NR-PM2.5 , respectively; (d) blue, green and yellow dots represent NCCN under SS of 0.2 %, 0.44 % and 0.81 %,
respectively; (e) blue and yellow dots represent the mass concentration of PM2.5 PA and PM2.5 SA respectively; (f) blue and yellow dots
represent the ratio between NCCN and mass concentration of NR-PM2.5 and PM2.5 SA, respectively. There were four events with significant
enhancements of NCCN during the blue shaded periods.

SPAR value close to 1) in the particle size range where the           parameters of the SPAR curve including Da and MAF were
SA formation dominates, the different SA formation under              also shown in Fig. 3b and c, respectively, as enhanced SPAR
high or low RH conditions cannot lead to significant vari-            for particle population can be attributed to hygroscopic par-
ations of CCN activity at SS of 0.2 %. In summary, based              ticle number fraction increase (MAF increase) or enhance-
on CCN measurements in this study, the RH-dependent in-               ment of hygroscopic particle hygroscopicity (Da decrease).
fluence of SA formation on CCN activity can be found ob-              The same as demonstrated in Fig. 2, SPAR was generally
viously at SSs of 0.05 % and 0.07 %. As the variations of             higher, and thus particle CCN activity (0.05 %) was gener-
SPAR at SS of 0.07 % were quite similar to those at SS of             ally stronger in high RH events than those in low RH events.
0.05 %, further analysis was only based on CCN activity at            However, as shown in Fig. 3a, the difference between SPAR
SS of 0.05 %.                                                         in high and low RH events at 300 nm decreased from 0.2 to
   In Fig. 3a, a detailed comparison of particle CCN activity         0.1 during the SA formation, indicating a stronger enhance-
during SA formation events of NCCN enhancements at SS of              ment in low RH events, probably due to both the stronger in-
0.05 % under different RH conditions shows the variations of          crease of SA mass fraction and the higher nighttime PA mass
SPAR curves. Particle CCN activity in Events 1 and 2 were             fraction (Fig. 2e). Furthermore, in high RH events, there were
combined due to their similar diurnal variations (as shown in         daytime enhancements of SPAR within the 150 to 300 nm
Fig. 2). Besides SPAR curves (Fig. 3a), corresponding fitting         size range, as was indicated by the daytime increase of MAF

https://doi.org/10.5194/acp-21-7409-2021                                               Atmos. Chem. Phys., 21, 7409–7427, 2021
7416                                J. Tao et al.: Secondary aerosol formation alters CCN activity in the North China Plain

Figure 2. Diurnal variation of (a) PNSD, (b) SPAR at SS of 0.05 %, (c) GF-PDF at 200 nm and (d) mass fraction of different PM2.5 chemical
species during high RH periods before 4 December (1), low RH periods after 4 December (2) and the four events (3–6), including OA factors:
hydrocarbon-like OA (HOA), cooking OA (COA), biomass burning OA (BBOA), coal combustion OA (CCOA) and oxygenated OA (OOA).

Figure 3. (a) The averages of SPAR curves at SS of 0.05 % in three different time periods (blue: 00:00–08:00 LT; green: 08:00–12:00 LT;
red: 12:00–16:00 LT) during high (squares with solid line, event 1 and 2) and low (dots with dashed line, event 3 and 4) RH events. Diurnal
variation of (b) Da and (c) MAF under high (blue) and low (yellow) RH conditions. The blue, green and red shades correspond to the three
periods in panel (a). Error bars indicate the standard deviations of data.

Atmos. Chem. Phys., 21, 7409–7427, 2021                                                    https://doi.org/10.5194/acp-21-7409-2021
J. Tao et al.: Secondary aerosol formation alters CCN activity in the North China Plain                                     7417

and decrease of Da , which mainly resulted from number frac-     formation under high RH and low RH conditions and its
tion and hygroscopicity increases of CCN-active particles,       distinct impact on NCCN . The Vconc size distribution varia-
while in low RH events, the daytime enhancement of SPAR          tions can be used as a proxy for the evolution of NR-PM2.5
was only observed for particles larger than 200 nm. This can     size distributions, considering the relatively small variations
be attributed to the strong increase of MAF and the slight de-   in particle density (ranging from 1.2 to 1.8 and with rel-
crease of Da , which indicates significant increasing number     ative variations within 20 %; Hu et al., 2012; Zhao et al.,
fraction, yet slightly enhanced hygroscopicity of hygroscopic    2019). The variations of the ratio between NCCN (in differ-
particles, respectively. Overall, the enhancement of SPAR        ent particle size range) and the mass concentration of PM2.5
was weaker but occurred at a broader particle size range in      SA (referred to as NCCN / SA) or NR-PM2.5 (referred to as
high RH events than in low RH events, as shown in Fig. 3a.       NCCN / NR) can be used to evaluate the response of NCCN to
This is in accordance with the previous results from Kuang       SA formation.
et al. (2020c), suggesting that SA formation occurred mainly        During high RH events, normalized NCCN (0.05 %) in-
in the aqueous phase within a broad particle size range (up      creased by ∼ 50 % from 08:00 to 14:00 LT, with a simi-
to 1 µm) in high RH events, while SA formation dominantly        lar increase in normalized PM2.5 SA mass concentration
proceeded via gas-phase reactions and contributed to aerosol     (Fig. 4(1a)). As the PM2.5 PA mass concentration decrease
sizes smaller than 300 nm in low RH events. At SS of 0.05 %      was much smaller than the SA increase, the NR-PM2.5 mass
(Fig. 3a), the variation of SPAR from 08:00–12:00 to 12:00–      concentration increase can be expected to be similar to the
16:00 local time (LT) in particle sizes smaller than 200 nm      SA increase. As reported by Kuang et al. (2020c), SAs dur-
was very small during low RH events, suggesting a smaller        ing daytime were mainly formed at larger particle sizes, fea-
CCN activity enhancement due to SA formation compared            turing Vconc increase in the particle size range of 400 to
with high RH events. In detail, the different variations of      1000 nm. In Fig. 4(1d), significant increases of particle num-
SPAR in high and low RH events indicated by MAF and              ber concentration (Nconc ) in particle size range of 150 to
Da (shown in Fig. 3b and c) suggested different variations of    1000 nm can be observed. At larger particle size, the in-
hygroscopicity, number fraction and size of SA particles. Be-    crease of Nconc led to a stronger increase of Vconc , which
fore SA formation, there was a significant difference between    is why there were simultaneous but much weaker increases
the MAF in high and low RH events, which disappeared af-         of Vconc in the particle size range of 150 to 300 nm com-
ter the SA formation. The stronger variations in MAF in low      pared with increases of those in the particle size of larger than
RH events suggested stronger enhancement of number con-          300 nm (Fig. 4(1b)). This suggests that PM2.5 SA mainly
centration of formed SA particles. As for Da during SA for-      contributed to particle sizes of larger than 300 nm. In ad-
mation, there were similar, little decreases in both high and    dition, because the SA formation enhanced hygroscopicity
low RH events, suggesting similar hygroscopicity of the SA       and number fraction of CCN-active particles in the par-
formed under low and high RH conditions. Thus differences        ticle size range of 150 to 300 nm, simultaneous enhance-
of SPAR and the resultant NCCN during low and high RH            ments of SPAR can be found throughout the measured par-
events were mainly due to the different variations of number     ticle size range of 180 to 300 nm (Fig. 4(1e)). By com-
fraction of formed SA particles.                                 bining the enhancements of Nconc and SPAR in measured
   As there were different influences of SA formation on         particle size ranges, there were increases of NCCN from
both CCN activity at SS of 0.05 % and PNSD under dif-            200 to 500 nm (Fig. 4(1c)). Thus while SA formation pro-
ferent RH conditions, different variation of NCCN (0.05 %)       cesses contributed to their volume (mass) and hygroscop-
due to SA formation can also be expected. Figure 4 dis-          icity increase, it had no further impact on NCCN . As a re-
plays the diurnal variation of PM2.5 mass concentration, vol-    sult, NCCN (> 300 nm) / SA, NCCN (< 300 nm) / SA, NCCN
ume concentration (Vconc ), number concentration (Nconc ) and    (> 300 nm) / NR and NCCN (< 300 nm) / NR all decreased
NCCN (0.05 %) (all divided by CO to partially compensate         during the SA formation (Fig. 4(1f)), suggesting that weak-
for changes in planetary boundary layer height), as well as      ening enhancement of NCCN (0.05 %) in SA formation under
the NCCN / PM2.5 mass concentration ratio and SPAR dur-          high RH condition as SA formation mainly added mass to
ing high and low RH events, respectively. Variables in Fig. 4    already CCN-active particles .
are also presented in Fig. S3 averaged for the entire high          During low RH events, weaker increases of both NCCN
RH and low RH stages, respectively. Compared with the se-        (0.05 %) and PM2.5 SA mass concentration from 08:00 to
lected case events featuring significant NCCN enhancement        14:00 LT were found (Fig. 4(2a)). At the same time, PA
(Fig. 4(1c)–(2c)), the diurnal variations averaged for the en-   mass decreased by 50 %, and the variation of total NR mass
tire high and low RH stages were similar, with higher lev-       was small. Under low RH conditions, SA formation mainly
els of particle mass concentration but weaker enhancement        contributed to mass enhancements of smaller particle sizes
of SA and NCCN , indicating a similar but weakened impact        (Kuang et al., 2020c). Vconc increased mostly in the range
of SA formation on CCN activity due to the interference of       of 150 to 300 nm (Fig. 4(2b)), while Nconc only increased
other aerosol processes. Hereinafter, we discuss the varia-      within 300 nm (Fig. 4(2d)), suggesting that PM2.5 SA mainly
tions in the four events to magnify the discrepancies of SA      formed in the particle size range below 300 nm. SA forma-

https://doi.org/10.5194/acp-21-7409-2021                                          Atmos. Chem. Phys., 21, 7409–7427, 2021
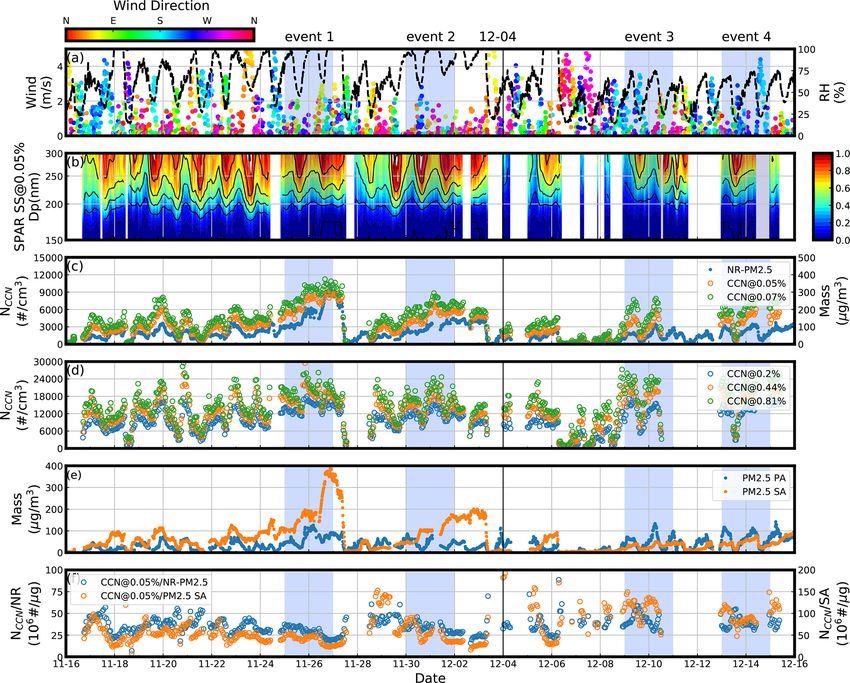
7418                                  J. Tao et al.: Secondary aerosol formation alters CCN activity in the North China Plain

Figure 4. During different RH events, the average diurnal variation of (a) the ratios between particle mass concentration (dots with solid
lines; blue: NR-PM2.5 ; yellow: PM2.5 SA; green: PM2.5 PA) and CO concentration and the ratio between NCCN at SS of 0.05 % and CO
concentration (squares with solid line); (b) the ratios between particle volume concentration (Vconc ) of different particle size range (indicated
by colors) and CO concentration; (c) the ratios between NCCN of different particle size range at SS of 0.05 % (indicated by colors) and
CO concentration; (d) the ratios between particle number concentration (Nconc ) of different particle size range (indicated by colors) and
CO concentration; (e) SPAR of different particle size range (indicated by colors); (f) the ratios between NCCN at SS of 0.05 % (black: bulk
NCCN ; yellow: NCCN with particle size larger than 300 nm; blue: NCCN with particle size smaller than 300 nm) and mass concentration of
NR-PM2.5 SA and the ratios between NCCN and mass concentration of NR-PM2.5 (dashed lines).

Atmos. Chem. Phys., 21, 7409–7427, 2021                                                        https://doi.org/10.5194/acp-21-7409-2021
J. Tao et al.: Secondary aerosol formation alters CCN activity in the North China Plain 7419
tion mainly enhanced the number fraction of CCN-active par- ent during SA formation under distinct RH conditions. The
ticles in the particle size range of 200 to 300 nm, as SPAR ratio of NCCN calculated based on campaign-averaged SPAR
only revealed evident enhancement (Fig. 4(2e)) and NCCN (NCCN_cal ) to those measured at 0.05 % SS (NCCN_meas ) be-
only significantly increased (Fig. 4(2c)) in that size range. fore and after 4 December are shown in Fig. 5. SPAR is de-
As a result, although NCCN (> 300 nm) / SA decreased simi- termined by the variation of Da and MAF, which reflects
lar to that under high RH conditions, NCCN (< 300 nm) / SA changes in the hygroscopicity and number fraction of hy-
and NCCN (> 300 nm) / NR generally stayed constant, and groscopic particles. Thus, to investigate the respective in-
NCCN (< 300 nm) / NR even increased during SA formation fluences of MAF and Da variations on NCCN predictions,
in daytime (Fig. 4(2f)). The ratio between bulk NCCN and NCCN_AvgMAF (or NCCN_avgDa ) was calculated based on the
mass concentration of NR-PM2.5 became larger due to the real-time PNSD and SPAR estimated by replacing MAF (or
SA formation, suggesting stronger enhancement of NCCN Da ) in Eq. (7) with the campaign-averaged value. During
(0.05 %) in SA formation under low RH conditions because the high RH stage, underestimation of daytime NCCN_cal can
SA formation mainly added mass to CCN-inactive particles reach up to 20 %, since SPAR variations due to CCN ac-
and turned them into CCN-active particles. tivity enhancement were not considered. Similar deviations
In summary, during the campaign in this study, two kinds of both NCCN_AvgMAF and NCCN_avgDa from NCCN_meas were
of SA formation events were observed under different RH detected, suggesting that both MAF and Da variations con-
conditions with different variations of PM and NCCN at SSs tributed to NCCN_cal underestimation under high RH condi-
lower than 0.07 %. Under high RH conditions, there was tions. During the low RH stage, up to 50 % overestimation
strong secondary inorganic aerosol (SIA)-dominated SA for- existed in NCCN_AvgSPAR outside SA formation time peri-
mation, leading to stronger enhancements of CCN-active par- ods. Only NCCN_AvgMAF displayed similar deviations from
ticle number fraction and NCCN . Meanwhile, under low RH NCCN_meas as NCCN_AvgSPAR , indicating that differences be-
conditions, there was moderate secondary organic aerosol tween NCCN_cal and NCCN_meas were mainly contributed by
(SOA)-dominated SA formation, with moderate enhance- variations in MAF brought on by significant CCN-active
ments of CCN-active particle number fraction and NCCN . particles number fraction growth due to SA formation. To
However, for a unit amount of SA formation, the increase be noted, NCCN_AvgSPAR before and after 4 December were
of NCCN was stronger under low RH conditions and weaker both calculated based on the SPAR averaged over the en-
under high RH conditions. This was because SA formation tire campaign (green dots in Fig. 5a), since the applicability
under low RH conditions was more concentrated on particle of campaign-averaged SPAR in NCCN calculations was con-
sizes smaller than 300 nm and added more mass to CCN- firmed by many former studies in the NCP (Deng et al., 2013;
inactive particles, turning them into CCN-active particles. In Wang et al., 2013; Ma et al., 2016). During low RH peri-
addition, strong and distinct diurnal variations of CCN ac- ods, SPAR was generally lower than the campaign-averaged
tivity of particles were observed during different SA forma- SPAR, and the ratio between the calculated and measured
tion processes, whose effects on NCCN calculation need to be NCCN was systematically higher (lasting for the whole night).
evaluated further. In summary, SA formation processes can induce significant
deviation to NCCN prediction that varied with RH condi-
3.3 The influence of diurnal variation of CCN activity tions and mainly resulted from the variation in MAF. Thus,
on NCCN prediction for accurate NCCN estimations, considering the variation of
MAF (changes in the fraction of the hygroscopic particles) is
Since PNSD measurements are generally simpler and more highly essential.
common than NCCN measurements, NCCN is usually esti- As SOA is generally considered to be more hygroscopic
mated from real-time PNSD combined with parameterized than POA (Frosch et al., 2011; Lambe et al., 2011; Kuang et
CCN activity. In former sections, it was already manifested al., 2020a), the increase of hygroscopic particles or SA parti-
that SA formation under different RH conditions led to dis- cles (both SIA and SOA) were considered to be the cause for
tinct variations in PNSD and SPAR at SS of 0.05 % and hence the increase of SPAR within the 200 to 300 nm size range
different variations in NCCN . Thus, it is important for the pre- (Fig. 2). In order to account for the variations of hygro-
diction of NCCN to quantify sensitivity towards changes in scopic particles or SA particles in NCCN calculation, in the
PNSD and SPAR during SA formation processes under dif- following part, the number fraction of hygroscopic particles
ferent RH conditions. (GF(90 %, 200 nm)> 1.22, NFhygro ) measured by HTDMA
In this study, NCCN was mostly determined by PNSD, and the mass fraction of SA particles (MFSA ) measured by
as was generally the case in former studies (Dusek et al., ACSM in this campaign were used to represent MAF vari-
2006). During SA formation events, however, the variation ations and to provide calculation of NCCN at SS of 0.05 %
of CCN activity also contributed significantly to the devia- with smaller deviations combined with PNSD measurement.
tion of NCCN calculation. In former discussions, CCN ac- It should be noted that in order to highlight the application of
tivity (indicated by SPAR) at 0.05 % SS revealed significant using MFSA as an estimation of MAF variations in NCCN cal-
diurnal variations during this campaign, which were differ-
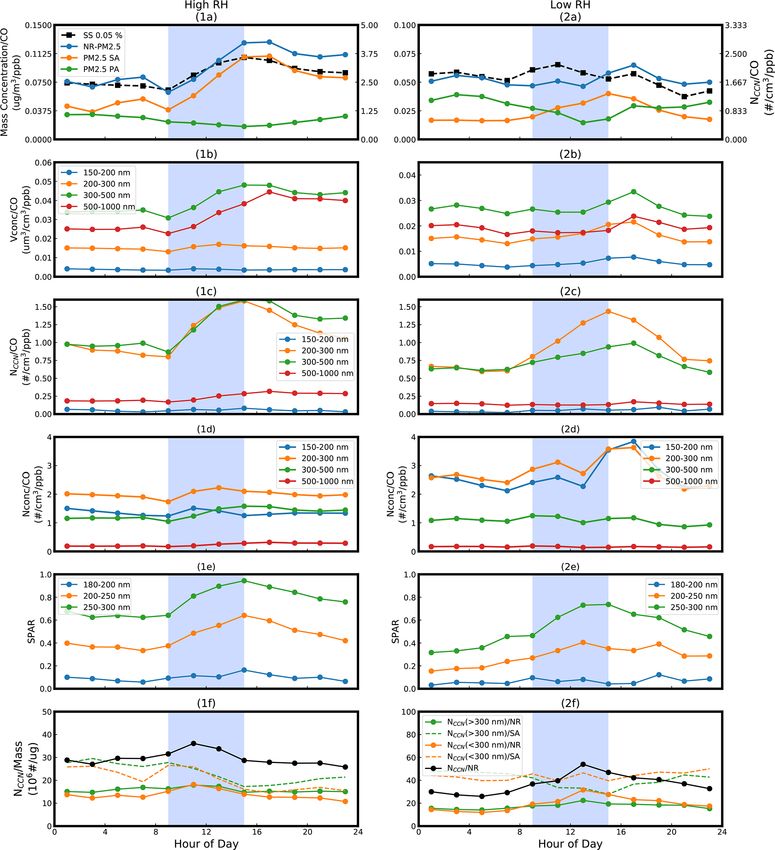
https://doi.org/10.5194/acp-21-7409-2021 Atmos. Chem. Phys., 21, 7409–7427, 20217420 J. Tao et al.: Secondary aerosol formation alters CCN activity in the North China Plain Figure 5. (a) The averaged SPAR at SS of 0.05 % during the campaign (green scatters), the corresponding fitting curve (green line) and the averaged fitting parameters (dotted line for Da and dashed line for MAF). The blue and yellow shaded areas represent the variations of SPAR before 4 December and after 4 December, respectively. The ratio between calculated NCCN and measured NCCN (b) before and (c) after 4 December. Bars represent 1 standard deviation, and colors represent different calculation of SPAR curves: green represents average SPAR during the campaign (AvgSPAR), yellow represents SPAR calculated with average Da and real-time MAF (AvgDa) and blue represents SPAR calculated with average MAF and real-time Da (AvgMAF). culation, the campaign-averaged Da from SPAR curves was played in Fig. 6c, the underestimation and correlation be- used. tween NCCN_cal and NCCN_meas were improved after intro- Based on the bulk hygroscopicity derived from particle ducing MFSA into NCCN calculation. Additionally, the di- chemical compositions measurements (κchem ), a critical di- urnal variations of the NCCN_cal /NCCN_meas ratio based on ameter for CCN activation can be calculated based on κ- different methods of NCCN calculation during the whole Köhler theory. With this critical diameter, NCCN (0.05 %) can campaign are shown in Fig. 6d. By considering real-time be predicted incorporating measured PNSD (NCCN_Chem ). MFSA variations, the deviation of calculated NCCN (real- The κ value of accumulation-mode particles derived from time MF) can be reduced throughout the day, compared to chemical composition of the bulk aerosol might bear signif- NCCN_Chem (real-time chem). Meanwhile, using an averaged icant uncertainties, which leads to significant deviations of MFSA to estimate SPAR and NCCN could also reduce devia- NCCN prediction. However, in practice, chemical composi- tions of calculated NCCN (averaged MF); however, it demon- tion measurements specifically for accumulation-mode par- strated a much stronger diurnal variation than the deviation ticles are not common; thus bulk aerosol chemical compo- of NCCN_MF . sitions are commonly applied in CCN studies as substitute Based on the bulk hygroscopicity derived from GF mea- (Zhang et al., 2014, 2016; Che et al., 2017; Cai et al., 2018), surements (κGF ) at 200 nm, Da can be calculated based especially when particle hygroscopicity measurements are on the κ-Köhler theory, which can be applied to predict lacking. As can be seen in Fig. 6a, NCCN_meas at 0.05 % NCCN at 0.05 % SS (NCCN_GF ) in combination with mea- SS was strongly underestimated by NCCN_Chem , especially sured PNSD. Figure 7a reveals that NCCN_meas was strongly at lower NCCN_meas (∼ 102 cm−3 ), which is similar to the underestimated by NCCN_GF (by more than 30 %), which results of studies that encountered high fractions of organ- might have resulted from the hypothesis of internal mixing ics (Chang et al., 2010; Kawana et al., 2016). This devia- state and the difference of particle hygroscopicity derived tion between NCCN_meas and NCCN_Chem may have resulted by GF and particle CCN activity measured under different from the hypothesis of internal mixing state and the differ- water vapor saturated conditions. Figure 7b depicts the pos- ence of particle hygroscopicity derived by particle chemical itive correlation between NFhygro and MAF at 0.05 % SS, composition measurements and CCN activity. Figure 6b de- which was weaker than that between MFSA and MAF. Sim- picts the correlation between mass fraction of SA (MFSA ) ilarly to before, NFhygro was applied as a proxy for MAF and MAF at 0.05 % SS. MFSA was generally positively cor- in the NCCN calculation, which also improved the underes- related to MAF (r = 0.8) with slight underestimations, sug- timation and correlation between NCCN_cal and NCCN_meas gesting externally mixed SA-dominated CCN-active parti- (Fig. 7c). Also, the campaign-averaged Da in Fig. 5a was cles. Thus, in the prediction of NCCN , real-time SPAR can used to calculate SPAR curves and NCCN . The diurnal vari- be calculated from campaign-averaged Da and MAF as- ations of the NCCN_cal /NCCN_meas ratio based on different sumed to be equal to real-time MFSA (NCCN_MF ). As dis- methods of NCCN calculation during the whole campaign Atmos. Chem. Phys., 21, 7409–7427, 2021 https://doi.org/10.5194/acp-21-7409-2021
J. Tao et al.: Secondary aerosol formation alters CCN activity in the North China Plain                                              7421

Figure 6. (a) The comparison between calculated NCCN based on κ derived from bulk particle chemical compositions (NCCN_chem ) and
measured NCCN at SS of 0.05 %. (b) The correlation between MAF and mass fraction of secondary aerosol (MFSA ). (c) The comparison
between calculated NCCN based on SPAR derived from real-time MFSA and average Da (NCCN_MF ) and measured NCCN . The dashed black
lines represent the relative deviation of 30 %. (d) The diurnal variations of the ratio between the calculated and measured NCCN during the
whole campaign based on different methods (green: NCCN_chem ; blue: NCCN calculated based on SPAR derived from averaged MFSA and
average Da ; yellow: NCCN_MF ).

are shown in Fig. 7d. By considering the real-time varia-               mation mechanisms, which contributed most to NCCN esti-
tion of NFhygro , the deviation of NCCN_NF (real-time NF)               mation deviations if unaccounted for. The diurnal variations
was mainly reduced during nighttime compared to NCCN_GF                 of MAF at the five measured SSs (Fig. S5) revealed sig-
(real-time GF). Meanwhile, applying an averaged NFhygro                 nificant diurnal variations at low SSs (0.05 % and 0.07 %)
to estimate SPAR and NCCN reduced the deviations of cal-                that were dependent on RH conditions, while only small di-
culated NCCN (averaged NF) during nighttime as well, but                urnal variations that were insensitive to the RH conditions
its deviations demonstrated stronger diurnal variations than            were detected at SSs above 0.2 %. In general, MAF became
those of NCCN_NF . If GF-PDF were directly used to calcu-               lower at lower SSs, especially during nighttime. As the frac-
late NCCN , NCCN_cal would agree well with measured NCCN                tion of CCN-active particles was generally hygroscopic and
(Fig. S4) because in this way the mixing state of aerosol               composed of secondary compounds, positive correlation was
would have been accounted for. However, compared to the                 found between MAF, MFSA and NFhygro . Although a good
approach using GF-PDF, NFhygro is easier to apply in NCCN               prediction of NCCN (0.05 %) was achieved by applying an
calculation and can yield similar accuracies.                           averaged MAF (Figs. 5, 6d and 7d), in practice, this would
   In summary, MAF exhibited strong diurnal variation that              still require CCN measurements or HTDMA/chemical com-
varied under different RH conditions due to different SA for-           position measurements as proxies. Additionally, deviations

https://doi.org/10.5194/acp-21-7409-2021                                                  Atmos. Chem. Phys., 21, 7409–7427, 2021
You can also read