Sea surface temperature evolution of the North Atlantic Ocean across the Eocene-Oligocene transition
←
→
Page content transcription
If your browser does not render page correctly, please read the page content below
Clim. Past, 19, 123–140, 2023
https://doi.org/10.5194/cp-19-123-2023
© Author(s) 2023. This work is distributed under
the Creative Commons Attribution 4.0 License.

Sea surface temperature evolution of the North Atlantic Ocean
across the Eocene–Oligocene transition
Kasia K. Śliwińska1,2 , Helen K. Coxall3,4 , David K. Hutchinson3,5 , Diederik Liebrand6 , Stefan Schouten2,7 , and
Agatha M. de Boer3,4
1 Department  of Geoenergy and Storage, Geological Survey of Denmark and Greenland (GEUS),
Øster Voldgade 10, 1350 Copenhagen, Denmark
2 Department of Marine Microbiology and Biogeochemistry, NIOZ Royal Netherlands Institute for Sea Research,

Landsdiep 4, 1797 SZ ’t Horntje, Texel, the Netherlands
3 Department of Geological Sciences, Stockholm University, Svante Arrhenius väg 8, 114 18 Stockholm, Sweden
4 Bolin Centre for Climate Research, Stockholm University, Stockholm, Sweden
5 Climate Change Research Centre, University of New South Wales, Sydney NSW 2052, Australia
6 National Oceanography Centre, European Way, SO14 3ZH, Southampton, United Kingdom
7 Department of Earth Sciences, Faculty of Geosciences, Utrecht University, Vening Meinesz building A,

Princetonlaan 8a, 3584 CB Utrecht, the Netherlands

Correspondence: Kasia K. Śliwińska (kksl@geus.dk) and Agatha M. de Boer (agatha.deboer@geo.su.se)

Received: 16 December 2021 – Discussion started: 25 January 2022
Revised: 10 November 2022 – Accepted: 21 November 2022 – Published: 13 January 2023

Abstract. A major step in the long-term Cenozoic evolution           Such cooling might be unexpected in light of proxy
toward a glacially driven climate occurred at the Eocene–         and modelling studies suggesting the start-up of the At-
Oligocene transition (EOT), ∼ 34.44 to 33.65 million years        lantic Meridional Overturning Circulation (AMOC) before
ago (Ma). Evidence for high-latitude cooling and increased        the EOT, which should warm the North Atlantic. Results
latitudinal temperature gradients across the EOT has been         of an EOT modelling study (GFDL CM2.1) help reconcile
found in a range of marine and terrestrial environments.          this, finding that a reduction in atmospheric CO2 from 800
However, the timing and magnitude of temperature change           to 400 ppm may be enough to counter the warming from
in the North Atlantic remains highly unconstrained. Here, we      an AMOC start-up, here simulated through Arctic–Atlantic
use two independent organic geochemical palaeothermome-           gateway closure. While the model simulations applied here
ters to reconstruct sea surface temperatures (SSTs) from          are not yet in full equilibrium, and the experiments are ide-
the southern Labrador Sea (Ocean Drilling Program – ODP           alised, the results, together with the proxy data, highlight the
Site 647) across the EOT. The new SST records, now the            heterogeneity of basin-scale surface ocean responses to the
most detailed for the North Atlantic through the 1 Myr lead-      EOT thermohaline changes, with sharp temperature contrasts
ing up to the EOT onset, reveal a distinctive cooling step        expected across the northern North Atlantic as positions of
of ∼ 3 ◦ C (from 27 to 24 ◦ C), between 34.9 and 34.3 Ma,         the subtropical and subpolar gyre systems shift. Suggested
which is ∼ 500 kyr prior to Antarctic glaciation. This cooling    future work includes increasing spatial coverage and reso-
step, when compared visually to other SST records, is asyn-       lution of regional SST proxy records across the North At-
chronous across Atlantic sites, signifying considerable spa-      lantic to identify likely thermohaline fingerprints of the EOT
tiotemporal variability in regional SST evolution. However,       AMOC start-up, as well as critical analysis of the causes of
overall, it fits within a phase of general SST cooling recorded   inter-model responses to help better understand the driving
across sites in the North Atlantic in the 5 Myr bracketing the    mechanisms.
EOT.

Published by Copernicus Publications on behalf of the European Geosciences Union.
124                                     K. K. Śliwińska et al.: Sea surface temperature evolution of the North Atlantic Ocean

1   Introduction                                                    ate dissolution in the sub-Arctic North Atlantic, which limits
                                                                    proxy-based temperature estimates using foraminiferal cal-
The principal signature of climatic change across the               cite, and (ii) gaps in the sedimentary record at many sites
Eocene–Oligocene transition (EOT) in deep marine records            across the Eocene–Oligocene boundary that are caused by
is an apparent two-step positive increase in the oxygen iso-        deep-sea erosion linked to bottom water current strengthen-
topic (δ 18 O) composition of deep-sea foraminifera, centred        ing (e.g. Miller et al., 1985).
around 34 Ma (Zachos et al., 1996; Coxall et al., 2005) (Sup-          Here we present new proxy records of sea surface tempera-
plement). Current understanding is that the first δ 18 O step       ture from Ocean Drilling Program (ODP) Site 647 (53◦ 200 N
mostly reflects ocean cooling (Step 1; 33.9 Ma, known previ-        45◦ 160 W), located in the western North Atlantic (Fig. 1),
ously as EOT-1; see Hutchinson et al., 2021) and the second         across an upper Eocene to middle Oligocene (i.e. time
step reflects the accumulation of terrestrial ice on Antarctica     equivalent to ∼ 38–∼ 26.5 Ma) succession of hemipelagic
(Lear et al., 2008; Bohaty et al., 2012; Zachos et al., 1996),      clay from the southern Labrador Sea. We use the TEX86
which was recently redefined as the Early Oligocene oxy-            (tetraether index of 86 carbon atoms) and U37     K 0 (modified

gen Isotope Step (EOIS); at around 33.6 Ma (Hutchinson et           unsaturated ketone index) proxies (Fig. 2), which are two
al., 2021) (see also Supplement). While a cooling signal is         independent palaeothermometers based on fossil organic
recorded in the benthic realm, its absolute amplitude, expres-      biomarkers derived from archaea and photosynthetic plank-
sion at the surface ocean, and its global extent and unifor-        ton, respectively (Schouten et al., 2002; Brassell et al., 1986).
mity remain largely unconstrained. A variety of data types          These new data constitute the best-resolved EOT-spanning
support the EOT cooling in the low latitudes and the south-         SST proxy records from the Northern Hemisphere to date.
ern high latitudes, revealing temperature decreases that range      They document patterns of temperature change in the north-
between 2.5 to 5 ◦ C in the deep sea (Bohaty et al., 2012;          western Atlantic and help decipher the complex temperature
Lear et al., 2008; Pusz et al., 2011) and between 2 to 6 ◦ C        evolution of the (North) Atlantic Ocean across the largest cli-
in surface waters and on land (Bohaty et al., 2012; Haiblen         mate state change of the Cenozoic era.
et al., 2019; Lauretano et al., 2021; Liu et al., 2009; Tibbett        We compare our newly obtained SST record to published
et al., 2021; Wade et al., 2012). Temperature evolution of the      SST proxy records and reconstruct latitudinal SST gradients
high northern latitudes, including regions of the North At-         for the Eocene and Oligocene in the North Atlantic (Figs. 3
lantic Ocean where deep water is formed in the present day          and 4). The compilation of SST records (Fig. 3a) shows cool-
(Broeker, 1991; de Boer et al., 2008), however, remains less        ing in the Atlantic across the EOT that one might expect to
documented.                                                         be part of the global transitioning into an icehouse world and
   Existing low-resolution palaeoclimate reconstructions            which is usually attributed to a reduction in atmospheric CO2
from the Norwegian–Greenland Sea, including sea surface             (Anagnostou et al., 2016; Cramwinckel et al., 2018). Hy-
temperature (SST) and terrestrial temperature constraints           potheses for the CO2 decrease abound and include gradual
from palynology (Eldrett et al., 2009), organic molecular fos-      reduction in tectonically driven outgassing, expansion of ma-
sils (Liu et al., 2009; Schouten et al., 2008), and sediment        rine carbon sinks (Müller et al., 2022), weathering, or biolog-
grains (i.e. ice-rafted debris) (e.g. Eldrett et al., 2007), sug-   ical pump feedbacks from an Atlantic Meridional Overturn-
gest some degree of cooling and increased seasonality con-          ing Circulation (AMOC) start-up (Hutchinson et al., 2021;
current with the EOT, which is possibly tied to relatively mi-      Elsworth et al., 2017; Fyke et al., 2015). The AMOC has
nor land-ice expansions on Greenland (Eldrett et al., 2007;         been suggested by multiple proxies to become active around
Bernard et al., 2016). Records from the mid-latitude North          the time of the EOT (Borrelli et al., 2021, 2014; Boyle et al.,
Atlantic report no SST change across the EOT as evidence            2017; Coxall et al., 2018; Hutchinson et al., 2019; Kaminski
of a temporary decoupling of the North Atlantic Ocean from          and Ortiz, 2014,; Langton et al., 2016; Uenzelmann-Neben
the southern high latitudes and thus hemispherical asymmet-         and Gruetzner, 2018; Via and Thomas, 2006). Theory and
ric cooling, attributed to changes in circulation-driven heat       modelling work have attributed the AMOC start-up alterna-
transport (Liu et al., 2018). This existing suite of northern       tively to Arctic closure (Hutchinson et al., 2019; Straume et
EOT temperature records, still provide sparse coverage, with        al., 2022), the deepening of Drake Passage and/or the Tasman
gaps at critical stages in the late Eocene and are of gener-        Gateway (Toggweiler and Bjornsson, 2000), and the deep-
ally low temporal resolution, especially in the 1 Myr lead          ening of the Greenland Scotland Ridge (Stärz et al., 2017).
interval prior to the EOT onset. These data can therefore           A main feature of the AMOC is its northward heat trans-
not be correlated in great detail to the EOT as identified in       port in the Atlantic, which acts to warm the high-latitude
global benthic foraminiferal δ 18 O records. This limits the un-    North Atlantic more than it would be otherwise expected,
derstanding of cause-and-effect relationships with the much         begging the question of how AMOC warming and CO2 cool-
better resolved δ 18 O and deep-sea temperature records from        ing may combine to produce reconstructed cooling in the
the Southern Hemisphere (e.g. Hutchinson et al., 2021). A           North Atlantic. To address this question, we here analyse
further stumbling block is that the quality of many northern        the SST patterns in the modelling output from Hutchinson et
North Atlantic records is often compromised by (i) carbon-          al. (2018, 2019) (model GFDL CM2.1), in which they com-

Clim. Past, 19, 123–140, 2023                                                           https://doi.org/10.5194/cp-19-123-2023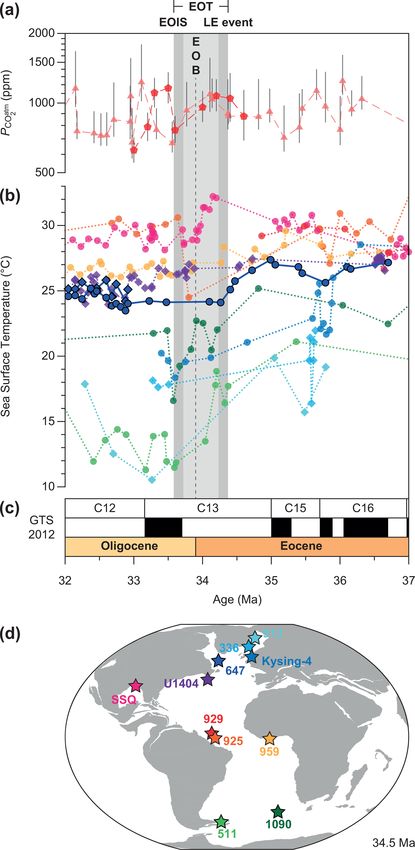
K. K. Śliwińska et al.: Sea surface temperature evolution of the North Atlantic Ocean                                              125

                                                                          of available North Atlantic SST records. The data are then
                                                                          compared to the modelling simulations, and the implications
                                                                          for the processes in the North Atlantic and at the core site are
                                                                          discussed. We conclude with a summary of the results and
                                                                          the potential implications for the state of knowledge of what
                                                                          happened at the EOT.

                                                                          2   Labrador Sea Ocean Drilling Program Site 647

                                                                          ODP Hole 647A constitutes the most northerly location
                                                                          (53◦ N) where a complete upper Eocene–middle Oligocene
                                                                          sedimentary sequence is known to be present (Coxall et
                                                                          al., 2018; Firth et al., 2013) (Fig. 1). The studied succes-
                                                                          sion consists of greyish-green, moderately to strongly biotur-
                                                                          bated nannofossil claystone and nannofossil chalk (see Sup-
                                                                          plement). The core recovery across the EOT (Cores 27R to
                                                                          30R) is reasonable (Fig. S1). However, Core 29R is heav-
                                                                          ily disturbed (Fig. S1) and is usually omitted in the analy-
                                                                          sis of the site (Firth, 1989; Kaminski and Ortiz, 2014). We
                                                                          have processed one sample from the Core 29R (29R-4, 130-
                                                                          132, 275.5 m b.s.f. – metres below see floor; Fig. S1) for
                                                                          calcareous nannofossils and biomarkers. In the sample we
Figure 1. The late Eocene (magnetic polarity Chron 13; 33.705–            found neither caved (younger) nor reworked (older) calcare-
33.157 Ma (GTS2012)) location of Site 647 (ODP Leg 105) and               ous nannofossil taxa (John Firth, personal communication,
other sites studied for temperature proxies (pollen in ODP 913B,          2013); thus, despite intra-core sediment mixing the analysed
ODP 643, ODP 985: Eldrett et al., 2009; alkenones in DSDP                 biomarker signal remains stratigraphically useful, albeit pro-
336, ODP 913B, and IODP U1404: Liu et al., 2009, 2018; glyc-              ducing a time-average SST signal, potentially for the whole
erol dialkyl glycerol tetraethers (GDGTs) in Kysing-4: Śliwińska        Core C29.
et al., 2019) referred to in the text. The palaeogeographic map
                                                                             The absolute ages for the studied succession are calculated
is modified after Arthur et al. (1989), Piepjohn et al. (2016), Śli-
wińska et al. (2019), and references therein. Abbreviated oceanic
                                                                          up to the depth of 214.19 m b.s.f., where the highest occur-
features identified are the Feni Drift (FD) (Davies et al., 2001), Judd   rence of Reticulofenestra umbilicus (with diameter >14 µm)
Falls Drift (JFD) (Hohbein et al., 2012), Greenland–Scotland Ridge        is observed, which provides an absolute age of 32.02 Ma at
(GSR), and Charlie–Gibbs Fracture Zone (CGFZ). The red and blue           that depth (Firth et al., 2013). The uppermost part of the stud-
lines labelled as “extension of the warm water pool” and “extension       ied succession belongs to the NP24 (Firth, 1989) and the
of the cold water pool”, respectively, represent the positions of sur-    normal polarity magnetochron (Firth et al., 2013), suggest-
face ocean gyre systems that expand with a late Eocene AMOC               ing that it is probably not younger than 26.5 Ma. Overall,
switched on in our model experiments.                                     even with some core disturbance and other minor core recov-
                                                                          ery gaps, a bio-magnetostratigraphic age model was obtained
                                                                          for the interval between ∼ 38 and ∼ 32 Ma (Figs. 2, 3, and
pared the impact of Arctic closure (causing Atlantic salin-               S2). The datums included in the age model have been con-
ification sufficient to trigger deep sinking) and an atmo-                verted to the GTS2012 (Vandenberghe et al., 2012) (Figs. 2,
spheric CO2 decrease on the deep-ocean circulation. They                  3, and S3), using tie points proposed by Firth et al. (2013)
concluded that only the Arctic closure could lead to a start-up           (Śliwińska, 2022).
of the AMOC at the EOT (other mechanisms failed to initi-                    In other deep-sea sequences across the EOT, combined
ate AMOC sinking). This finding was corroborated recently                 δ 18 O and magnetic reversal stratigraphy has shown that high
by Straume et al. (2022), even though the authors closed off              δ 18 O values diagnostic of the Early Oligocene Glacial Max-
the Arctic–Atlantic connection via different tectonic changes             imum (EOGM) δ 18 O increase (Oi-1 of Zachos et al., 1996;
than Hutchinson et al. (2019). Here we focus on the implica-              Katz et al., 2008; and Coxall and Wilson, 2011; “Step 2” of
tions of these processes on SST.                                          Coxall et al., 2005; EOIS of Hutchinson et al., 2021) reach a
   The paper starts with a description of the drilling site and           peak close to the base of the magnetochron C13n, while the
core, followed by detail on the various data methods used in              prior and first phase of the EOT transition (“Step 1” of Cox-
the study and a description of the model and simulations. The             all et al., 2005; “EOT-1” of Katz et al., 2008, and Coxall and
results address first the specific SST time series in the Site            Wilson, 2011) occurs in the previous reversed-polarity zone
647 record and then analyses the new dataset in the context               C13r, where δ 18 O is on average 0.5 ‰–1 ‰ lower. A weak

https://doi.org/10.5194/cp-19-123-2023                                                                  Clim. Past, 19, 123–140, 2023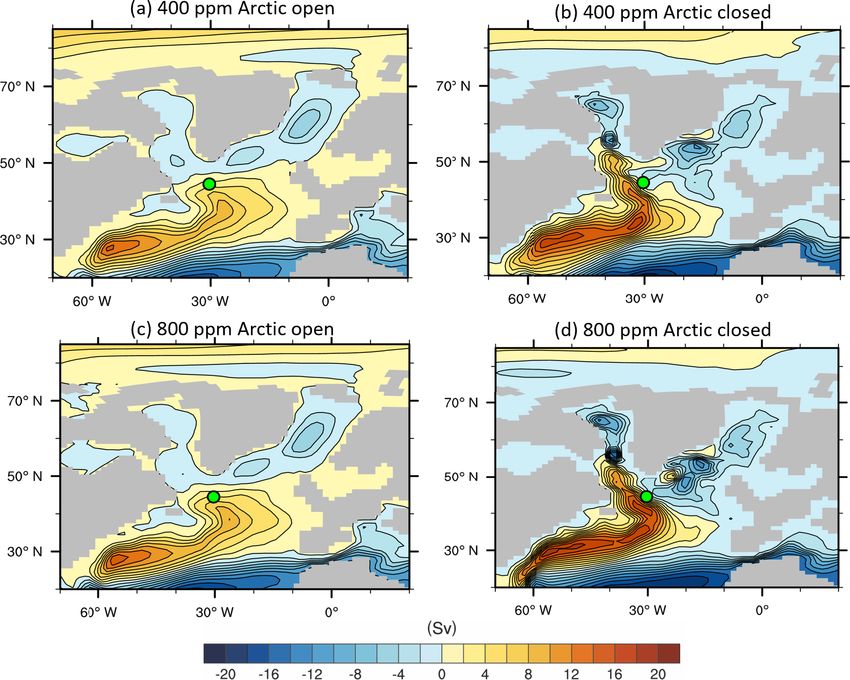
126                                      K. K. Śliwińska et al.: Sea surface temperature evolution of the North Atlantic Ocean

Figure 2. The sea surface temperature (SST) record from the Ocean Drilling Program (ODP) Site 647A. (a) SSTs based on TEX86 and
  K 0 indices (this study). Magnetostratigraphy after Firth et al. (2013). MAT – modern average annual temperatures (10.6 ◦ C), ST – modern
U37
summer temperatures (15.2 ◦ C) at the palaeolocation of 46◦ N based on the Ocean World database. EOIS – Earliest Oligocene Isotope Step.
EOIS, Step 1, late Eocene event, and EOT following nomenclature of Hutchinson et al. (2021). (b) The new temperature record across
the Eocene–Oligocene transition (EOT) compared to (i) benthic foraminifera oxygen stable isotope (δ 18 O) records from ODP Site 647
(Oridorsalis umbonatus; >63 µm) (Coxall et al., 2018) and an inferred zone of acute North Atlantic deep-water circulation change and (ii)
benthic δ 18 O record from ODP Site 1218 providing the chemostratigraphic framework that allows us to extrapolate the EOIS, Step 1, and
late Eocene events to Site 647 (Coxall and Wilson, 2011). All ages are based on the GTS2012 (Vandenberghe et al., 2012).

spot in the Firth et al. (2013) age model for Site 647 occurs           20 cm). Samples were freeze-dried and mechanically pow-
close to the Eocene–Oligocene boundary due to the partic-               dered and 5–17 g of sediment was taken for further analy-
ularly discontinuous coring at that level (Fig. S1). Firth et           sis. The total lipid extract was obtained from sediments us-
al., (2013) used a depth of 270.93 m b.s.f. as the age tie point        ing the accelerated solvent extraction (ASE) technique with
for the C13r–C13n reversal boundary at Site 647. Due to the             dichloromethane (DCM) : methanol (MeOH) (9 : 1, v/v).
sampling limits of the palaeomagnetic analysis (Core 29R                Excess solvent was removed by evaporation under nitrogen
also exhibits sediment disturbance, eliminating any coherent            in the TurboVap® LV for 1 h under constant temperature
palaeomagnetic signal) there is a ±9 m uncertainty associ-              (30 ◦ C) and constant gas pressure (15 psi). The total lipid ex-
ated with this horizon (see Table S2 in Coxall et al., 2018).           tract was separated over an activated Al2 O3 column into ap-
Our benthic δ 18 O sample from 269.79 m b.s.f. falls within the         olar (hexane : DCM, 1 : 1, v/v), ketone (hexane : DCM, 1 : 1,
zone of palaeomagnetic uncertainty. Since it has a relatively           v/v), and polar (DCM : MeOH, 1 : 1, v/v) fractions, respec-
low value of δ 18 O we interpret this to be “pre-EOGM” and              tively.
therefore a pre-C13n value; thus it most likely occurs within
C13r. We can therefore shift the C13r–C13n reversal depth
up to 265 m b.s.f., which is a revised estimate of the palaeo-
magnetic reversal position after Firth et al. (2013).
                                                                        3.1.1   Alkenone-based temperature estimates

3     Methods
                                                                        The ketone fraction was analysed for alkenones. Sufficient
                                                                        concentrations of di- and tri-unsaturated alkenones were de-
3.1    Biomarkers
                                                                        tected in the 32 uppermost samples (i.e. between 241.14 and
Organic compounds were extracted from 71 sediment                       135.50 m b.s.f.). In these samples we calculated sea surface
samples collected from the interval between 397.60 and                  temperatures by applying a U37 K 0 proxy (Prahl and Wakeham,

135.50 m b.s.f. (39R 02W, 100–102 cm; 15R 01W, 10–                      1987; Brassell et al., 1986).

Clim. Past, 19, 123–140, 2023                                                                https://doi.org/10.5194/cp-19-123-2023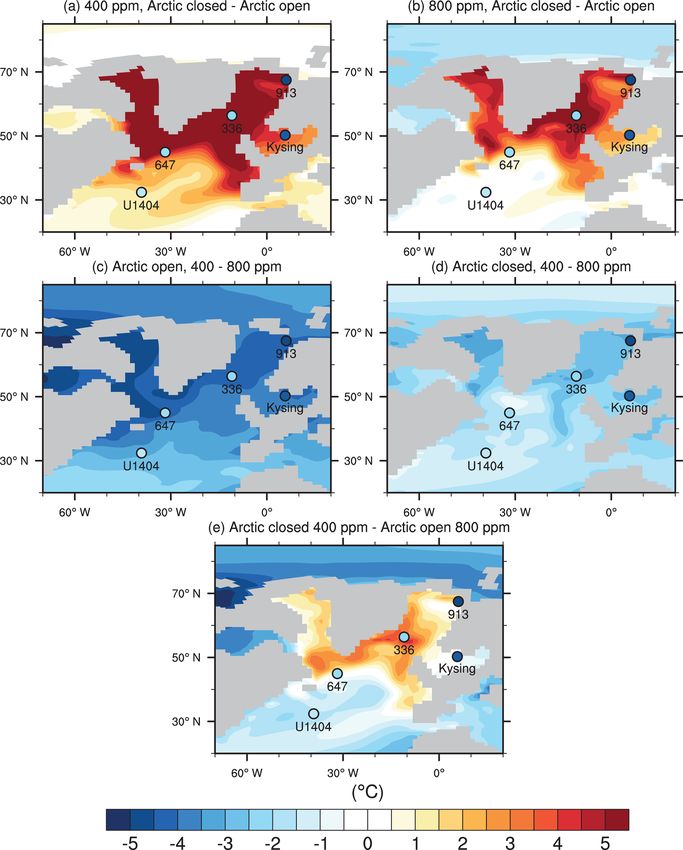
K. K. Śliwińska et al.: Sea surface temperature evolution of the North Atlantic Ocean 127
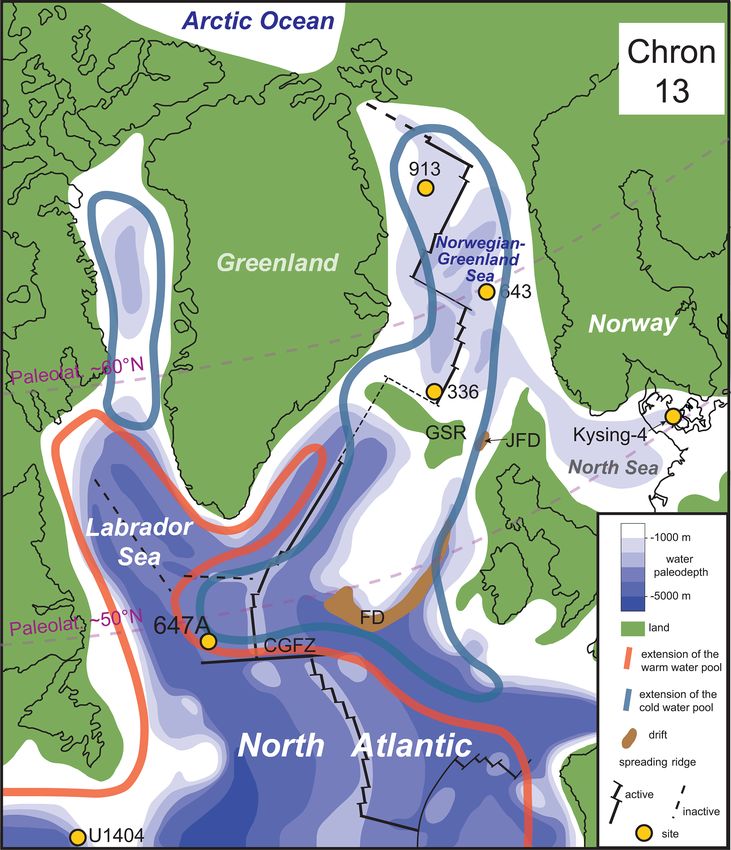
Figure 4. Data–model comparison of latitudinal SST gradients for
the late Eocene (37–34.5 Ma, orange bars and solid lines) and early
Oligocene (34.5–32 Ma, violet bars and solid lines) states to the four
different model simulations (raw data are shown in Fig. S5) The
dashed lines show the zonal average SSTs at that latitude in the At-
lantic sector, and the triangles show the site-specific temperatures in
the simulations. The 1 and 2 sigma error bars are indicated around
the data points. On the left of the figure, indicated by a solid blue
line, is the zonally average present-day Atlantic SST from the World
Ocean Atlas (WOA; Boyer et al., 2013), used as a reference for
the present-day Atlantic sea surface temperature latitudinal gradi-
ent. Model palaeolatitudes (right-hand axis) are shifted with respect
to present-day latitudes of the data (site and WOA data, left-hand
axis) by the average offset of −7.0◦ (error: ±1.5◦ ) for the sites con-
sidered. For sites 913, 336, and U1404 SST data are derived from
U37K 0 , while at sites Kysing-4 and 647 SST is derived from TEXH .
86
Arc op – Arctic–Atlantic Gateway open, Arc cl – Arctic–Atlantic
Gateway closed, 800–800 ppm CO2 simulation, 400–400 ppm CO2
simulation.
0
K index was calculated as follows:
First, the U37
Figure 3. SST evolution across the EOT in the Atlantic Ocean.
(a) Reconstructed PCOatm based on planktonic foraminiferal δ 11 B K 0 [C37:2]
2 U37 = , (1)
[C37:2] + [C37:3]
(pentagons) (Pearson et al., 2009) and phytoplankton alkenone δ 13 C
(triangles) (Pagani et al., 2011; Zhang et al., 2013). The effect of where the numbers in [C37:2] and [C37:3] refer to the num-
PCOatm on radiative forcing scales logarithmically. (b) Newly gener- ber of carbon atom and double bonds in the molecule. Sec-
2
ated and published (Cramwinckel et al., 2018; Houben et al., 2019; ond, the index was converted into temperature following the
Inglis et al., 2015; Liu et al., 2018, 2009; Śliwińska et al., 2019; calibration of Müller et al. (1998).
Wade et al., 2012) reconstructed SSTs based on U37 K 0 (diamonds)
K 0
and TEXH 86 (circles). All ages are converted into the GTS2012 (Van-
T = (U37 − 0.044)/0.033 (2)
denberghe et al., 2012). (c) Magneto- and chronostratigraphy based
on the GTS2012 (Vandenberghe et al., 2012). (d) Palaeogeography The T calibration error for Eq. (2) is ±1.5 ◦ C. For seven sam-
at 34.5 Ma (https://www.odsn.de/, September, 2020) with colour- ples, which were analysed in duplicate, the reproducibility
coded site locations of the SST records shown in panel (b). SSQ was better than 0.6 ◦ C (Fig. S2).
stands for St. Stephen’s Quarry. Notably, the alkenones detected in our study do not orig-
inate from Emiliania huxleyi, a coccolithophore which has
been present only for the past 270 kyr. However, as was
https://doi.org/10.5194/cp-19-123-2023 Clim. Past, 19, 123–140, 2023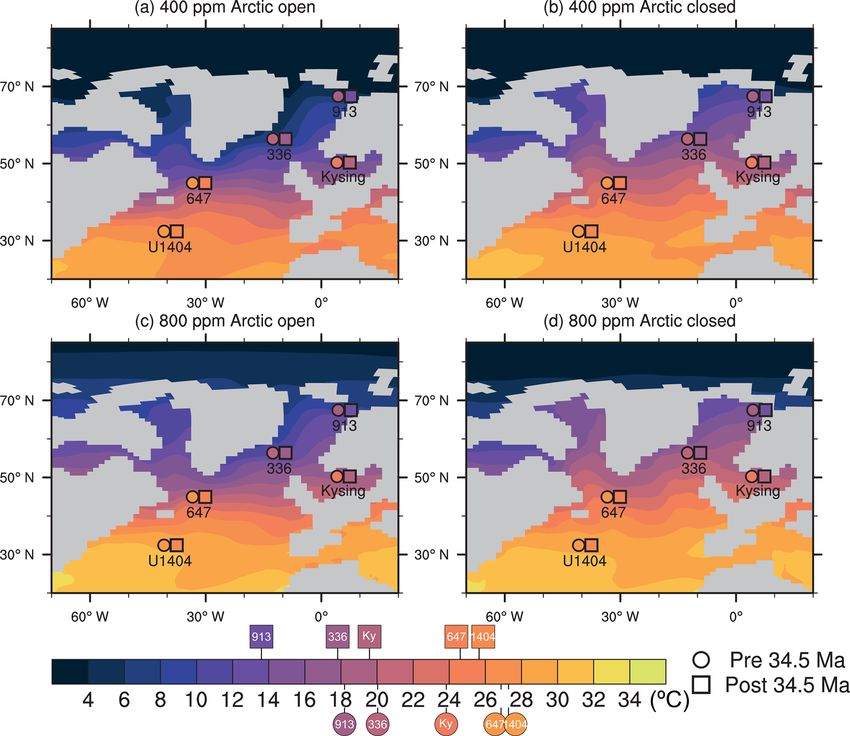
128                                      K. K. Śliwińska et al.: Sea surface temperature evolution of the North Atlantic Ocean

shown by several studies, the Palaeogene ancestors show              spectrometer settings (Schouten et al., 2013a). In the stud-
a similar response of the U37  K 0 index to surface tempera-         ied interval the BIT index rarely exceeds 0.35 and shows no
ture compared to modern-day alkenone producers (Brassell,            apparent trend in time. Furthermore, for the entire sample
2014; Villanueva et al., 2002). Like any other proxies, the          set, we find no correlation between BIT index and TEX86
  K 0 index has its uncertainties, but they are generally con-
U37                                                                  (R 2 = 0.01).
sidered to be minimal when compared to other proxies.
   The calibration of Müller et al. (1998) is nearly identical to
                                                                     3.1.3   TEXH    - and BAYSPAR-based temperature
the culture-based calibration used for E. huxleyi by Prahl et                     86
                                                      K 0 -derived           estimates
al. (1988) and is commonly used to estimate the U37
SST of the late Palaeogene to Neogene strata in the northern         Due to BIT and/or 1RI exceeding their cut-off values, 18
high to mid-latitudes (see e.g. Liu et al., 2009; Herbert et al.,    samples are excluded from the TEX86 compilation (see
2020; Weller and Stein, 2008).                                       above). Out of 71 sediment samples, 14 were analysed in du-
                                                                     plicate and 2 in triplicate. In our study we have applied two
3.1.2   GDGT distribution                                            calibrations for TEX86 -derived SST estimations: the TEXH   86
                                                                     (where H stands for high-temperature regions) linear calibra-
The polar fraction (containing glycerol dialkyl glycerol             tion (Kim et al., 2010) and the TEX86 Bayesian regression
tetraethers, GDGTs) was concentrated under N2 , dissolved            model (BAYSPAR) (Tierney and Tingley, 2014, 2015). In the
in hexane/isopropanol (99 : 1, v/v), filtered using a 0.4 µm         modern oceans the TEXH    86 is calculated as follows:
PTFE filter, and analysed using high-pressure liquid chro-
matography (HPLC) as described by Schouten et al. (2007).
                                                                     TEXH
                                                                        86 =
Prior to calculating the sea surface temperatures from the                                                                    !
                                                                                   [GDGT − 2] + [GDGT − 3] + Cren0

TEX86 proxy, we have evaluated the source and the distri-
                                                                      log                                                  .
bution of GDGTs.                                                             [GDGT − 1] + [GDGT − 2] + [GDGT − 3] + Cren0

   For detecting a methanogenic input of GDGTs we ap-                                                                             (3)
plied the %GDGT-0 index (Sinninghe Damsté et al., 2012).
Studies on enrichment cultures of Thaumarchaeota suggest             Raw TEXH   86 values for the studied interval are between 0.56
that when %GDGT-0 values reach values above 67 % the                 and 0.71, with a mean value of 0.63 (1σ calibration uncer-
sedimentary GDGT pool may be affected by an additional               tainty). SST was subsequently calculated as follows:
(probably methanogenic) source of GDGTs. Our Eocene to
Oligocene sediments have %GDGT-0 values between 26 %                 T ◦ C = 68.4 TEXH

                                                                                     86 + 38.6 .                                  (4)
and 63 %, with a mean value of 41 % (Śliwińska, 2022), and
thus the GDGT pool bears no signs of methanogenic source             The T calibration error for Eq. (4) is ∼ 2.5 ◦ C. The analytical
for the sedimentary archaea. Low values of the methane in-           error in the SST derived from TEXH              ◦
                                                                                                          86 is ±0.6 C.
dex (MI) (Zhang et al., 2011) and the GDGT-2 : Crenarchaeol             We also calculated SST predictions using the Bayesian re-
ratio (Weijers et al., 2011) (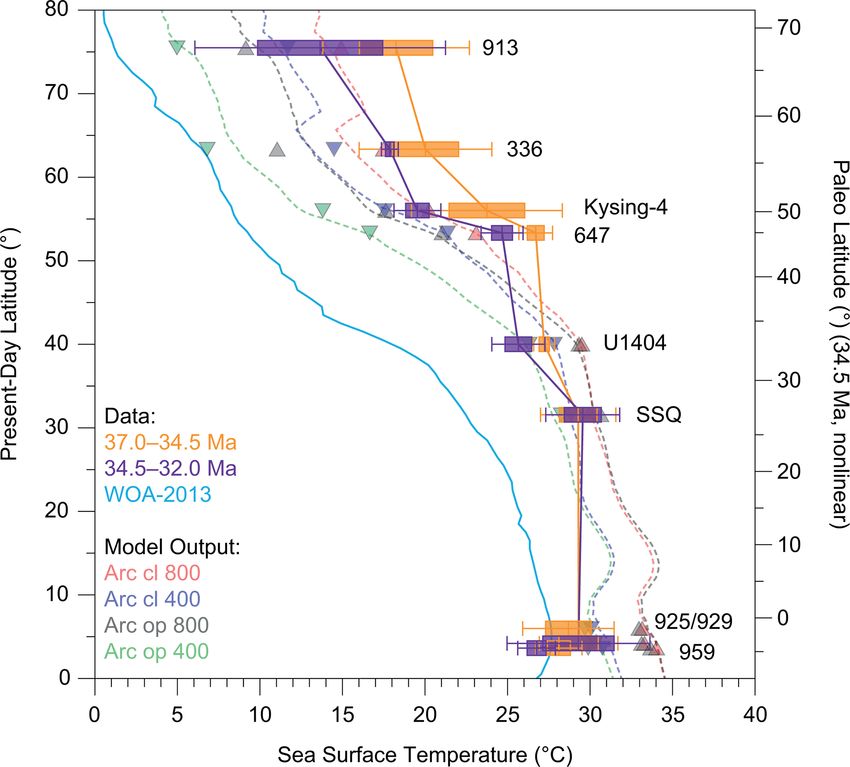
K. K. Śliwińska et al.: Sea surface temperature evolution of the North Atlantic Ocean 129
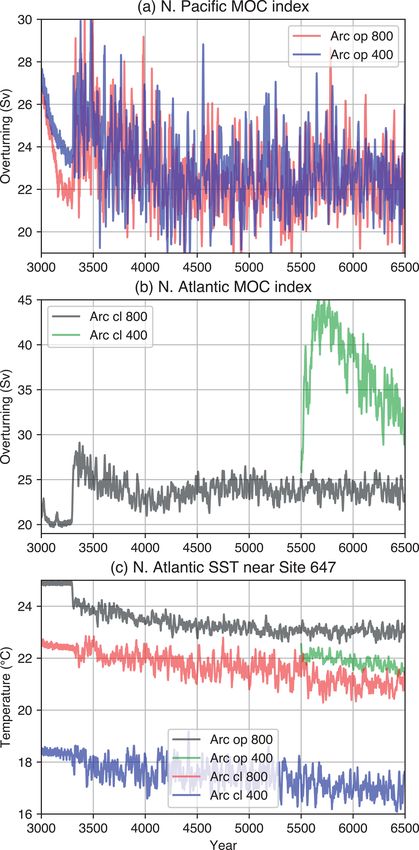
3.1.4 Potential bias of the TEX86 index Straume et al., 2020). In this configuration, sinking occurs
in the North Pacific and the Southern Ocean, but no deep wa-
Some studies suggested that TEX86 reflects subsurface rather ter forms in the North Atlantic. We also simulated a modified
than surface temperatures (e.g. Lopes dos Santos et al., 2010; version of the model with the Arctic–Atlantic Gateway fully
Huguet et al., 2007). However, the U37 K 0 index, which is a
closed, as outlined in Hutchinson et al. (2019). This change
well-established proxy for SST, in the earliest Oligocene dramatically increases the salinity in the North Atlantic and
(covered by the interval from ∼ 240 to ∼ 190 m b.s.f.) shows enables North Atlantic deep water to form. We thus com-
an overall match in both absolute values and the tempera- pare the mean state and response to halving CO2 from 800
ture trend as derived from TEXH 86 (Figs. 2, 3, and S2). These to 400 ppm in a configuration where there is and where there
two proxies are based on organisms with different ecological is not an AMOC present. All simulations were run for 6500
preferences and thus may reconstruct temperatures of differ- years, using the same spin-up method as applied by Hutchin-
ent seasons and depths compared to each other. Nevertheless, son et al. (2018) except the 400 ppm Arctic-closed simula-
the similarity of both records during the earliest Oligocene tion, which was branched from the 800 ppm Arctic-closed
(covered by the interval from ∼ 240 to ∼ 190 m b.s.f.) sug- configuration at year 5500 and continued for 1000 model
gests that the temperatures recorded by both proxies are in- years (Fig. 5, green). The AMOC in this run is clearly not
dicative of surface conditions. Qin et al. (2015) questioned in equilibrium yet, reducing by ∼ 10 Sv in the last 500 years
the application of the TEX86 proxy in sediments deposited (Fig. 5b). Similarly, the SST around the area of Site 647 is
under low O2 concentrations. However, the nature of the still decreasing by ∼ 0.4 ◦ C in these 500 years with no ob-
benthic foraminiferal assemblages (e.g. Kaminski and Or- vious reduction in this trend by year 6500, suggesting that
tiz, 2014; Kaminski et al., 1989), evidence of bioturbation the final state would be at least as cold as the Arctic-closed
throughout the recovered cores (Stein et al., 1989), and lack 800 ppm case (Fig. 5c, red) and potentially even colder.
of other sedimentological features suggesting exceptionally It should further be noted that the GFDL CM2.1 model
low-oxygen conditions (Eldholm et al., 1987) across the in- was the only model to simulate deep sinking in the North Pa-
terval covering the EOT imply that deposition took place cific for the DeepMIP model intercomparison project of the
in oxygenated bottom waters (see also Kaminski and Ortiz, early Eocene (Zhang et al., 2022). Fish debris neodymium
2014; Ortiz and Kaminski, 2012). There is no correlation be- (Nd) proxy data suggest deep sinking in the Pacific, but the
tween BIT index and TEX86 , so we can assume that TEX86 evidence is not conclusive yet. It is therefore currently not
values are probably not biased by terrestrial input. It has been possible to determine which models have the most realis-
also shown that oxic degradation of biomarker lipids can af- tic ocean state (Zhang et al., 2022). Suffice to say that the
fect their relative distribution and thus the TEX86 (Huguet models simulate a wide variety of ocean states for the same
et al., 2009). However, we do not observe any signs of oxic Eocene boundary conditions, so that sensitivity studies like
degradation in the analysed material, such as a sharp increase these would also be highly model-dependent.
in the BIT index values or a high degree of correlation be-
tween TEX86 and BIT.
4 Proxy-derived sea surface temperature
3.2 Model simulations 4.1 Sea surface temperature in the Labrador Sea
The simulations were performed using the coupled climate Our Site 647 TEX86 -derived record shows high and rela-
model GFDL CM2.1 (Delworth et al., 2006) adapted to tively stable SSTs (∼ 27 ◦ C) in the southern Labrador Sea
late Eocene (∼ 38 Ma) boundary conditions, as outlined in from ca. 38 up to 35.5 Ma (Figs. 2 and 3). Between ∼ 35.5
Hutchinson et al. (2018). The model uses an ocean resolu- and 34.9 Ma SSTs increased by ∼ 1.5 ◦ C. Subsequently, be-
tion of 1◦ × 1.5◦ × 50 levels and an atmosphere resolution of tween ∼ 34.9 Ma and ∼ 34.3 Ma, SSTs decreased by ∼ 3–
3◦ × 3.75◦ × 24 levels. The resolution of our model is in line 4 ◦ C, i.e. from 27 to 23–24 ◦ C, depending on the TEX86 cal-
with the most recent set of EOT climate models (e.g. Baatsen ibration (Fig. S2; the surface water cooling is reduced by
et al., 2020; Tardif et al., 2020), which allows better repre- ∼ 1 ◦ C when using TEXH 86 calibration). Between 34.3 and
sentation of ocean gateways than the preceding generation of 33 Ma, which includes the EOT interval, SSTs remained rel-
EOT models. The model was run at two end-member CO2 atively stable (Fig. 2). Long chain alkenones, on which the
levels of 400 and 800 ppm and spun up for 6500 years us- U37K 0 index is based, did not appear at Site 647 before ∼
ing an iterative coupling procedure, with the last 3200 years 33 Ma (Fig. 2). This fits with the observations that alkenones
run in fully coupled mode (Hutchinson et al., 2018). These in distributions similar to those of modern-day producers
experiments were carried out using modern-day orbital forc- first appeared in the global sedimentary record around the
ing parameters. In the control configuration, the palaeogeog- EOT is, most likely triggered by the climate-driven changes
raphy includes shallowly open ocean gateways between the (Brassell, 2014). Nevertheless, once alkenones appear at Site
Arctic and Norwegian–Greenland Sea as they likely existed 647, mean SST values derived from both U37 K 0 and TEX
86
for some part of the late Eocene (Lasabuda et al., 2018; are within the same range (Fig. S1), adding confidence in
https://doi.org/10.5194/cp-19-123-2023 Clim. Past, 19, 123–140, 2023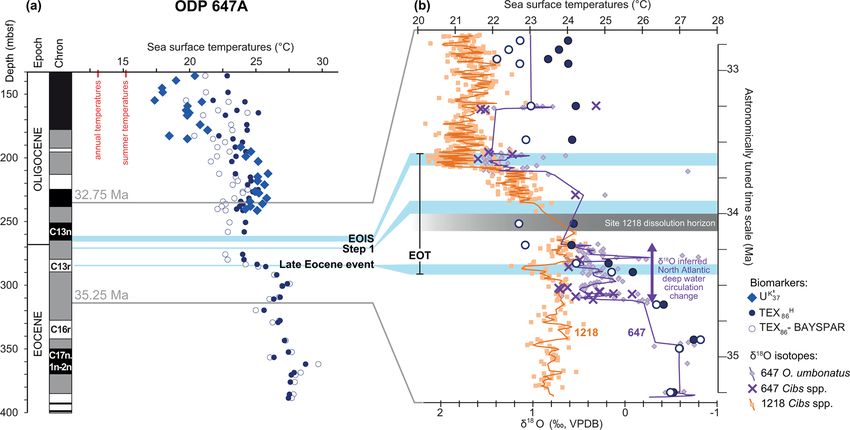
130                                      K. K. Śliwińska et al.: Sea surface temperature evolution of the North Atlantic Ocean

                                                                     scope of the present study. Notably, at the older SST mini-
                                                                     mum (depth ca. 183 m b.s.f.; Fig. S2) U37   K 0 -derived SST be-

                                                                     comes significantly colder than TEX86 -derived SST. Poten-
                                                                     tially, this may be because the surface conditions, reflected
                                                                     by the U37K 0 , changed more substantially than subsurface tem-

                                                                     peratures, which will affect TEX86 to a larger extent. Alter-
                                                                     natively, it could indicate that there were shifts in seasonal
                                                                     impacts on the proxies.
                                                                        Overall, TEXH    86 -derived SST shows a distinctive cooling
                                                                     step of ∼ 3–4 ◦ C at Site 647, when comparing the warmer
                                                                     Eocene (SST between 29 and 25.5 ◦ C, interval from ∼ 38
                                                                     to 35.5 Ma) with the colder Oligocene (SST below 25 ◦ C,
                                                                     interval from ∼ 34 to ∼ 26.5 Ma) (Fig. 2). Notably, most
                                                                     published SST data from the Atlantic Ocean (all shown in
                                                                     Fig. 3) are of (much) lower resolution and only bracket
                                                                     the main cooling and ice-growth events associated with the
                                                                     EOT. Our study provides the highest-resolution, long-term
                                                                     SST record from the North Atlantic region across the late
                                                                     Eocene to date. It uniquely pinpoints the high northern lat-
                                                                     itude changes during the main climatic transitions and the
                                                                     critical lead-up period by identifying a cooling in the south-
                                                                     ern Labrador Sea between 34.9 and 34.3 Ma, approximately
                                                                     500 kyr prior to the Step 1 event (Fig. 2a), possibly related to
                                                                     the late Eocene event. This temperature decrease falls within
                                                                     the reconstructed range in the North Atlantic region, with a
                                                                     larger cooling across the EOT at Sites 336, 913, and Kysing-
                                                                     4 (north of Site 647) and a somewhat smaller SST decrease
                                                                     at Site U1404 (south of Site 647) (Fig. 3).
                                                                        Our SST record at Site 647 does not cover the Step 1
                                                                     or EOIS events in detail (Fig. 2), but similar to the record
                                                                     from Site U1404 on the Newfoundland margin (Liu et al.,
                                                                     2018), these events do not appear to be associated with any
                                                                     prolonged surface temperature decrease. The surface cool-
                                                                     ing in the Labrador Sea that predates the Step 1 phase
                                                                     (Fig. 2) agrees with a variety of other, more coarsely resolved
Figure 5. Time series of the North Pacific meridional overturning    Northern Hemisphere proxy reconstructions. These data in-
circulation (MOC) index (a), the North Atlantic MOC index (b),
                                                                     clude, for example, dust records from central Asia (Abels et
and the SST averaged over a 5◦ × 5◦ box around Core Site 647 in
the four model simulations.
                                                                     al., 2011; Sun and Windley, 2015), which indicate that the
                                                                     strongest cooling and continental aridification occurred be-
                                                                     tween 35 and 34 Ma, respectively. Lastly, this cooling (the
                                                                     late Eocene event) is detected in several deep-sea records
the absolute temperatures that we reconstruct. Both organic          (e.g. ODP Site 689 in the Atlantic sector of the Southern
proxy temperature estimates are substantially higher than            Ocean) as a transient ∼ 0.5 ‰ excursion in δ 18 O, and it
present-day values (5–10 ◦ C) (Fig. 2a) and in good accor-           probably coincides with a so-called “precursor glaciation”
dance with available time-equivalent SST reconstructions for         on Antarctica (Katz et al., 2008; Hutchinson et al., 2021)
the region (Fig. 3). Overall, both palaeothermometers sug-           interpreted to be driven by 405 and ∼ 110 kyr eccentricity
gest Oligocene SST (interval from ∼ 34 to ∼ 26.5 Ma) below           minima (Fig. S3). Based on these lines of evidence, we infer
26 ◦ C (Figs. 2 and S2), with two temperature minima. How-           that the late Eocene event had an impact on several glob-
ever, with the existing uncertainties in the age model for this      ally distributed locations. However, the Atlantic sector of the
interval (i.e. depth from 190 to 130 m b.s.f.; Firth et al., 2013)   Southern Ocean experienced only a transient cooling of bot-
it is challenging to link the SST minima with the cooling            tom and surface waters of ∼ 1 ◦ C at that time (Bohaty et al.,
episodes from the Oligocene (e.g. Wade and Pälike, 2004).            2012), whereas our data suggest that during the late Eocene
This could potentially be improved by a detailed analysis of         event surface temperatures in the vicinity of Site 647 experi-
dinocysts (e.g. Śliwińska et al., 2010; Śliwińska, 2019; Śli-   enced a distinctive cooling step.
wińska and Heilmann-Clausen, 2011), but it is outside the

Clim. Past, 19, 123–140, 2023                                                            https://doi.org/10.5194/cp-19-123-2023
K. K. Śliwińska et al.: Sea surface temperature evolution of the North Atlantic Ocean 131
4.2 Sea surface temperature in the North Atlantic et al., 2016; Zhang et al., 2013). However, this is probably
across the EOT not the main reason for high-latitude warmth in the records
compared to the model because (i) it is unlikely that the
The still low resolution of SST data across the EOT in the PCOatm was much more than 1000 ppm in the late Eocene (Fig
North Atlantic, compared to time-equivalent benthic δ 18 O 2
3a), and (ii) higher CO2 concentration also implies some-
records, do not allow for any detailed analysis of the chang- what higher low-latitude temperatures which are not under-
ing spatial or temporal SST patterns in the North Atlantic or estimated in the current model simulations. Alternatively, it
identification of sequential forcing mechanisms or leads or may be that the TEX86 -derived SST data are warmer than
lags that could explain them. For example, at sites 336 and the model output because they represent a summer signal.
Kysing-4, where the data density is high (∼ 35.8 Ma), the Several studies of TEX86 -derived SSTs of the Eocene green-
SST data have a large range in a short interval, suggesting house state suggest the possibility of a summer bias at higher
these are highly dynamic regions and more so than Site 647A latitudes (e.g. Davies et al., 2019; Hollis et al., 2012), and
(Fig. 3). At other sites like 913 there are only six data points the summer SSTs are indeed a better match for the proxy
between 37 and 32 Ma, making it impossible to identify tem- data (Fig. S4). While some degree of seasonal bias cannot
poral patterns or attribute them to internal or external vari- be ruled out, the overall trends and absolute SST estimates
ability. However, we combine the available core data in an from the TEX86 proxy in our record correspond well with
ensemble to derive an overarching picture of cooling across K 0 (Fig. S2). The U K 0 proxy is derived from hap-
those of U37 37
the 5 Myr bracketing the EOT in the North Atlantic (from 37 tophyte algae, which generally have different bloom peri-
to 32 Ma; Fig. 3). Specifically, we calculate the average tem- ods than Thaumarchaeota and are thought to reflect annual
perature values from 37.0 to 34.5 Ma (“pre-34.5” interval) mean or spring SST (Müller et al., 1998). This argues at least
and from 34.5 to 32.0 Ma (“post-34.5” interval) in all existing against a strong seasonal bias in the U37 K 0 or TEX records.
86
SST records in the North Atlantic region (Śliwińska, 2022). Alternatively, the model has too-cold high-latitude tempera-
The threshold of 34.5 Ma is chosen because that is where the tures either because of too-low climate sensitivity to CO2 or
shift towards colder temperatures at Site 647 is recorded. We insufficient polar amplification due to inadequate cloud feed-
present the SST temperatures in these two intervals as a func- backs (Baatsen et al., 2020; Lunt et al., 2021). The simulation
tion of latitude and note that the higher-latitude cores are on with the higher 800 ppm CO2 and the closed Arctic (with ac-
average colder than lower-latitude cores, as one might expect tive AMOC) gives the warmest absolute temperature in the
(Fig. 4). The cooling across the EOT indicates polar amplifi- North Atlantic and is therefore the closest to proxy records
cation with stronger cooling at the poleward sites such as 913 both for the late Eocene (37 to 34.5 Ma) and early Oligocene
and 336 (Fig. 4), although we emphasise the high uncertainty (34.5 to 32 Ma) intervals (dashed red line in Figs. 5 and 6d).
in averaging so few data points in these records.
5.2 Sea surface temperature change across the EOT in
5 Data–model comparison and implications the North Atlantic
5.1 Absolute sea surface temperature values in the As detailed above, the EOT cooling is usually attributed to
North Atlantic between 37 and 32 Ma a decrease in atmospheric CO2 (see summary in Hutchinson
et al., 2021). Numerous studies have suggested that accel-
Here we compare the late Eocene (37 to 34.5 Ma) and early erated CO2 decline may have been triggered by the start-up
Oligocene (34.5 to 32 Ma) SST at the five North Atlantic core of the AMOC at or just prior to the EOT. The Arctic-open
sites to the four combinations of an open and closed Arc- and Arctic-closed simulations shown here are part of one
tic and 400 and 800 ppm atmospheric CO2 concentrations such study in which the North Atlantic deep-water forma-
as described in Hutchinson et al. (2018, 2019). The selected tion is activated through closing the ocean gateways across
time frame from 37 to 32 Ma covers the most complete data- the Nordic Seas transporting low-salinity Arctic waters to the
derived SST evolution from all selected sites (Fig. 3). Most Atlantic Ocean. It results in salinification and densification
of the simulations do a reasonable job at matching proxy of surface waters (Hutchinson et al., 2019). The AMOC is
SSTs at lower latitudes, but none of the simulations can pro- known to transport heat northward in the modern Atlantic,
duce the warm proxy-derived SSTs in the northern North At- and a freshwater-induced AMOC collapse in a modern cli-
lantic during the late Eocene (Figs. 4 and 6), suggesting that mate state leads to cooler North Atlantic SSTs (Jackson et
the model has too-low high-latitude temperatures for the late al., 2015). In our EOT simulations a start-up of the AMOC
Eocene. There may be several possible explanations for this. through closing the connection to the Arctic is associated
The applied CO2 concentration of 800 ppm may still be too with a >5 ◦ C temperature increase in some locations of the
low for the late Eocene. The existing PCOatm reconstructions Nordic Seas (Fig. 7a, b), suggesting a similar role for the
2
across the EOT are of low resolution and are characterised AMOC in northward heat transport during this period. Some
by a large range of absolute values and relatively high levels of the warming could also be due to reduced heat transport
of uncertainty (c.f. Anagnostou et al., 2016; Steinthorsdottir to the Arctic in the closed-Atlantic–Arctic-Gateway scenario.
https://doi.org/10.5194/cp-19-123-2023 Clim. Past, 19, 123–140, 2023132 K. K. Śliwińska et al.: Sea surface temperature evolution of the North Atlantic Ocean
Figure 6. Comparison of model temperatures in the four simulations in the North Atlantic with late Eocene (circles; 37–34.5 Ma) and early
Oligocene (squares; 34.5–32 Ma) proxy data (SST derived from U37 K 0 at sites 913, 336, and U1404 and SST derived from TEXH at sites
86
Kysing-4 and 647). Contours show the modelled annual mean SST for the Arctic-open (a, c) and the Arctic-closed run (b, d) for atmospheric
CO2 concentrations of 400 ppm (a, b) and 800 ppm (c, d). The coloured circles show the proxy data averaged between 34.5 and 37 Ma (late
Eocene), and the coloured squares show the proxy data averaged between 34.5 and 32 Ma (early Oligocene). For all sites, the average SST
proxy records and the modelled SST for each of the four climate scenarios are shown also in Fig. 4 and Fig. S5 and in Śliwińska (2022).
The warming from the AMOC start-up is greater in the colder cannot be concluded for certain that the reduction recorded
400 ppm climate than the warmer 800 ppm climate, but this by the proxies would be matched by the model simulations.
could be simply because the 400 ppm Arctic-closed simula- To complicate matters, at the higher northern latitudes, where
tion is further from equilibrium than the other simulations, temperature anomalies in both simulations and proxy recon-
with the AMOC still weakening and the SST at the core site structions are largest, the data are also the sparsest (Fig. 4).
still cooling at the time of analysis. The cooling from a re- Nevertheless, a real data–model mismatch should be consid-
duction in atmospheric CO2 is of similar magnitude to the ered and explanations for it explored. The first possibility is
AMOC warming, albeit slightly weaker and with a differ- that the AMOC did not start up at or just prior to the EOT but
ent spatial pattern, reaching further south into the subtropical had started earlier, e.g. in the middle Eocene (Boyle et al.,
gyre (Fig. 7c, d). This cooling trend is stronger when the con- 2017; Vahlenkamp et al., 2018), and intensified 500 kyr prior
nection to the Arctic is open and the AMOC is off, but again, to the EOT (Coxall et al., 2018). The change in heat transport
this could be because the Arctic-closed 400 ppm case has not from AMOC strengthening should be weaker than from a
cooled to equilibrium yet. complete cold start-up. Alternatively, the changes in the Arc-
To investigate whether greenhouse cooling could com- tic Gateway’s bathymetry could have been subtler in reality
pensate for AMOC warming at the EOT, we compare the than in the model. This would dampen the impact on the cir-
800 ppm Arctic-open simulation with the 400 ppm Arctic- culation and SST, or the AMOC may have started up through
closed simulation (Fig. 7e). While we observe an overall an altogether different mechanism such as the widening of
cooling in the Arctic and subtropical gyre, there is hetero- the Southern Ocean gateways (Elsworth et al., 2017), which
geneity with the subpolar gyre remaining warm. While this could have a smaller warming effect. This latter process of
could be due to the 400 ppm Arctic-closed simulation still starting up the AMOC did not work in the modelling study
cooling at this point in the analysis, without a longer run it of Hutchinson et al. (2019), but such results can be model-
Clim. Past, 19, 123–140, 2023 https://doi.org/10.5194/cp-19-123-2023K. K. Śliwińska et al.: Sea surface temperature evolution of the North Atlantic Ocean 133
0
K at sites 913, 336, and U1404 and SST derived
Figure 7. Site-specific SST anomalies across the EOT from proxy data (SST derived from U37
from TEXH 86 at sites Kysing-4 and 647) compared with SST differences between the model simulations. Shown is the SST impact of closing
of the Arctic for a 400 ppm climate (a) and an 800 ppm climate (b) as well as the impact of reducing CO2 from 800 to 400 ppm when the
Arctic is open (c) and when it is closed (d). The final subplot shows the difference between the 800 ppm open Arctic and the 400 ppm closed
Arctic (e). The coloured circles show the SST change (1SST) for each site across the EOT as suggested by the proxy data records. 1SST is
calculated as the difference between the pre-34.5 Ma (late Eocene) SST average and the post-34.5 Ma (early Oligocene) SST average (Fig. S5
and Śliwińska, 2022).
dependent and require corroboration. There are also model or directly after the EOT (Cramwinckel et al., 2020; Coxall
deficiencies that could explain the overall North Atlantic et al., 2018). The model AMOC therefore feeds deep water
warming, such as the above-mentioned exaggerated merid- from two regions instead of one and thus could be too strong.
ional temperature gradient in the model at the EOT (causing Another possibility is that the CO2 decline at the EOT was
too much heat transport through the AMOC) and too-low cli- greater than suggested by existing proxy records (e.g. Anag-
mate sensitivity to the CO2 decrease. Another point to men- nostou et al., 2016; Zhang et al., 2013), in which case CO2 -
tion is that the model produces deep water in the Labrador related climatic cooling at northern high latitudes at the EOT
Sea and the Greenland Sea when the Arctic is closed off could have been more extreme than currently assumed. How-
(Hutchinson et al., 2019). Yet there is no evidence in Site 647 ever, while it is reasonable to assume that the pre-EOT CO2
records for deep-water formation in the Labrador Sea before was higher than 800 ppm, there is little evidence that it may
https://doi.org/10.5194/cp-19-123-2023 Clim. Past, 19, 123–140, 2023134 K. K. Śliwińska et al.: Sea surface temperature evolution of the North Atlantic Ocean
Figure 8. Barotropic streamfunctions illustrating the horizontal circulation (positive = clockwise) for the Arctic-open (a, c) and the Arctic-
closed run (b, d) for atmospheric CO2 concentrations of 400 ppm (a, b) and 800 ppm (c, d). The contour interval is 2 Sv. Note the modified
and intensified subtropical and subpolar gyre systems in the Arctic-closed experiment and the critical position of Site 647 at their boundaries.
have been as low as 400 ppm after the EOT (Fig. 3a). These SST records from the eastern and western sections of the
explanations remain speculative and require further investi- North Atlantic and Nordic Seas spanning the late Eocene
gation in a modelling-focused study. would be desirable to fully address this hypothesis.
Today Site 647 is located in the south-western part of
the North Atlantic subpolar gyre, influenced by cold and
5.3 Sea surface temperature variability across the EOT low-salinity subarctic surface waters. The barotropic stream-
at Site 647 function in the model, a combination of the wind-driven
gyre transport and the meridional overturning streamfunc-
With its higher temporal resolution compared to other North tion, suggests that at the EOT the site was in or near the
Atlantic records at the time, it is interesting to note some tem- boundary of the subtropical gyre and the subpolar gyre and
poral signals in the SST at Site 647 across the late Eocene. that this region was highly dynamic (Fig. 8). The horizonal
In particular, our data suggest that there may be a tempera- circulation in this region changes dramatically when the Arc-
ture minimum at ∼ 35.7 Ma and a maximum at ∼ 34.9 Ma, tic closes and the AMOC starts up, with the streamfunction-
followed by the cooling step (Fig. 3). The SST variability derived subtropical gyre reaching more northward into the
described at Site 647 is well resolved, even though the mini- Labrador Sea and the subpolar gyre moving closer to the
mum and the maximum are based on one or few data points. western boundary (Figs. 1 and 8). The result is a switch of
The late Eocene SST at Site 647 seems reasonably stable, the mean current direction at the site location from north-
considering that data points that are close together in time eastward to south-eastward. The North Atlantic warming as-
have similar SSTs (Fig. 3). The increase in SST between sociated with the closing of the Arctic broadly outlines the
35.7 and 34.9 Ma could possibly be due to an increase in subpolar gyre boundary of the open cases, and it has a strong
the AMOC, culminating at 34.9 Ma (Coxall et al., 2018). gradient at Site 647 so that if the site were just a few degrees
Thereafter, normal background CO2 cooling could have re- to the south (or arguably the gyre to the north) it would ex-
sumed. A peak in SST was also present during this time at perience much less warming and might even have 1 or 2 ◦ C
low-latitude Atlantic Site 959 (Cramwinckel et al., 2018) and of cooling when taking into account the expected CO2 cool-
in the North Sea (Śliwińska et al., 2019). Other Atlantic SST ing at the EOT (Fig. 7a, b). The position and strength of the
records are of insufficient resolution to study this type of vari- gyres, as well as the strength of the AMOC, are likely model-
ability, so this point remains speculative. Higher-resolution
Clim. Past, 19, 123–140, 2023 https://doi.org/10.5194/cp-19-123-2023K. K. Śliwińska et al.: Sea surface temperature evolution of the North Atlantic Ocean 135
dependent and should not be taken too literally. However, possible that the AMOC did not start up in the late Eocene,
suffice to say that they depend critically on the palaeogeogra- but alternative explanations are then required for the deep-
phy of the region, which was dynamic at the time (Hutchin- ocean proxies that suggest this (Coxall et al., 2018; Hutchin-
son et al., 2019). Even a globally homogenous forcing factor son et al., 2021). Also, if the EOT cooling was driven by
such as CO2 results, through regional feedbacks, in heteroge- stand-alone CO2 changes, the question remains as to why
nous changes in the North Atlantic SST (Fig. 7). there was a sharp deep-ocean cooling step before the Antarc-
tic ice-sheet growth (Lear et al., 2008). Other possibilities are
(i) that the AMOC started up earlier and just intensified at the
6 Conclusions EOT, (ii) that the model is overestimating the AMOC heat
transport due to too-warm high-latitude temperature at the
Our new SST record derived from organic geochemical Eocene, (iii) that the CO2 decrease is larger than modelled
palaeothermometers provides the highest resolution of SST here, or (iv) that the model has too-low sensitivity to CO2
across the EOT in the northern North Atlantic to date. Our cooling. It should be noted that the model time slices present
SST record shows variability in the 2.5 Myr leading up to only a few possible scenarios, of which none were probably
the EOT, which includes an ∼ 800 kyr warming interval be- an exact reality at any point. The pre- and post-EOT world
fore the final cooling step, which took place ∼ 500 kyr before would not correspond to any single scenario but would be
the EOT. Model simulations of various possible palaeogeo- a dynamic time of variable palaeogeography and CO2 . It is
graphic and atmospheric CO2 scenarios at the time indicate also worth emphasising again the model dependence of these
that the site is located in a dynamic region close to the sub- results, as the ocean circulation and stratification vary greatly
tropical and subpolar gyre boundary. Atmospheric CO2 or between models of the Eocene, even when forced with a sim-
palaeogeographic changes would change the gyre location, ilar set of boundary conditions (Zhang et al., 2022).
strength, and structure. It could even change the direction Our new data aid in understanding of the timing and the
of the mean current at the site, influencing the local SST. spatial pattern of temperature changes related to the tran-
Whatever the driver, our model suggests that there is usually sition into the unipolar icehouse climate state. The model
some coherence in the North Atlantic SST response across simulations highlight the heterogeneity of North Atlantic
the subpolar gyre and separately the subtropical gyre, but in SST and its response to different forcing factors. This calls
general the response is heterogeneous across the North At- for more proxy records to increase the spatial coverage and
lantic. Any extrapolation of ocean warming or cooling at a resolution of regional temperature trends across the North
specific site location to the wider Atlantic and global climate Atlantic in order to identify possible thermohaline finger-
drivers should therefore be done with care. prints of the AMOC start-up at the EOT. For areas located
In order to compare the SST changes across the EOT with south of Site 647 and Kysing-4 this could include con-
other North Atlantic lower-resolution records, the SST was struction of eastern–western Atlantic surface and deep-water
averaged over a late Eocene bin spanning the 2.5 Myr be- δ 18 O and temperature gradients using multiple palaeotem-
fore the 34.5 Ma cooling step at Site 647 (37–34.5 Ma) and perature proxy methods (e.g. clumped isotopes, foraminiferal
the early Oligocene bin spanning the 2.5 Myr after this step Mg / Ca, or TEX86 ). For the higher northern latitudes, where
(34.5–32 Ma). In this basin-wide view, the cooling at the calcareous microfossils fossils are very limited in this time
EOT is found to be larger at higher latitudes, although this interval, this could include higher-resolution SST proxy re-
is also where data are particularly sparse. The binned data construction based on TEX86 and/or U37 K 0 . Despite the ex-
were compared to four model simulations of EOT scenarios isting hiatuses at the Eocene–Oligocene boundary interval
with high (800 ppm) and low (400 ppm) atmospheric CO2 , in the North Atlantic region, increasing sampling resolution
and open and closed Arctic–Atlantic Gateway, also repre- at the existing sites in the interval from 37 to 32 Ma would
senting AMOC-off and AMOC-on scenarios, respectively. be beneficial. A formal model intercomparison project (e.g.
The cooling across the EOT is best simulated with a drop in EOT-MIP) to compare the response in a variety of different
CO2 alone. However, several deep-ocean circulation proxies EOT models would increase our confidence of the ocean and
suggest that the AMOC started up just prior to the EOT (Cox- climate system’s response to proposed drivers of the EOT and
all et al., 2018), and our model simulations indicate that if thus facilitate more robust model–data intercomparisons.
the AMOC starts up (through Arctic closure in our case), the
CO2 cooling is approximately countered by warming from
the increased heat transport. However, several caveats need Data availability. The supplementary information is available
to be raised when making such a comparison. Our AMOC- in the Supplement, and raw data (Supplement) are available
on 400 ppm simulation is still cooling, and it is not possible at https://doi.org/10.22008/FK2/FW9WFV (Śliwińska, 2022). The
to know the final SST state. But suffice to say, the final state model data used in this analysis will be made available upon pub-
lication in an open-access database hosted by the Bolin Centre
would be cooler than the one shown here, especially in the
for Climate Research (https://doi.org/10.17043/hutchinson-2022-
high-latitude regions that are sensitive to the AMOC, which
eocene-oligocene-1; Hutchinson and de Boer, 2022).
is still decreasing rapidly at the time of the analysis. It is
https://doi.org/10.5194/cp-19-123-2023 Clim. Past, 19, 123–140, 2023136 K. K. Śliwińska et al.: Sea surface temperature evolution of the North Atlantic Ocean
Supplement. The supplement related to this article is available Review statement. This paper was edited by Bjørg Rise-
online at: https://doi.org/10.5194/cp-19-123-2023-supplement. brobakken and reviewed by Michiel Baatsen and one anonymous
referee.
Author contributions. KKŚ designed the research. KKŚ and SS
0
K ) data. HKC
generated organic geochemical proxy (TEX86 , U37
helped to produce the Site 647 age model and correlate with IODP
Site 1218. DKH ran all model simulations. KKŚ and AMdB were References
the main authors of the paper, although all authors contributed with
data interpretation and writing. Abels, H. A., Dupont-Nivet, G., Xiao, G., Bosboom, R., and Krijgs-
man, W.: Step-wise change of Asian interior climate preceding
the Eocene-Oligocene Transition (EOT), Palaeogeogr. Palaeocl.,
299, 399–412, https://doi.org/10.1016/j.palaeo.2010.11.028,
Competing interests. The contact author has declared that none
2011.
of the authors has any competing interests.
Anagnostou, E., John, E. H., Edgar, K. M., Foster, G. L., Ridg-
well, A., Inglis, G. N., Pancost, R. D., Lunt, D. J., and Pear-
son, P. N.: Changing atmospheric CO2 concentration was the
Disclaimer. Publisher’s note: Copernicus Publications remains primary driver of early Cenozoic climate, Nature, 533, 380–384,
neutral with regard to jurisdictional claims in published maps and https://doi.org/10.1038/nature17423, 2016.
institutional affiliations. Arthur, M. A., Srivastava, S. P., Kaminski, M., Jarrard,
R., and Osler, J.: Seismic Stratigraphy and History of
Deep Circulation and Sediment Drift Development in Baf-
Acknowledgements. This research was funded by a Danish fin Bay and the Labrador Sea, in: Proceedings of the
Council for Independent Research/Natural Sciences (DFF/FNU) Ocean Drilling Program, 105 Scientific Results, 957–988,
grant (grant 11-107497) to Kasia K. Śliwińska; Swedish Research https://doi.org/10.2973/odp.proc.sr.105.118.1989, 1989.
Council (VR) grants awarded to Agatha M. de Boer (2016-03912 Baatsen, M., von der Heydt, A. S., Huber, M., Kliphuis, M. A., Bijl,
and 2020-04791) and Helen K. Coxall (2008-2859); a Formas P. K., Sluijs, A., and Dijkstra, H. A.: The middle to late Eocene
grant (2018-01621) and an Australian Research Council grant greenhouse climate modelled using the CESM 1.0.5, Clim. Past,
(DE220100279) to David K. Hutchinson; and a Netherlands Earth 16, 2573–2597, https://doi.org/10.5194/cp-16-2573-2020, 2020.
System Science Centre (NESSC) grant funded by the Ministry Bernard, T., Steer, P., Gallagher, K., Szulc, A., Whitham, A., and
of Education, Culture and Science (OCW) to Stefan Schouten. Johnson, C.: Evidence for Eocene-Oligocene glaciation in the
The model simulations were enabled by resources provided by landscape of the East Greenland margin, Geology, 44, 895–898,
the Swedish National Infrastructure for Computing (SNIC) at the https://doi.org/10.1130/G38248.1, 2016.
National Supercomputer Centre (NSC), partially funded by the de Boer, A. M., Toggweiler, J. R., and Sigman, D.
Swedish Research Council through grant agreement no. 2018- M.: Atlantic Dominance of the Meridional Overturn-
05973. We thank Walter Hale at Bremen Core Repository (BCR) for ing Circulation, J. Phys. Oceanogr., 38, 435–450,
collecting samples. We appreciate inspiring discussions with John https://doi.org/10.1175/2007JPO3731.1, 2008.
Firth and Jan Backman and laboratory assistance from Anchelique Bohaty, S. M., Zachos, J. C., and Delaney, M. L.: Foraminiferal
Metz. This research used samples provided by the Ocean Drilling Mg / Ca evidence for Southern Ocean cooling across the Eocene-
Project (ODP). ODP was sponsored by the US National Science Oligocene transition, Earth Planet. Sci. Lett., 317–318, 251–261,
Foundation and participating countries under the management of https://doi.org/10.1016/j.epsl.2011.11.037, 2012.
Joint Oceanographic Institutions. We would like to acknowledge Borrelli, C., Cramer, B. S., and Katz, M. E.: Bipolar Atlantic deep-
the editor Bjørg Risebrobakken and all reviewers for their time and water circulation in the middle-late Eocene: Effects of South-
valuable comments, which helped to improve this paper. ern Ocean gateway openings, Paleoceanography, 29, 308–327,
https://doi.org/10.1002/2012PA002444, 2014.
Borrelli, C., Katz, M. E., and Toggweiler, J. R.: Middle to
Financial support. This research has been supported by the Late Eocene Changes of the Ocean Carbonate Cycle, Pa-
Natur og Univers, Det Frie Forskningsråd (grant no. 11-107497); leoceanography and Paleoclimatology, 36, e2020PA004168,
the Svenska Vetenskapsrådet (grant nos. 2016-03912, 2020-04791, https://doi.org/10.1029/2020PA004168, 2021.
2018-05973, and 2008-2859); the Svenska Forskningsrådet Formas Boyer, T. P., Antonov, J. I., Baranova, O. K., Garcia, H. E., John-
(grant no. 2018-01621); the Australian Research Council grant son, D. R., Mishonov, A. V., O’Brien, T. D., Seidov, D., I. (Igor),
(DE220100279); the Netherlands Earth System Science Centre S., Zweng, M. M., Paver, C. R., Locarnini, R. A., Reagan, J.
(grant no. 024.002.001); and the Ministerie van Onderwijs, Cultuur R., Coleman, C., and Grodsky, A.: World ocean database 2013,
en Wetenschap (grant no. 024.002.001). NOAA Atlas NESDIS 72, https://doi.org/10.7289/V5NZ85MT,
2013.
The article processing charges for this open-access Boyle, P. R., Romans, B. W., Tucholke, B. E., Norris, R.
publication were covered by Stockholm University. D., Swift, S. A., and Sexton, P. F.: Cenozoic North At-
lantic deep circulation history recorded in contourite drifts,
offshore Newfoundland, Canada, Mar. Geol., 385, 185–203,
https://doi.org/10.1016/j.margeo.2016.12.014, 2017.
Clim. Past, 19, 123–140, 2023 https://doi.org/10.5194/cp-19-123-2023You can also read