SCIENTIFIC OPINION - EFSA
←
→
Page content transcription
If your browser does not render page correctly, please read the page content below
SCIENTIFIC OPINION

ADOPTED: 22 September 2021

Assessment of animal diseases caused by bacteria resistant
                 to antimicrobials: cattle
                        EFSA Panel on Animal Health and Welfare (AHAW),
      Søren Saxmose Nielsen, Dominique Joseph Bicout, Paolo Calistri, Elisabetta Canali,
               Julian Ashley Drewe, Bruno Garin-Bastuji, Jose Luis Gonzales Rojas,
   Christian Gortazar Schmidt, Mette Herskin, Virginie Michel, Miguel Angel Miranda Chueca,
       Barbara Padalino, Paolo Pasquali, Helen Clare Roberts, Hans Spoolder, Karl Stahl,
     Antonio Velarde, Arvo Viltrop, Christoph Winckler, Jeroen Dewulf, Luca Guardabassi,
            Friederike Hilbert, Rodolphe Mader, Francesca Baldinelli and Julio Alvarez

Abstract
In this opinion, the antimicrobial resistant bacteria responsible for transmissible diseases that
constitute a threat to the health of cattle have been assessed. The assessment has been performed
following a methodology based on information collected by an extensive literature review and expert
judgement. Details of the methodology used for this assessment are explained in a separate opinion. A
global state of play on antimicrobial resistance in clinical isolates of Escherichia coli (non-VTEC),
Klebsiella pneumoniae, Staphylococcus aureus, Streptococcus uberis, Streptococcus dysgalactiae,
Pasteurella multocida, Mannheimia haemolytica, Histophilus somni, Mycoplasma bovis, Moraxella bovis,
Fusobacterium necrophorum and Trueperella pyogenes is provided. Among those bacteria, EFSA
identified E. coli and S. aureus with ≥ 66% certainty as being the most relevant antimicrobial resistant
bacteria in cattle in the EU based on the available evidence. The animal health impact of these most
relevant bacteria, as well as their eligibility for being listed and categorised within the animal health
law framework will be assessed in separate scientific opinions.
© 2021 European Food Safety Authority. EFSA Journal published by John Wiley and Sons Ltd on behalf
of European Food Safety Authority.

Keywords: antimicrobial resistance, animal health law, extensive literature review, cattle

Requestor: European Commission
Question number: EFSA-Q-2021-00576
Correspondence: alpha@efsa.europa.eu

www.efsa.europa.eu/efsajournal
Assessment of animal diseases caused by bacteria resistant to antimicrobials: cattle

Panel members: Søren Saxmose Nielsen, Julio Alvarez, Dominique Joseph Bicout, Paolo Calistri,
Elisabetta Canali, Julian Ashley Drewe, Bruno Garin-Bastuji, Jose Luis Gonzales Rojas, Christian
Gortazar Schmidt, Mette Herskin, Virginie Michel, Miguel Angel Miranda Chueca, Barbara Padalino,
Paolo Pasquali, Helen Clare Roberts, Hans Spoolder, Karl Stahl, Antonio Velarde, Arvo Viltrop and
Christoph Winckler.
Declarations of interest: The declarations of interest of all scientific experts active in EFSA’s work
are available at https://ess.efsa.europa.eu/doi/doiweb/doisearch.
Acknowledgements: The AHAW Panel wishes to thank Peter Damborg, Carmen Espinosa-Gongora,
Steffen Lynge Jørgensen from the University of Copenhagen for conducting the extensive literature
review under the contract OC/EFSA/ALPHA/2020/02 – LOT 1; Alberto Antoine Dıez Guerrier from
University Complutense Madrid, Raphael Guatteo from Oniris, Bart Pardon from Ghent University and
Verena Oswaldi from EFSA for the support provided for this scientific output.
Suggested citation: EFSA AHAW Panel (EFSA Panel on Animal Health and Welfare), Nielsen SS,
Bicout DJ, Calistri P, Canali E, Drewe JA, Garin-Bastuji B, Gonzales Rojas JL, Gortazar Schmidt C,
Herskin M, Michel V, Miranda Chueca MA, Padalino B, Pasquali P, Roberts HC, Spoolder H, Stahl K,
Velarde A, Viltrop A, Winckler C, Dewulf J, Guardabassi L, Hilbert F, Mader R, Baldinelli F and Alvarez J,
2021. Scientific Opinion on the assessment of animal diseases caused by bacteria resistant to
antimicrobials: cattle.
ISSN: 1831-4732
© 2021 European Food Safety Authority. EFSA Journal published by John Wiley and Sons Ltd on behalf
of European Food Safety Authority.
This is an open access article under the terms of the Creative Commons Attribution-NoDerivs License,
which permits use and distribution in any medium, provided the original work is properly cited and no
modifications or adaptations are made.

                                 The EFSA Journal is a publication of the European Food Safety
                                 Authority, a European agency funded by the European Union.

www.efsa.europa.eu/efsajournal                             2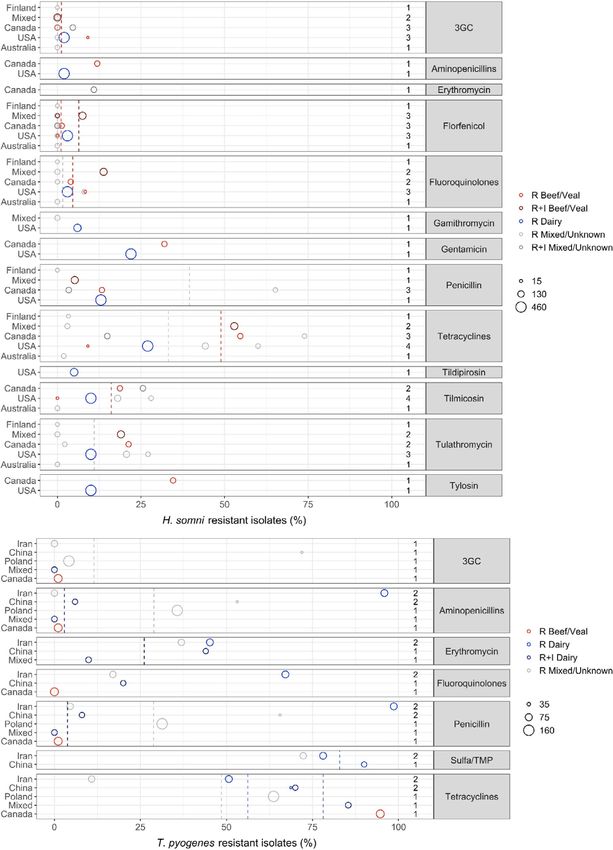
Assessment of animal diseases caused by bacteria resistant to antimicrobials: cattle
Table of contents
Abstract................................................................................................................................................... 1
1. Introduction............................................................................................................................... 4
1.1. Background and Terms of Reference as provided by the requestor................................................. 4
1.2. Interpretation of the Terms of Reference...................................................................................... 4
2. Data and methodologies ............................................................................................................. 4
2.1. Extensive literature review .......................................................................................................... 4
3. Assessment................................................................................................................................ 6
3.1. ToR 1: global state of play for resistant bacterial animal pathogens that cause transmissible animal
diseases .................................................................................................................................... 6
3.1.1. General overview of studies included and excluded ....................................................................... 6
3.1.1.1. Data from the extensive literature review ..................................................................................... 6
3.1.1.2. Data from national AMR monitoring reports.................................................................................. 8
3.1.2. AMR frequency data ................................................................................................................... 8
3.1.3. Staphylococcus aureus................................................................................................................ 12
3.1.3.1. Results of the ELR by bacterium .................................................................................................. 12
3.1.3.2. Results from the national AMR monitoring reports ........................................................................ 16
3.1.4. Escherichia coli........................................................................................................................... 18
3.1.4.1. Results of the ELR by bacterium .................................................................................................. 18
3.1.4.2. Results from the national AMR monitoring reports ........................................................................ 23
3.1.5. Pasteurella multocida, Mannheimia haemolytica and Histophilus somni ........................................... 29
3.1.5.1. Results of the ELR by bacterium .................................................................................................. 29
3.1.5.2. Results from the national AMR monitoring reports ........................................................................ 39
3.1.6. Streptococcus uberis and Streptococcus dysgalactiae .................................................................... 46
3.1.6.1. Results of the ELR by bacterium .................................................................................................. 46
3.1.6.2. Results from the national AMR monitoring reports ........................................................................ 49
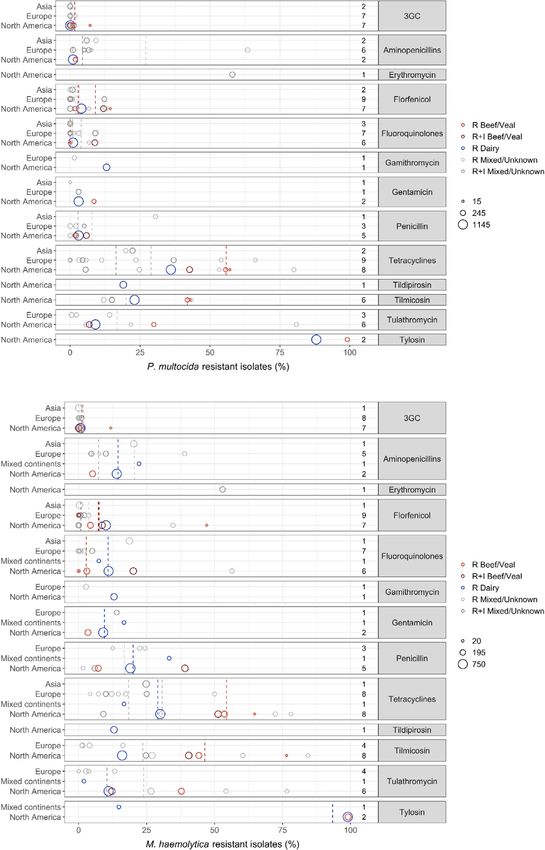
3.1.7. Trueperella pyogenes.................................................................................................................. 54
3.1.7.1. Results of the ELR by bacterium .................................................................................................. 54
3.1.7.2. Results from the national AMR monitoring reports ........................................................................ 57
3.1.8. Mycoplasma bovis ...................................................................................................................... 57
3.1.8.1. Results of the ELR by bacterium .................................................................................................. 57
3.1.9. Klebsiella pneumoniae ................................................................................................................ 59
3.1.9.1. Results of the ELR by bacterium .................................................................................................. 59
3.1.9.2. Results from the national AMR monitoring reports ........................................................................ 60
3.1.10. Moraxella bovis .......................................................................................................................... 63
3.1.10.1. Results of the ELR by bacterium .................................................................................................. 63
3.2. ToR 2: identifying the most relevant bacteria in the EU ................................................................. 63
4. Conclusions................................................................................................................................ 65
5. Recommendations ...................................................................................................................... 66
References............................................................................................................................................... 67
Abbreviations ........................................................................................................................................... 69
Annex A – Search strings applied............................................................................................................... 71
Annex B – Excel file with information on all studies for full-text screening..................................................... 73
Annex C – Clinically-relevant antibiotics for which data were extracted ......................................................... 74
Annex D – Resistance proportion data sorted by country............................................................................. 77
Annex E – Exact percentages of weighted arithmetic means of %R and %R + I, respectively, displayed as
dashed lines in figures .............................................................................................................................. 85
www.efsa.europa.eu/efsajournal 3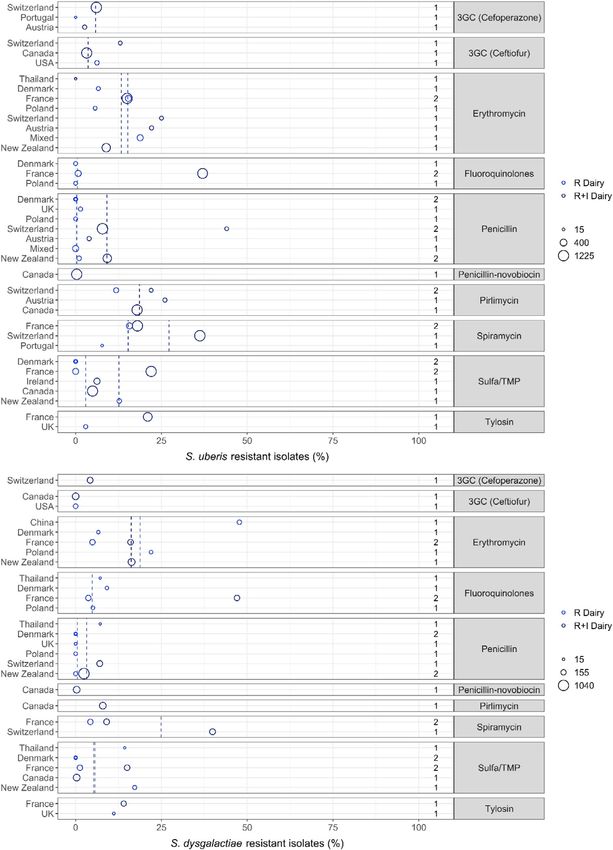
Assessment of animal diseases caused by bacteria resistant to antimicrobials: cattle

1.           Introduction
    EFSA received a mandate from the European Commission to investigate the global state of play as
regards resistant animal pathogens that cause transmissible animal diseases [Term of Reference (ToR)
1], to identify the most relevant bacteria in the EU (first part of ToR 2), to summarise the existing or
potential animal health impact of those most relevant bacteria in the EU (second part of ToR 2), and to
perform the assessment of those bacteria to be listed and categorised according to the criteria in
Article 5, Appendix D according to Articles 8 and 9 within the Regulation (EU) 2016/429 on
transmissible animal diseases (‘animal health law’)1 (ToR 3).
    This scientific opinion presents the global state of play for resistant animal pathogens that cause
transmissible animal diseases (ToR 1) and the results of the assessment of the most relevant bacteria
in the EU (first part of ToR 2) for cattle following the methodology described in (EFSA AHAW Panel,
2021).

1.1.         Background and Terms of Reference as provided by the requestor
   The background and ToR as provided by the European Commission for the present document are
reported in Sections 1.1 and 1.2 of the scientific opinion on the ad hoc method to be followed for the
assessment of animal diseases caused by bacteria resistant to antimicrobials within the animal health
law (AHL) framework (EFSA AHAW Panel, 2021).

1.2.         Interpretation of the Terms of Reference
   The interpretation of the ToR is as in Sections 1.3.1 and 1.3.2 of the scientific opinion on the ad
hoc method to be followed for the assessment of animal diseases caused by bacteria resistant to
antimicrobials within the AHL framework (EFSA AHAW Panel, 2021).
   The present document reports the results of the assessment of bacterial pathogens resistant to
antimicrobials in cattle.

2.           Data and methodologies
    The methodology applied for this opinion is described in a dedicated document that details the ad
hoc method for the assessment of animal diseases caused by bacteria resistant to antimicrobials within
the AHL framework (EFSA AHAW Panel, 2021). Additional methods specific to this opinion (data
collection by an extensive literature review) are detailed below.

2.1.         Extensive literature review
    The process to identify the bacterial species on which to focus in the extensive literature review
(ELR) is described in Section 2.1.2 in the ad hoc method for the assessment of animal diseases caused
by bacteria resistant to antimicrobials within the AHL (EFSA AHAW Panel, 2021). According to that
methodology, the following target bacteria for cattle had been agreed upon by the EFSA working
group: Escherichia coli (non-VTEC), Klebsiella pneumoniae, Staphylococcus aureus, Streptococcus
uberis, Streptococcus dysgalactiae, Pasteurella multocida, Mannheimia haemolytica, Histophilus somni,
Mycoplasma bovis, Moraxella bovis, Fusobacterium necrophorum and Trueperella pyogenes. The ELR
was carried out by the University of Copenhagen under the contract OC/EFSA/ALPHA/2020/02 – LOT
1.2 On 13 April 2021, two different search strings (Annex A) were applied in PubMed and Embase,
respectively, resulting in a search result of 2,749 unique abstracts published since 2010. Upon
importation into Rayyan software, these abstracts were screened by a senior scientist who followed
the criteria described in the protocol for inclusion and exclusion of studies. When available, the full text
of articles was downloaded into EndNote software. In addition, the national antimicrobial resistance
(AMR) monitoring reports from Denmark, Finland, France, Ireland, Germany, Sweden, Switzerland and
United Kingdom (written in English or German) were downloaded and used in the ELR.
    Only the latest version of the AMR monitoring reports was included in the ELR as isolates included
in these reports can be assumed to originate from the same sampled populations and most recent
versions would therefore include the most up-to-date AMR data. The previous versions of the national
AMR monitoring reports, i.e. up to the previous 5 years, were not included in the ELR but were
downloaded and analysed separately to assess changes over time when possible. AMR data in the full

1
    http://eur-lex.europa.eu/legal-content/EN/TXT/PDF/?uri=CELEX:32016R0429&rid=8
2
    https://ted.europa.eu/udl?uri=TED:NOTICE:457654-2020:TEXT:EN:HTML

www.efsa.europa.eu/efsajournal                               4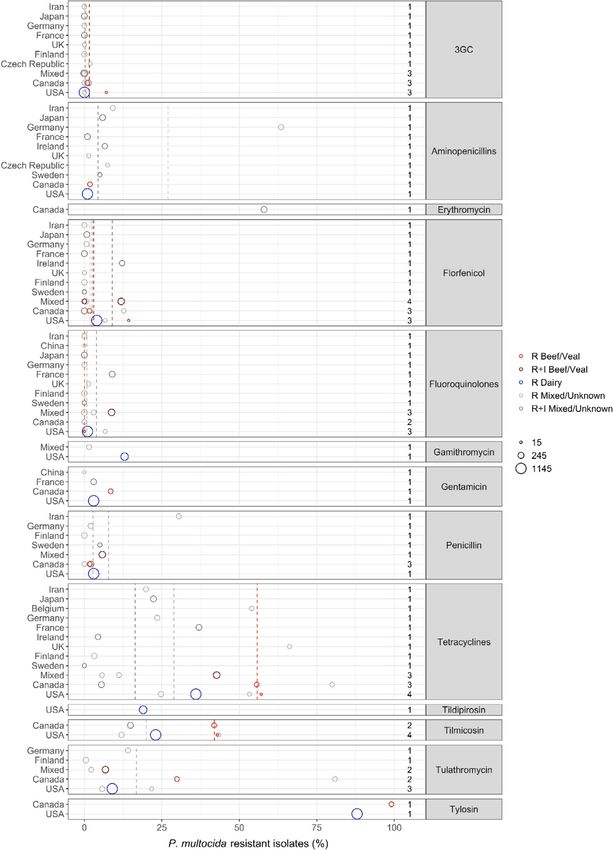
Assessment of animal diseases caused by bacteria resistant to antimicrobials: cattle

texts of national reports were evaluated for eligibility applying the exclusion criteria as described in the
ad hoc method followed for the assessment of animal diseases caused by bacteria resistant to
antimicrobials within the AHL framework (EFSA AHAW Panel, 2021), with the following deviations from
the standard methodology:
    •    Exclusion criterion 8 (minimum number of isolates in a study to be considered acceptable): this
         number was set at 50 for E. coli and S. aureus and at the default of 10 for the other bacterial
         species (the minimum number is for the whole study, meaning that in one study there could
         be less than 50 E. coli from one country, but when isolates from different countries are added,
         the limit of 50 is applied; also, one study could have 25 E. coli isolates from one study period
         and 25 from another, and by merging those time periods, the limit of 50 isolates would be
         reached).
    •    Exclusion criterion 6 (the same individual has been deliberately sampled more than once): This
         criterion was difficult to enforce in this opinion, as in many studies, it was reported that
         samples represented quarters of udders. Although these studies might have included more
         than one sample per animal, we decided to include them unless it was proven that more than
         one sample had been taken per animal (i.e. if the sample number was higher than the number
         of cattle sampled).
    •    Exclusion criterion 16 (studies where AMR was only assessed genotypically): Studies in which
         mecA and/or mecC was used to infer the proportion of methicillin-resistant S. aureus (MRSA)
         were considered eligible.
    Year of bacterial isolation was neither extracted nor reported from the included studies, as in most
studies, isolates had been collected over multiple years with no indication on the number of isolates
per year. An exception to this rule was if only data from a certain time period within a study were
extracted (in the case of national reports reporting multiple years, when only the last data points were
considered).
    Information extracted from the eligible assessed full-text reports/publications is described in the
scientific opinion on the ad hoc method applied in the assessment (EFSA AHAW Panel, 2021).
Information on all the full-text studies that were assessed, including the reason for exclusion for those
that were excluded at the full-text screening, is presented in Annex B. AMR was assessed for clinically
relevant antibiotics according to the method detailed in Section 2.1.3 of the ad hoc method for the
assessment of animal diseases caused by bacteria resistant to antimicrobials within the AHL (EFSA
AHAW Panel, 2021). The list of clinically relevant antibiotics for each target bacterial species in cattle
considered in this opinion are shown in Annex C. When more than one antimicrobial from a given class
was considered eligible for inclusion in the report, the following order of preference for each
antimicrobial class and bacterial pathogen was considered:
    •    For methicillin in staphylococci, data for oxacillin, cefoxitin and presence of the mecA and
         mecC gene were accepted. If data for more than one of these antimicrobials were available in
         the same study, we included the one for which more isolates were tested. If the same number
         of isolates was tested for the different antimicrobials, the order of preference was mecA +
         mecC > cefoxitin > oxacillin.
    •    For third-generation cephalosporins (3GC) in Enterobacterales (as indicator of extended-
         spectrum beta-lactamase/AmpC), the order of preference was cefpodoxime > cefotaxime >
         ceftazidime > ceftriaxone > ceftiofur. If data for more than one of these antimicrobials were
         available in the same study, we included the one for which more isolates were tested. If
         resistance to at least one of these five 3GCs was not reported, we included instead – when
         available – other phenotypic data indicating the presence of ESBL/AmpC, typically data from a
         double disk synergy test (EUCAST, 2017).
    •    The 3GC cefoperazone was reported separately for E. coli, Staphylococcus spp., S. dysgalactiae
         and S. uberis deriving from mastitis, as there is a mastitis-specific clinical breakpoint for
         cefoperazone in these species.
    •    For fluoroquinolones, the order of preference was enrofloxacin > ciprofloxacin, meaning that
         we always selected enrofloxacin if resistance data for both drugs were available.
    •    For tetracyclines, the order of preference was tetracycline > oxytetracycline > doxycycline >
         chlortetracycline; hence, we always selected tetracycline if resistance data for all four drugs, or
         tetracycline + one of the other drugs, were present.

www.efsa.europa.eu/efsajournal                             5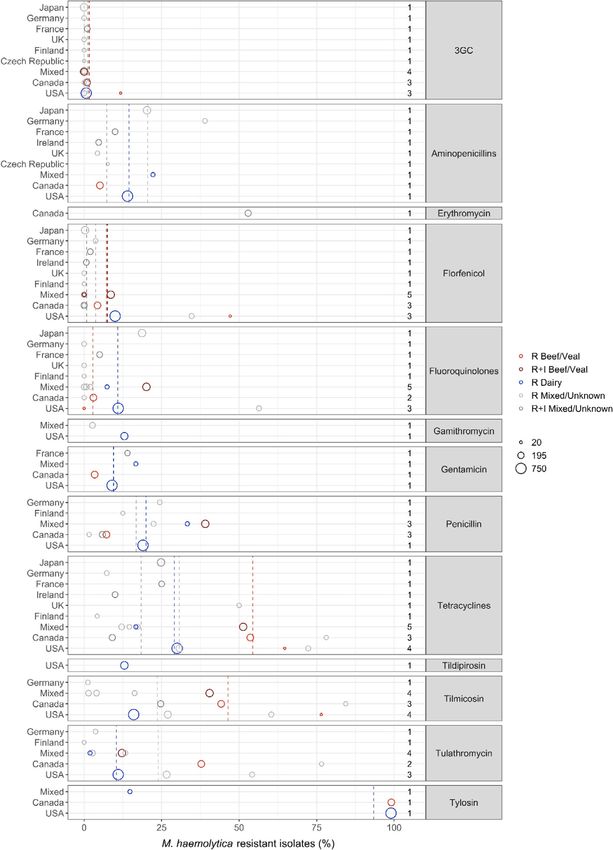
Assessment of animal diseases caused by bacteria resistant to antimicrobials: cattle

   For each study, AMR data were extracted as percentages of resistant isolates (%R) and/or as
percentages of non-susceptible isolates by combining resistant and intermediate (I) isolates (%R + I).
Moreover, the following decisions were made when evaluating data sets:
   When no information on the I category was provided in a study, we considered that the reported
%R only considered resistant isolates (i.e. I isolates had not been included in the R category).
     •   When proportion of susceptibility (%S) was reported with no information on I, it was not
         possible to calculate %R. Instead, we calculated %R + I as 100% %S.
     •   When a study using ECOFFs reported %R, we considered this as %R + I, as the I category is
         always part of the non-wild-type population.
     •   When %I was reported separately, we extracted that along with %R and calculated %R + I.
    For some drugs and presence of mecA/mecC, there is no I category for the bacterial species
included, hence for those we could only report %R, irrespective of the assumptions mentioned above.

3.          Assessment
3.1.        ToR 1: global state of play for resistant bacterial animal pathogens
            that cause transmissible animal diseases

3.1.1.      General overview of studies included and excluded
3.1.1.1. Data from the extensive literature review
   After screening of the 2,750 abstracts, 491 publications were selected for evaluation according to
the criteria under methods. Of these, 364 publications were excluded with the reasons for exclusion
highlighted in columns D and E of Annex B. The reasons for exclusion of publications are listed in
Table 1. The most common reason for exclusion (n = 108) was that an insufficient number of isolates
had been investigated according to the inclusion criteria (≥ 50 for E. coli and S. aureus, ≥ 10 for the
remaining species). The second most common reason for exclusion was that isolates were not clinical
or that it was not possible to distinguish between clinical and non-clinical isolates (n = 47); several of
these publications had investigated milk samples but without specifying if they were from cows with
mastitis or not.
Table 1:       Main reasons for exclusion of publications after full-text evaluation affecting more than
               one publication (a publication could be excluded for more than one reason)(a)
                                                                                   Code in      Number of
Reason
                                                                                   Annex B     publications
Fewer than the minimum number of isolates are included in the publication               8          108
Inclusion of non-clinical isolates or isolates that cannot be distinguished             5          47
from clinical isolates
Full text not available at server of the University of Copenhagen                       10         29
Percentage of resistant isolates not reported                                            7         27
Criteria for selection of isolates unclear and/or high risk of data duplication         14         26
Same animals sampled repeatedly                                                          6         25
Minimum inhibitory concentration data reported without interpretation                   12         22
Publication does not follow a standard for antimicrobial susceptibility                 4          20
testing or a standard is not reported
AMR data included in another included publication                                       9          15
AMR assessed genotypically (except mecA used to infer methicillin                       16         11
resistance in staphylococci)
AMR data reported at bacterial genus level or above                                     3           8
AMR data from multiple host species (other than cattle) reported together               2           7
Biased data presented (only for drugs for which more resistance was                    17(b)        7
found)

www.efsa.europa.eu/efsajournal                             6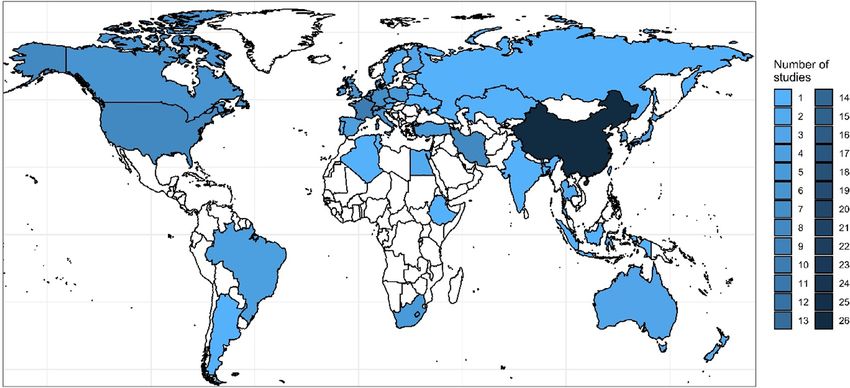
Assessment of animal diseases caused by bacteria resistant to antimicrobials: cattle

                                                                                           Code in            Number of
Reason
                                                                                           Annex B           publications
Antimicrobials tested are not among the ones of interest for this scientific                    13                   6
opinion
All isolates in a publication originate from the same farm                                     15                   5
Language (non-English)                                                                        11                    2
Publication investigating AMR in a subset of resistant clinical isolates                     17(b)                  2
Data included in a more recent report published later                                        17(b)                  2
(a): The other 36 reasons for exclusion affecting one publication each are not reported in this table and are listed in Annex B.
(b): Specified in column E, Annex B.

    After exclusion of these references, 127 eligible publications with information on AMR from clinical
isolates were selected for data extraction. In addition, eight national reports representing Denmark,
Finland, France, Germany, Ireland, Sweden, Switzerland and the UK were selected, as they contained
eligible AMR data on clinical isolates from cattle according to the same set of eligibility criteria
mentioned above (for a total of 135 references considered).
    An overview of the number of eligible studies for each target bacterium is shown in Table 2.
Table 2:       Number of studies from which AMR data were extracted
Bacterial species                                Number of eligible studies for data extraction (n = 135)(a)
Staphylococcus aureus                                                                66
Escherichia coli                                                                     37
Pasteurella multocida                                                                23
Mannheimia haemolytica                                                               20
Streptococcus uberis                                                                 18
Streptococcus dysgalactiae                                                           13
Histophilus somni                                                                    12
Trueperella pyogenes                                                                  8
Mycoplasma bovis                                                                      8
Klebsiella pneumoniae                                                                 5
Moraxella bovis                                                                       1
Fusobacterium necrophorum                                                             0
(a): A publication can provide information on more than one bacterial species.

   Figure 1 below provides an overview of the 135 included studies (some with data on multiple
bacterial species) sorted by year of publication.

Figure 1: Date of publication of the 135 publications included in the extensive literature review

www.efsa.europa.eu/efsajournal                                   7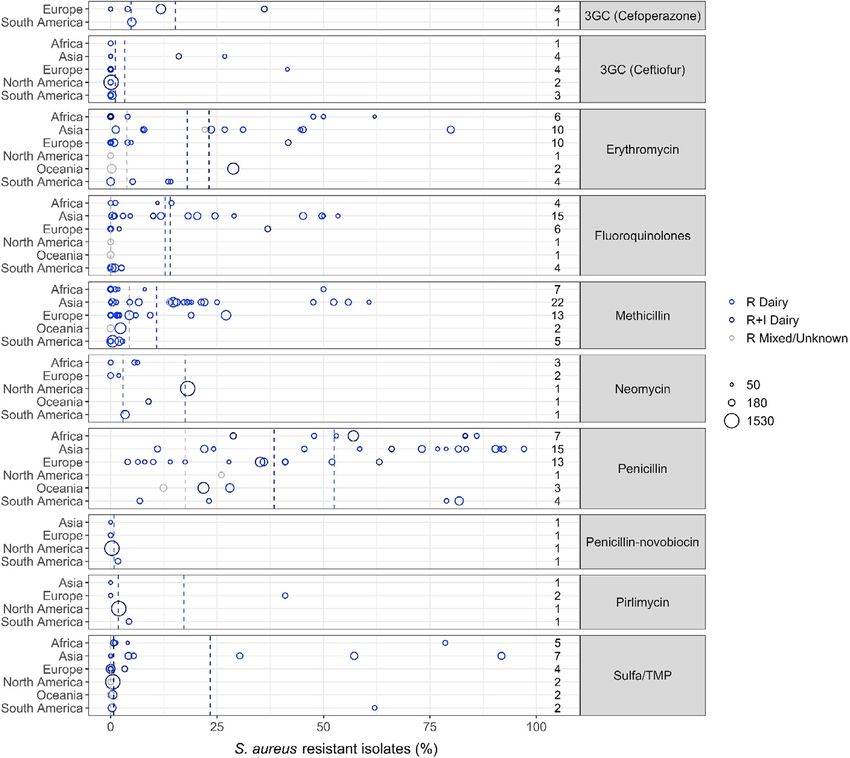
Assessment of animal diseases caused by bacteria resistant to antimicrobials: cattle

    Considering geographical distribution, AMR data were reported in the following number of
publications: Asia (53 publications), Europe (47), North America (13), Africa (11), South America (5)
and Oceania (5) (Figure 2). One publication reported data from multiple continents. For publications
including information from a single country, the country in which a higher number of publications were
performed was China (26 publications) followed by Iran (8), Switzerland (7), USA (7), Canada (5),
France (5), South Korea (5), South Africa (5) and Turkey (5). In addition, there were eight publications
reporting data from multiple countries, of which six included a combination of European countries.

Figure 2: Geographical distribution of the 135 included publications
    Based on the type of isolates analysed in the publication, references included were divided into
those based on the assessment of isolates from: (i) a clearly defined population of cattle in farms,
hospitals or clinics; and (ii) those without – or with limited - background information on sampled
animals (comprising publications with isolates from a diagnostic laboratory or obtained in
slaughterhouses). Ninety-four publications had isolates obtained from samples actively collected in
farms, whereas 29 publications had isolates from diagnostic laboratories and no publications were
performed on samples collected exclusively at slaughterhouses. In four publications, isolates had a
mixed origin (farm and diagnostic laboratory), and for the last eight publications, there was no
information on sample and isolate origin, except they were clinical isolates from cattle.
3.1.1.2. Data from national AMR monitoring reports
    Additional details/data on one or more of the pathogens of interest of this opinion that are
provided in previous versions of eight national AMR monitoring reports retrieved (up to the previous 5
years), namely FINRES-Vet – Finland, SWEDRES-Svarm – Sweden, GERM-VET – Germany, RESAPATH –
France and UK-VARSS – United Kingdom, DANMAP – Denmark, ANRESIS ARCH-Vet – Switzerland and
All-Island Animal Disease Surveillance Report – Ireland, were also extracted and are presented in the
following section (see Table 3). The same terminology used in the report (e.g. proportion of non-
susceptible or proportion of resistant isolates) based on the selected breakpoint for defining resistance/
susceptibility in each report was used to describe the results provided.

3.1.2.      AMR frequency data
    The figures and tables in the following pathogen-specific sections summarise the AMR frequency
data reported for cattle.
    The AMR frequency data are extremely difficult to compare, as study design, selection criteria,
study populations, sampling procedures, methods, interpretive criteria, etc., vary considerably between
publications. The number of antimicrobial susceptibility testing (AST) results for any given antimicrobial
extracted from the 135 selected references (total of 228,620, Annex B) was largely due to the number
of results found for E. coli (95,407, 41.7% of the total number of AST), S. aureus (40,822, 17.9%), P.
multocida (27,455, 12.0%), M. haemolytica (22,653, 9.91%) and S. uberis (18,693, 8.2%). Lower

www.efsa.europa.eu/efsajournal                             8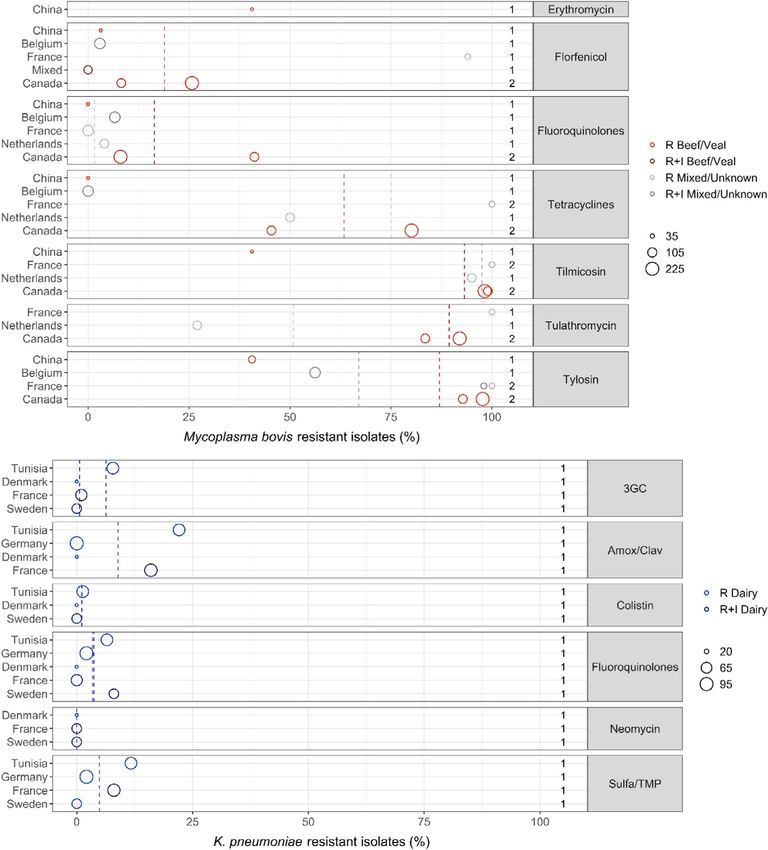
Assessment of animal diseases caused by bacteria resistant to antimicrobials: cattle

numbers of results were available for H. somni (9,217, 4.0%), S. dysgalactiae (5,510, 2.4%) and K.
pneumoniae, Mycoplasma bovis, T. pyogenes and Moraxella bovis (< 4.000 and < 2% from each) and
none for Fusobacterium necrophorum. The laboratory method most commonly used to determine the
AST phenotype was disk diffusion (116,138 of all AST results obtained through this method, 50.8%)
followed by broth microdilution (97,464, 42.6%), with the remaining being determined mostly through
a combination of methods (Annex B).
    Furthermore, the definition of AMR differed across publications, as the intermediate category
defined by clinical breakpoints (CBPs) was included in the calculation of AMR frequencies in some
publications, whereas it was omitted in others. Accordingly, in the figures with resistance data, we
have illustrated for each study whether %R or %R + I was reported; hence, this should be taken into
account when comparing publications. When presenting data obtained in the ELR in the text, the
results are presented as proportion of resistant isolates irrespective of the cut-off used except in
specific cases. It is also important to mention that relatively few infection-specific and host-specific
CBPs exist for bovine pathogens. This complicates interpretation of data, as for several publications, it
was unclear if the CBPs used were adapted from other bacterial or animal species, from humans, or
even ‘self-invented’. In the present report, this issue is of particular relevance for mastitis, as this
infection accounts for the vast majority of data and relatively few CBPs exist for this indication. Taken
together, the outcomes of the present report should be interpreted and cited with caution, as not all
specificities of individual publications can be taken into consideration. In order to support conclusions
made from the figures or tables (e.g. a high proportion of resistance in a certain country/continent), it
is strongly recommended that individual papers are consulted and checked in case results would be
biased by previous antimicrobial treatment, sampling of animals in a certain environment, the use of
certain diagnostic methods or breakpoints, or other factors.
    For data included in the national AMR monitoring reports, details/data provided in previous versions
of the reports from these monitoring programmes (up to the previous 5 years) were extracted and are
presented at the end of each bacterium’s specific section to assess the existence of changes over time
in the proportion of non-susceptible/resistant isolates when possible. The bacterial species most often
included in the reports were E. coli (from mastitis, gastrointestinal samples or unknown origin), S.
uberis (typically from mastitis cases) and P. multocida (from respiratory samples) (Table 3).
Assessment of changes in AMR levels over time in the pathogens under evaluation based on the data
in the reports is hampered in certain cases by the lack of consistent reporting over the years (i.e. only
data from specific years were reported) and/or because data on isolates retrieved over several years
were presented together. Between-country comparisons must be performed carefully as different
methodologies were applied to obtain the results presented in each report, number of isolates tested
for certain species and countries was limited and results provided here are those presented in the
reports (e.g. without accounting for the use of different breakpoints). A comparison of the
methodology, bacterial pathogens, number of isolates and temporal coverage of the information
provided in the last five reports of each monitoring programme is provided in Table 3.

www.efsa.europa.eu/efsajournal                             9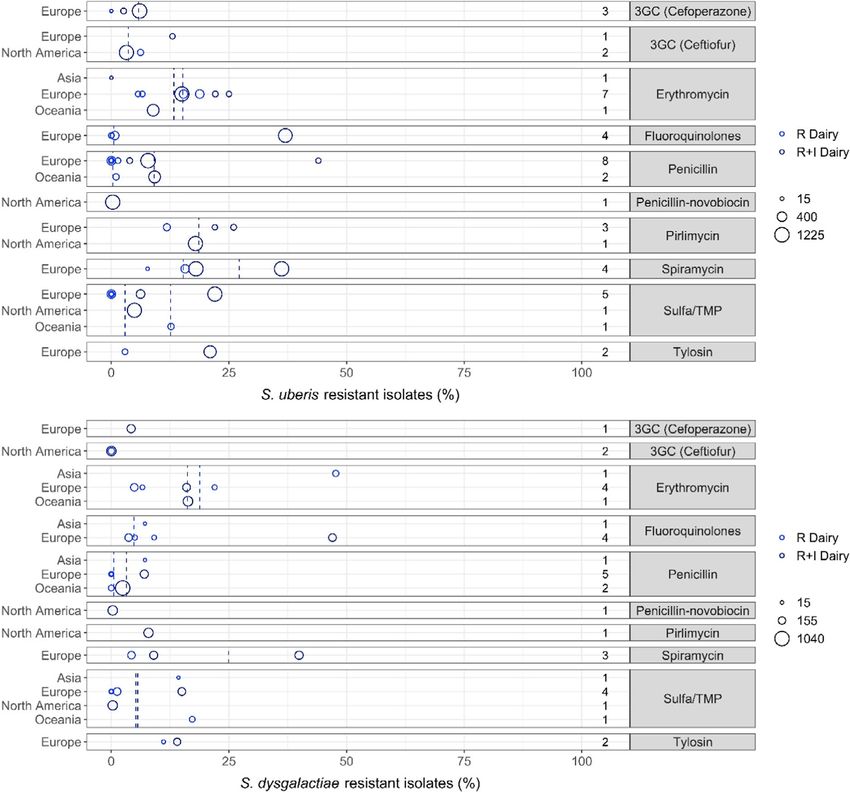
Assessment of animal diseases caused by bacteria resistant to antimicrobials: cattle

Table 3:       AST methodology, bacterial species, host species, number of isolates and temporal coverage of the information on pathogens of interest from
               cattle provided in the eight national AMR monitoring reports (up to the last 5 years) reviewed in this opinion. When a monitoring programme
               does not include a pathogen of interest this is indicated in the table as ‘No’ marked in red
                                                                                                        ANRESIS         SWEDRES-
Programme                    UK-VARSS         RESAPATH           DANMAP                All-Islands                                      FINRES-Vet       GERM-VET
                                                                                                        ARCH-Vet        Svarm
Country                      UK               France             Denmark               Ireland          Switzerland     Sweden          Finland          Germany
Laboratory method            Disk diffusion   Disk diffusion     Broth                 Disk diffusion   Broth           Broth           Broth            Broth microdilution
                                                                 microdilution                          microdilution   microdilution   microdilution
AST interpretation           CBPs(a)          ECOFFs(b)          CBPs                  CBPs             CBPs            ECOFFs          CBPs             CBPs
E. coli                      Yes              Yes                Yes                   Yes              Yes             Yes             No               Yes
Origin (no. of isolates)     Mastitis         Mastitis/GI        Mastitis              Unknown 268      Mastitis (54)   Mastitis/GI                      GI/Mastitis
                             79–110/year(c)   504–4,222/year     17–23/year                                             29–117/year                      (25–284/year)
Years covered                2015–2019        2014–2018          2018–2019             2018             2019            2012–2018                        2014–1018
S. aureus                    Yes              No(d)              Yes                   Yes              Yes             No              No               Yes
Origin (no. of isolates)     Mastitis                            Mastitis              Mastitis (407)   Mastitis                                         Mastitis
                             (36–78/year)                        (12/year)                              (56–60/year)                                     (196–363/year)
Years covered                2015–2019                           2018–2019             2018             2016–2019                                        2015, 2017
S. uberis                    Yes              Yes                Yes                   Yes              Yes             No              No               Yes
Origin (no. of isolates)     Mastitis         Mastitis           Mastitis              Mastitis (291)   Mastitis (56)                                    Mastitis
                             70–123/year      (56–60/year)       (16–17/year)                                                                            (335–384/year)
Years covered                2015–2019        2014–2018          2018–2019             2018             2019                                             2014, 2016
S. dysgalactiae              Yes              Yes                Yes                   No               No              No              No               Yes
Origin (no. of isolates)     Mastitis         Mastitis           Mastitis                                                                                Mastitis
                             (18–41/year)     (112–223/year)     (19–20/year)                                                                            (74–85/year)
Years covered                2015–2019        2014–2018          2018–2019                                                                               2014, 2016
K. pneumoniae                Yes              Yes                No                    No               No              Yes             No               Yes
Origin (no. of isolates)     Mastitis         Mastitis                                                                  Mastitis                         Mastitis
                             (3–13/year)      (44–90/year)                                                              (34–52/year)                     (58–97 per year)
Years covered                2016–2019        2014–2018                                                                 2014–2018                        2014, 2015, 2016,
                                                                                                                                                         2018
P. multocida                 Yes              Yes                No                    Yes              No              Yes             Yes              Yes
Origin (no. of isolates)     Respiratory      Respiratory                              Respiratory                      Respiratory     Respiratory      Respiratory
                             (42–76/year)     (31–301/year)                            (181)                            (79–104/year)   (135–267/year)   (98–149/year)
Years covered                2015–2019        2014–2018                                2018                             2016–2018       2015–2019        2014, 2016–2018

www.efsa.europa.eu/efsajournal                                                                10
Assessment of animal diseases caused by bacteria resistant to antimicrobials: cattle
ANRESIS SWEDRES-
Programme UK-VARSS RESAPATH DANMAP All-Islands FINRES-Vet GERM-VET
ARCH-Vet Svarm
M. haemolytica Yes Yes No Yes No No Yes Yes
Origin (no. of isolates) Respiratory Respiratory Respiratory 150 Respiratory Respiratory
(28–70/year) (45–178/year) (35–79/year) (65–81/year)
Years covered 2015–2019 2014–2018 2018 2015–2019 2014, 2016–2018
T. pyogenes Yes No No No No No No No
Origin (no. of isolates) Mastitis 3–8/year
Years covered 2015–2017
H. somni No No No No No No Yes No
Origin (no. of isolates) Respiratory
(28–47)
Years covered 2015–2019
(a): Human breakpoints recommended by the British Society for Antimicrobial Chemotherapy when available and a uniform cut-off point of 13 mm when not available.
(b): Veterinary guidelines of the Antibiogram Committee of the French Society of Microbiology (CA-SFM).
(c): Data from 157 and 134 isolates from Scotland retrieved in 2018 and 2019 were also available.
(d): Only data on ‘coagulase-positive Staphylococcus’ are provided.
www.efsa.europa.eu/efsajournal 11Assessment of animal diseases caused by bacteria resistant to antimicrobials: cattle
3.1.3. Staphylococcus aureus
3.1.3.1. Results of the ELR by bacterium
Staphylococcus aureus is an opportunistic pathogen of the skin and mucosal membranes. As in
other hosts, it may cause a variety of infections, but mastitis is by far the most important one in cattle.
Although S. aureus survives well in the environment, transmission between cows mainly occurs during
milking, via contaminated hands or equipment.
In total, 66 studies with ≥ 50 S. aureus isolates and results for one or more of the relevant
antibiotics [cefoperazone, ceftiofur, enrofloxacin/ciprofloxacin, erythromycin, methicillin (cefoxitin,
oxacillin or presence of mecA/mecC), neomycin, penicillin, penicillin–novobiocin, pirlimycin,
sulfonamide–trimethoprim] were included. Those studies were distributed as follows: Africa (9), Asia
(23), Europe (23), Oceania (3), North America (3) and South America (5).
The distribution of S. aureus isolates per site of infection is shown in Figure 3. For studies in which
the origin was specified, the vast majority of isolates originated from milk/udder, meaning that isolate
came from cases of either clinical or subclinical mastitis in dairy cattle. For non-mastitis-associated
isolates, it was not possible to discriminate between other specific locations (e.g. wounds).
Figure 3: Distribution of Staphylococcus aureus isolates per site of infection
Figure 4 shows for each continent the proportion of resistance reported in individual studies with at
least 50 S. aureus isolates. Information on proportion of resistance sorted by country is in Annex D.
Each circle represents one study, and the size of each circle reflects how many isolates were
included in the study. The colour of a circle illustrates resistance in isolates of dairy production origin
(light blue circle), resistance merged with intermediate in isolates of dairy production origin (dark blue
circle) or resistance in isolates of mixed or unknown origin (light grey circle). The dashed lines
indicate, for each antibiotic, the weighted arithmetic mean of %R or %R + I with the same colour
codes as used for the circles. The exact percentages these lines represent are listed in Annex E.
Numbers written to the left of antibiotic names reflect the number of studies for a certain drug/
continent combination.
www.efsa.europa.eu/efsajournal 12Assessment of animal diseases caused by bacteria resistant to antimicrobials: cattle Figure 4: Staphylococcus aureus resistance data for each included study sorted by continent On average, the highest mean levels of resistance were observed for penicillin, but resistance proportions varied substantially between studies (Figure 4). In addition, there was a large difference between continents, e.g. the mean proportions of resistance in S. aureus from dairy cattle in Asia (64.2%) and Africa (57.7%) were substantially higher than in Europe (32.1%) (Table 4). In Europe, the lowest levels of penicillin resistance were generally observed in northern and central European countries, namely Sweden (4%), Denmark (17.5%), Austria (10%) and Switzerland (14%), whereas 63.1% of isolates were resistant in Italy even though the corresponding study reported that animals had not been subjected to antimicrobial treatment in the 3 weeks before sampling (Intorre et al., 2012). Resistance to other beta-lactams was considerably less pronounced. For methicillin resistance (MR) in dairy cattle, this was uncommon in Oceania and South America (< 3%), whereas mean proportions were higher in Africa (8.8%), Europe (9.9%) and Asia (19.1%). Importantly, a study by Wu et al. (2019) illustrated that the MR indicator drugs we allowed in this report are not fully comparable, as 52.4% of isolates in that study were resistant to cefoxitin, whereas only ~ 35% of the same isolates were resistant to oxacillin. It is also reasonable to argue that MR proportions based on the presence of mecA are not fully comparable with those based on both mecA and mecC. This was however not an issue, as only two studies screened for mecC, and both of them found none of the tested isolates to harbour this gene (Bonsaglia et al., 2018; Srednik et al., 2018). Resistance to the 3GCs cefoperazone and ceftiofur, for which mastitis-specific CBPs exist, was even less pronounced in most continents (Table 4). Levels of resistance to these drugs were not always equal to MR despite being caused by the same resistance mechanism. For example, in two studies, proportions of www.efsa.europa.eu/efsajournal 13
Assessment of animal diseases caused by bacteria resistant to antimicrobials: cattle

resistance to ceftiofur were lower than MR (Costa et al., 2012; Dorneles et al., 2019). This means that
using ceftiofur, clinical breakpoint for mastitis will sometimes result in treating MRSA infections with
this drug, unless laboratories use an expert rule to classify MRSA isolates as resistant to all beta-
lactams. Penicillin–novobiocin appears to be effective for the treatment of mastitis caused by
S. aureus with no or very little resistance observed in the four studies testing this combination (Figure 4).
    Resistance to the lincosamide pirlimycin was generally low (< 5%), but a study from Austria stood
out with 41% of 100 mastitis isolates being resistant (Wald et al., 2019). This contrasts with the 0%
resistance (%R) observed 2 years later in 60 mastitis isolates from the neighbouring country
Switzerland (ANRESIS ARCH-Vet, 2020). Mean fluoroquinolone resistance levels were higher in Asia
(20.5%) than in other continents (< 8%) (Table 2). Despite low mean levels in Europe, a study from
Italy reported 36.9% of 122 isolates resistant to enrofloxacin (Intorre et al., 2012). This high
proportion was observed in 2011 and reflected a significant increase over the years commencing with
only 5.9% resistance in isolates from 2005 (Intorre et al., 2012). Resistance to neomycin was tested
in relatively few studies and proportions were generally low. The highest proportion (18.3%) was
observed in a study from Canada (Awosile et al., 2018), but this value is not fully comparable with
most other studies, as the resistant and intermediate categories had been merged. The importance of
the I category for this drug is evident in a South African study reporting 16.7% of S. aureus isolates as
intermediate to neomycin (Schmidt, 2011). Most studies reported very low levels of resistance to
sulfonamide–trimethoprim (Figure 4), but a few noteworthy exceptions were detected, and also
for this drug, the highest mean resistance proportion (37.9%) was reported by studies from Asia
(Table 4).

Table 4:       Weighted arithmetic mean, minimum and maximum proportion of resistance (%R or %R + I)
               and weighted standard deviation (SD) in Staphylococcus aureus for the target antimicrobials
               in each continent and sorted by production type. NA means that SD could not be calculated
               as only one study was included
                                                          Weighted
                                                          arithmetic
                                                                      Minimum Maximum
                                                             mean
                               Production No. of No. of              resistance resistance Standard
Antibiotic           Continent                            proportion
                               type       papers isolates                %          %      deviation
                                                               of
                                                                      observed observed
                                                          resistance
                                                             (%)
3GC                  Europe      Dairy            4        772        13.7              0     36.1   10.4
(Cefoperazone)
3GC                  South       Dairy            1        352          5               5      5     NA
(Cefoperazone)       America
3GC (Ceftiofur)      Africa      Dairy            1        79           0               0      0     NA
3GC (Ceftiofur)      Asia        Dairy            4        273        11.5              0     26.8   10.5
3GC (Ceftiofur)      Europe      Dairy            4        317        6.9               0     41.5   15.5
3GC (Ceftiofur)      North       Dairy            2       1,630        0.1              0     0.1     0
                     America
3GC (Ceftiofur)      South       Dairy            3        539         0.2              0     0.3    0.1
                     America
Erythromycin         Africa      Dairy            6        483         22               0      62    25.4
Erythromycin         Asia        Dairy            9       1,309       30.9             1.2    79.9   26.3
Erythromycin         Asia        Mixed/           1        104        22.1             22.1   22.1   NA
                                 Unknown
Erythromycin         Europe      Dairy            10      1,066        5.5              0     41.7   13
Erythromycin         North       Mixed/           1        123          0               0      0     NA
                     America     Unknown
Erythromycin         Oceania     Dairy            1        782        28.8             28.8   28.8   NA
Erythromycin         Oceania     Mixed/           1        404         0.2             0.2    0.2    NA
                                 Unknown
Erythromycin         South       Dairy            4        552         4.9              0     14.1   5.8
                     America

www.efsa.europa.eu/efsajournal                            14
Assessment of animal diseases caused by bacteria resistant to antimicrobials: cattle
Weighted
arithmetic
Minimum Maximum
mean
Production No. of No. of resistance resistance Standard
Antibiotic Continent proportion
type papers isolates % % deviation
of
observed observed
resistance
(%)
Fluoroquinolones Africa Dairy 4 303 6.1 0 14.3 6.3
Fluoroquinolones Asia Dairy 15 1,978 20.5 0 53.4 17.7
Fluoroquinolones Europe Dairy 6 582 7.9 0 36.9 14.9
Fluoroquinolones North Mixed/ 1 123 0 0 0 NA
America Unknown
Fluoroquinolones Oceania Mixed/ 1 202 0 0 0 NA
Unknown
Fluoroquinolones South Dairy 4 824 0.8 0 2.5 0.8
America
Methicillin Africa Dairy 7 576 8.3 0 50 17.4
Methicillin Asia Dairy 21 2,944 19.1 0 60.7 16.6
Methicillin Asia Mixed/ 1 96 13.7 13.7 13.7 NA
Unknown
Methicillin Europe Dairy 13 1,984 9.9 0 27.1 10.8
Methicillin Oceania Dairy 1 733 2.3 2.3 2.3 NA
Methicillin Oceania Mixed/ 1 202 0 0 0 NA
Unknown
Methicillin South Dairy 5 1,474 0.9 0 2.8 0.8
America
Neomycin Africa Dairy 3 233 3.9 0 6.3 2.8
Neomycin Europe Dairy 2 180 0.6 0 1.9 0.9
Neomycin North Dairy 1 1,532 18.1 18.1 18.1 NA
America
Neomycin Oceania Dairy 1 103 8.9 8.9 8.9 NA
Neomycin South Dairy 1 352 3.4 3.4 3.4 NA
America
Penicillin Africa Dairy 7 1,177 57.7 28.8 86 15.7
Penicillin Asia Dairy 15 1,837 64.2 11 97.1 28.9
Penicillin Europe Dairy 13 1,751 32.1 4 63.1 16
Penicillin North Mixed/ 1 123 26 26 26 NA
America Unknown
Penicillin Oceania Dairy 2 1,100 23.9 21.8 28 2.9
Penicillin Oceania Mixed/ 1 202 12.4 12.4 12.4 NA
Unknown
Penicillin South Dairy 4 619 59.9 6.9 81.9 31.9
America
Penicillin– Asia Dairy 1 52 0 0 0 NA
novobiocin
Penicillin– Europe Dairy 1 78 0 0 0 NA
novobiocin
Penicillin– North Dairy 1 1,532 0.3 0.3 0.3 NA
novobiocin America
Penicillin– South Dairy 1 115 1.7 1.7 1.7 NA
novobiocin America
Pirlimycin Asia Dairy 1 52 0 0 0 NA
Pirlimycin Europe Dairy 2 160 25.6 0 41 19.9
www.efsa.europa.eu/efsajournal 15Assessment of animal diseases caused by bacteria resistant to antimicrobials: cattle
Weighted
arithmetic
Minimum Maximum
mean
Production No. of No. of resistance resistance Standard
Antibiotic Continent proportion
type papers isolates % % deviation
of
observed observed
resistance
(%)
Pirlimycin North Dairy 1 1,532 1.9 1.9 1.9 NA
America
Pirlimycin South Dairy 1 115 4.3 4.3 4.3 NA
America
Sulfa/TMP Africa Dairy 5 449 15.8 0.7 78.6 30.2
Sulfa/TMP Asia Dairy 7 1,041 37.9 0 91.8 34.8
Sulfa/TMP Europe Dairy 4 694 0.6 0 3.3 1.3
Sulfa/TMP North Dairy 1 1,532 0.5 0.5 0.5 NA
America
Sulfa/TMP North Mixed/ 1 123 0 0 0 NA
America Unknown
Sulfa/TMP Oceania Dairy 1 364 0.5 0.5 0.5 NA
Sulfa/TMP Oceania Mixed/ 1 202 0 0 0 NA
Unknown
Sulfa/TMP South Dairy 2 356 12.6 0.3 62 24.7
America
3.1.3.2. Results from the national AMR monitoring reports
Information on AMR in cattle clinical S. aureus isolates, typically originating from samples from
cows with mastitis, was included in five national reports, although number of isolates and
antimicrobials used for testing varied widely depending on the country. The base population
represented in these data will also vary according to the source material for these tests.
ANRESIS ARCH-Vet (Switzerland): Data on AMR determined in 56 isolates in 2016–2017
(obtained through a pilot study) and 60 isolates in 2019 (coming from all the country) retrieved from
mastitis cases, which can be detected in ~ 57% of all dairy herds in Switzerland, were included in the
last reports. Isolates were tested in both periods with five antimicrobials of interest for this opinion
(ceftiofur, ciprofloxacin, erythromycin, penicillin and pirlimycin), and in addition, sulfonamide–
trimethoprim was used in 2016–2017 and cefoperazone in 2019. The only antimicrobials for which
non-susceptible isolates were detected were ciprofloxacin and penicillin (Figure 5); although some
changes are observed between the two periods for penicillin resistance, these should be interpreted
with caution as they originated from different isolate populations.
www.efsa.europa.eu/efsajournal 16Assessment of animal diseases caused by bacteria resistant to antimicrobials: cattle
Figure 5: Proportion of clinical Staphylococcus aureus isolates non-susceptible to ciprofloxacin and
penicillin retrieved from mastitis cases reported by the ANRESIS ARCH-Vet programme
All-Islands Animal Disease Surveillance Report (Ireland): Detailed data on AMR obtained in
clinical S. aureus are only provided for 407 isolates from mastitis cases in the 2018 report, providing
results for sulfonamide-trimethoprim with all isolates classified as susceptible (these data are already
included in Figure 4 and Table 4).
DANMAP (Denmark): Resistance data from 12 clinical isolates submitted by veterinary clinics in
2018 and 2019 to the Technical University of Denmark (DTU) in relation to several research projects
are included in the 2019 report. Isolates were tested for resistance to five antimicrobials of interest in
this opinion (cefoxitin, ciprofloxacin, erythromycin, penicillin and sulfonamide–trimethoprim), and only
one isolate resistant to penicillin and cefoxitin was found in 2018 and 2019, respectively.
UK-VARSS (United Kingdom): Between 36 and 78 S. aureus isolates retrieved from mastitis cases
in England and Wales were tested annually between 2015 and 2019 using two antimicrobials of
interest for this opinion. Resistance levels were much higher for penicillin (12–35%), with values
changing largely between years, than for neomycin (< 5%) (Figure 6).
www.efsa.europa.eu/efsajournal 17Assessment of animal diseases caused by bacteria resistant to antimicrobials: cattle
Figure 6: Proportion of clinical Staphylococcus aureus isolates retrieved from mastitis cases resistant
to neomycin and penicillin reported by the UK-VARSS programme
GERM-VET (Germany): Resistance data from S. aureus isolates were reported in 2015 and 2017
with 363 and 196 isolates, respectively. All isolates were considered susceptible to trimethoprim/
sulfamethoxazole and low levels of non-susceptibility were detected for gentamicin (1–1.1%).
Proportion of non-susceptible isolates to ceftiofur (4.2% in 2015 and 14.3% in 2017), erythromycin
(8.3% in 2015 and 4.1% in 2017), oxacillin (4.1% in 2015 and 13.8% in 2017) and pirlimycin (9.9% in
2015 and 5.1% in 2017) remained low, while for tetracycline non-susceptibility levels between 14.6
and 17.3% were reported, and for penicillin between 24 and 25.9%.
3.1.4. Escherichia coli
3.1.4.1. Results of the ELR by bacterium
Escherichia coli is a commensal and an opportunistic pathogen residing in the intestinal microbiota
of animals and humans. The environment can also constitute a reservoir for E. coli. A variety of
infections can be caused by E. coli in cattle, but it is mostly known for causing intestinal or septicaemic
infections in calves and mastitis in adult dairy cows. The former is a contagious disease, whereas the
latter occurs through environmental contamination of the udder. Other less common presentations
include peritonitis, cystitis/pyelonephritis, metritis, wound infections and meningitis derived from
sepsis.
In total, 37 studies with ≥ 50 E. coli isolates and results for one or more of the relevant antibiotics
(ampicillin/amoxicillin, amoxicillin-clavulanic acid, apramycin, colistin, enrofloxacin/ciprofloxacin,
gentamicin, neomycin, paromomycin, sulfonamide-trimethoprim, tetracyclines, 3GC) were included.
These were distributed as follows: Africa (2), Asia (12), Europe (19), Oceania (1), North America (3)
and South America (0).
The distribution of E. coli isolates per site of infection is shown in Figure 7. Most isolates originated
from mastitis in dairy cattle. Of note, clinical isolates included in this review from gastrointestinal tract/
faeces were typically not subjected to typing to confirm their pathogenic nature, and therefore even
though they were considered pathogenic in the references inclusion of a proportion of commensal
strains cannot be ruled out.
www.efsa.europa.eu/efsajournal 18Assessment of animal diseases caused by bacteria resistant to antimicrobials: cattle
Figure 7: Distribution of Escherichia coli isolates per site of infection and type of production
Figure 8 shows for each continent the proportion of resistance reported in individual studies with at
least 50 Escherichia coli isolates. Information on proportion of resistance sorted by country is in
Annex D.
Each circle represents one study, and the size of each circle reflects how many isolates were included in the study.
The colour of a circle illustrates resistance in isolates of dairy production origin (light blue circle), resistance merged
with intermediate in isolates of dairy production origin (dark blue circle), resistance in isolates from beef/veal
production (red circles), resistance in isolates of mixed or unknown origin (light grey circle) and resistance merged
with intermediate in isolates of mixed or unknown origin (dark grey circle). The dashed lines indicate, for each
antibiotic, the weighted arithmetic mean of % R or %R + I with the same colour codes as used for the circles. The
exact percentages these lines represent are listed in Annex E. Numbers written to the left of antibiotic names
reflect the number of studies for a certain drug/continent combination
Figure 8: Escherichia coli resistance data for each included study sorted by continent
www.efsa.europa.eu/efsajournal 19Assessment of animal diseases caused by bacteria resistant to antimicrobials: cattle
Before discussing results for E. coli, it should be noted that data for some of the antibiotics are
reported selectively. This concerns gentamicin, apramycin and paromomycin, which are reported for all
indications other than mastitis, according to clinical indications. Resistance data for tetracycline are
also presented for non-mastitis isolates. Conversely, cefoperazone is reported only for mastitis isolates,
as a mastitis-specific CBP exists for this drug. It must be highlighted that the route of administration
may be different in cases of mastitis (intramammary or parenteral depending on the presentation) and
gastrointestinal infections (oral or parenteral).
For 3GCs, there was a notable difference in resistance levels depending on the production type
with a weighted mean proportion of 10.9% resistance in dairy isolates and 36.5% in isolates of mixed/
unknown origin (Annex D). This is, however, strongly influenced by a large proportion of isolates
(n = 3,360) in the latter category originating from calves in the USA where Cummings et al. (2014)
found that 41.7% of these isolates were resistant to ceftiofur. One would expect an even higher
proportion of resistance when merging the R and I categories, but this was not the case with only 3.1%
of isolates with mixed/unknown origin being resistant to 3GCs. This low proportion is heavily influenced
by the French monitoring system reporting only 3% of 4120 isolates resistant to ceftiofur (RESAPATH
(ANSES), 2020) and could be due to the restriction in its use since 2016. Accordingly, weighted mean
proportions sorted by production type should be interpreted critically taking into consideration other
factors influencing the results. Specifically for Europe, 14 of 15 studies reported less than 8% of E. coli
isolates resistant to 3GCs. The single exception was a study by Elias et al. (2020) who found 43.3% of
102 mastitis isolates in Ukraine to be resistant to ceftiofur. The authors stated that ‘this finding could
potentially be explained by the unrestricted use of extended-spectrum cephalosporins in rural farming of
Ukraine, and more specifically by the preferred use of these antimicrobials for treatment of bovine
mastitis’. The only included study testing cefoperazone susceptibility in mastitis E. coli isolates reported
a resistance proportion of 0.8% among 135 isolates in France (Botrel et al., 2010).
For other beta-lactams, resistance levels were generally high for aminopenicillins although with
much variation between countries, irrespective of continent (Figure 6). Table 3 shows a large
difference in susceptibility between isolates from dairy and other production types. This is even clearer
when zooming in on the French and German monitoring reports; in France, 83% and 34% of E. coli
from calf diarrhoea and mastitis, respectively, were resistant to amoxicillin (RESAPATH (ANSES), 2020).
Corresponding figures in Germany (for ampicillin) were 81% and 12%, respectively. It therefore
appears that E. coli causing gastrointestinal disorders are much more likely to be resistant to
aminopenicillins than mastitis isolates. Although not described here in further detail, these two national
reports showed the same trend for other antibiotics, namely amoxicillin–clavulanic acid, sulfonamide–
trimethoprim and fluoroquinolones. As expected, mean resistance levels were somewhat lower for
amoxicillin–clavulanic acid compared with ampicillin. The highest levels were detected in a Chinese
study reporting resistance in 81 of 100 mastitis E. coli isolates (Cheng et al., 2019).
Mean proportions of fluoroquinolone resistance were low (Figure 6), although some rather large
continent-specific variations were observed. For example, the mean resistance proportions among
isolates of dairy and unknown/mixed origin were 22% and 45%, respectively, in Asia, whereas
corresponding values for Europe were 3% and 10%, respectively (Table 4). In Europe, two studies had
a much higher proportion of fluoroquinolone resistance than others, namely Aasma €e et al. (2019)
reporting 38.1% of Estonian dairy isolates of various origin non-susceptible to ciprofloxacin, and
GERM-Vet (2020) reporting 29.3% of German isolates from calf diarrhoea resistant to ciprofloxacin
based on (human) CBP.
Colistin-resistant isolates were not found in four of the seven studies reporting data for this drug
in E. coli. The remaining three studies showed resistance percentages between 0.5% and 3.2%, the
highest in Estonia (Aasma €e et al., 2019).
For the aminoglycosides gentamicin and neomycin, higher mean resistance percentages were
observed among isolates in Asia compared with Europe (Table 4). However, this is based on fewer
studies compared to other drug classes. Even fewer studies reported data for apramycin; hence,
geographical trends for this drug cannot be derived.
Similar to aminopenicillins, high average levels of resistance were observed for sulfonamide–
trimethoprim and – especially – tetracyclines (Figure 6 and Table 3). As for most other drugs, the
highest levels were observed in Asia compared with Europe. Specifically for Europe, the highest
proportion of tetracycline resistance (79%) was reported by Cengiz and Adiguzel (2020) in calf
diarrhoea isolates. A comparatively high proportion (76%, considering R + I) was observed in isolates
of similar origin from France (RESAPATH (ANSES), 2020). Here, 40% and 69.9%, respectively, of the
www.efsa.europa.eu/efsajournal 20You can also read