Routine-biased technical change can fail: Evidence from France - JRC Technical Report JRC Working Papers Series on Labour, education and ...
←
→
Page content transcription
If your browser does not render page correctly, please read the page content below

Centre

 JRC Technical Report

Routine-biased technical change can fail:
 Evidence from France
 JRC Working Papers Series on
 Labour, education and Technology
 2021/14

 Marta Fana, Luca Giangregorio

This Working Paper is part of a Working paper series on Labour, Education and Technology by the Joint
Research Centre (JRC) The JRC is the European Commission’s science and knowledge service. It aims
to provide evidence-based scientific support to the European policymaking process. The scientific
output expressed does not imply a policy position of the European Commission. Neither the European
Commission nor any person acting on behalf of the Commission is responsible for the use that might
be made of this publication.
Contact information
Name: Marta Fana
Address: Joint Research Centre, European Commission (Seville, Spain)
Email: marta.fana@ec.europa.eu

EU Science Hub
https://ec.europa.eu/jrc

JRC125902

Seville: European Commission, 2021
© European Union, 2021

The reuse policy of the European Commission is implemented by the Commission Decision
2011/833/EU of 12 December 2011 on the reuse of Commission documents (OJ L 330, 14.12.2011,
p. 39). Except otherwise noted, the reuse of this document is authorised under the Creative
Commons Attribution 4.0 International (CC BY 4.0) licence
(https://creativecommons.org/licenses/by/4.0/). This means that reuse is allowed provided appropriate
credit is given and any changes are indicated. For any use or reproduction of photos or other
material that is not owned by the EU, permission must be sought directly from the copyright holders.

All content © European Union 2021
How to cite this report: Fana, M., Giangregorio, L., Routine-biased technical change can fail: Evidence
from France, 2021, JRC125902
Routine-biased technical change can fail:
Evidence from France
 Marta Fana (Joint Research Center, Seville), Luca Giangregorio (Pompeu Fabra university)

Abstract

The paper studies the determinants of wage differentials over time within jobs in France, detailing
the contribution of different set of explanatory factors by means of a Recentred Influence Function,
to estimate the effect of a set of covariates at different point of the wage distribution. We
simultaneously test the contribution of tasks performed by workers and organisational methods at
the firm level, labour market institutions and individual characteristics. We do so by exploiting a
unique database at the worker level, the French Enquête Complémentaire Emploi: Conditions de
travail, between 2005 and 2016, which covers also monthly wages. Main findings support the
hypothesis according to which wages differentials along the wage distribution are almost entirely
explained by contractual and work arrangements rather than tasks and organisational practices.
Overall evidence run against the main argument of the Routine Bias Technical Change hypothesis.
Routine-biased technical change can fail: evidence from France

Authors: Marta Fana (Joint Research Center, Seville), Luca Giangregorio (Pompeu Fabra
university)

Joint Research Centre reference number: JRC125902
Routine-biased technical change can fail: evidence from France

Contents
1. Introduction............................................................................................................................................................................ 7
2. The task approach: critical review ............................................................................................................................ 9
3. Data and Methodology................................................................................................................................................. 11
 The dataset........................................................................................................................................................................................................11
 Tasks measures ..............................................................................................................................................................................................12
 Wage Measures ..............................................................................................................................................................................................15
4. Econometric and statistical methods .................................................................................................................. 18
5. Empirical results .............................................................................................................................................................. 19
6. Conclusions ......................................................................................................................................................................... 26
References .................................................................................................................................................................................... 28
Appendix ......................................................................................................................................................................................... 31

Routine-biased technical change can fail: evidence from France

 1. Introduction
Evidence of increasing and persistent wage inequality in most advanced economies have been one
of the hot topics in academic and policy debate during the last decades. A large body of literature
flourished around the topic aimed at explaining wage differentials among workers within and between
countries and jobs.
The most influential argument used, especially in the labour economics discipline, known as Routine
Bias Technical Change (RBTC), points to the relationship between technological change and wage
dynamics as result of employment polarisation. According to its main proponents (Acemoglu & Autor,
2011; Autor et al., 2003; Autor & Handel, 2013; Goos et al., 2014), RBTC interprets labour, capital and
technology as technical inputs whose relationship is deterministically driven by comparative cost
advantage among them (Autor, 2013; Autor et al., 2003). Indeed, evidence of employment expansion
both at the top and bottom of the wage distribution in many countries – i.e., employment polarisation
- directly depends on the dynamics of relative prices of production inputs (labour and capital). Under
this setting, the analytical lens to study structural change shift from workers’ skills endowment - the
main explanation until recently within the same field - to tasks performed at work defined as “a unit
of work activity that produces output” (Autor, 2013). The more tasks can be easily codified into
procedural routines, the more likely they can be substituted by machines, depressing their relative
returns. What matters to understand wage dynamics is therefore the extent to which a given task,
manual or intellectual, is more or less routinary, more or less codifiable and potentially embodied into
machines.
A second strand of recent literature casts doubts on the routinisation hypothesis at least as main and
unique driver of wage inequality. According to these scholars, wages and wage inequality strongly
depend on institutions and on the way they are shaped by social relations: those directly affecting
the labour market like minimum wage, wage indexation mechanisms (Bosch & Manacorda, 2010;
Derenoncourt & Montialoux, 2020; Lee, 1999; Wright & Dweyer, 2003), labour market liberalisation
(Raitano & Fana, 2019), unionisation (Biewen & Seckler, 2019; Card, 1996; Firpo et al., 2011; Freeman,
1980) and those affecting the society at a much broader level, i.e., welfare state regimes (Esping-
Andersen, 1990; G. Esping-Andersen, 2000), trade liberalisation, class relations and power (even
within the workplace).
According to this standpoint, historical and institutional variables shape not only how value is
distributed among economic agents but also what and the how is being produced across countries,
as well as how tasks are distributed among workers within and between occupations. Indeed, despite
technical feasibility - and even sharing the same level of technological advancement- significant
differences persist between and within countries in the organization of the production process (Fana
et al., 2020). This heterogeneity strictly depends on social relations and how institutions and
regulations shape markets and the dialectics between labour and capital. For example, labour market
institutions and policies aimed at keeping wages low act as a disincentive to invest in innovation,
since profits margins can be guaranteed and extracted from labour rather than capital and market
penetration (Sylos Labini, 1972; 1984). Moreover, differences in tasks distribution across workers are
not necessarily related to technical consideration and hold even within the same job. This is the case
for the persistent gaps in material tasks, workers’ autonomy and forms of control between genders
(Fana et al., 2021; West, 1990; Wright et al., 1995) which cannot be explained by supply side factors.
Even legislative (and/or cultural) changes can alter the whole production and labour process and force
it to re-adjust according to the new regulation. This is the case of working time, which forces firms to
Routine-biased technical change can fail: evidence from France

find new forms of industrial and production organization to keep increasing the productivity despite
lower working hours and, therefore, intervening on the how to produce.

Our paper originally contributes to the literature on the determinants of wage differentials over time
detailing the contribution of different set of explanatory factors. Thanks to the richness of the
database exploited in this paper, we are able to simultaneously test most of the covariates behind
wage inequality used in the relevant literature: tasks performed at work, labour market institutions
affecting workers’ contractual arrangement and working time, as well as individual characteristics -
education, nationality, region of residence, gender and experience - and firms’ characteristics, i.e.,
economic sector, private vs public nature of the employer and firm size. An additional contribution of
our paper is its ability to exploit tasks changes within and between jobs dynamically; a degree of
granularity which has been exploited, to the best of our knowledge, only by very few papers in the
literature (S. O. Becker & Muendler, 2015; Spitz-Oener, 2006) although for a different research
question. However, these papers do not account for changes within occupations and sectors jointly
considered. They assume instead that a specific occupation is characterised by a given bundle of
tasks regardless of the industry of employment and its level of technological advancement and
market structure. As discussed in Calvino and Virgillito (2018), the technology-employment relation
changes according to both the level of aggregation (firm or sectoral level) and between industries.
Hence, ignoring such source of heterogeneity may reduce and bias the true understanding of
structural patterns and their determinants. Accordingly, our work accounts for tasks differences within
jobs defined as sector-occupation combinations (Hurley et al., 2013; Wright & Dweyer, 2003) so to
simultaneously analyse changes along the vertical (occupations) and the horizontal (economic
activities) division of labour.
All in all, this is the first paper which studies wage inequality dynamically exploiting data at the level
of workers, not occupations, which uses consistent time variant measures of tasks, contrary to most
of the literature on the relationship between tasks and wages (Autor & Handel, 2013; Biewen &
Seckler, 2019; De La Rica et al., 2020; Firpo et al., 2011; Fortin & Lemieux, 2016; van der Velde,
2020).

For this purpose, we focus on France as an advanced European economy with a long tradition of
working condition surveys covering individual-level information on tasks, work organisation, socio-
demographic, contractual arrangements, and wages. Beyond data availability, France is an interesting
socio-economic context. From a policy perspective, France has been until recently less subjected to
the liberalization of the labour market (at least comparatively with respect to other Southern and
Eastern member States). At the same time, as for the economic perspective, in the last twenty years,
France experienced a slight compression of the wage distribution i.e., a reduction in wage inequality,
while studies on the evolution of the employment structure point to non-monotonic patterns. Indeed,
using the “job-approach”, Fernández-Macías (2012) shows a pattern of polarization between 1995
and 2007, followed by a process of mid-upgrading between 2011 and 2016, with top occupations
growing more than the bottom ones according to (Fernández-Macías et al., 2017). France is
characterised by larger occupation wage heterogeneity at the regional level. For example, Ile de
France experienced a stronger occupational growth in the low-paid occupations, while Rhone-Alpes
experienced an upgrading pattern (Hurley et al., 2019).
Routine-biased technical change can fail: evidence from France

The rest of the paper is structured as follow: Section 2 critically reviews the standard tasks approach;
Section 3 presents the dataset and the methodology for the construction of the tasks profile and
wages, our main dependent variable, and provides also descriptive evidence on the evolution of both
tasks on wages. Section 4 introduces the econometric method applied, while Section 5 discusses main
empirical findings. Finally, Section 6 concludes.

 2. The task approach: critical review

The theoretical foundation of the RBTC hypothesis - at the core of the standard task-approach - is
grounded on the deterministic link between production inputs (i.e., human labour and machines)
spurring from relative prices and therefore comparative advantages (Autor, 2013).
Within this approach labour is intended as a bundle of tasks, i.e., work activities, required to produce
a certain amount of output. Therefore, wages and employment contraction (expansion) are ultimately
related to the extent to which a given task can(not) be codified into standardised procedures –
routinised – and therefore executed by machines rather than relatively more expensive labour input.
Established as the most influential approach to the study of wage differentials across occupations,
the tasks approach has been implemented as main hypothesis in a long list of empirical contributions.
All these works share a common aim: explaining patterns of employment polarisation and increasing
wage inequality assuming that exists a strong complementarity with ICT at the top and substitutability
in the middle of both employment and wage distribution. Most of the related empirical literature find
evidence in favour of this (Autor & Handel, 2013; De La Rica et al., 2020; Firpo et al., 2011; Fortin &
Lemieux, 2016; van der Velde, 2020). Conversely, a recent study by Domini et al. (2020) finds no
wage inequality- enhancing effect of firms’ investments in AI in France.
However, the theoretical ground informing RBTC has been questioned from different schools of
thoughts which converge in contesting the exclusion of all dimensions related to human agency and
social relations characterising the production process. This critical assessment argues that the
production process is not a self-determined mixed of inputs interacting in a black box, but rather an
organization characterised by social relations embedded in the hierarchical division of labour (Cetrulo
et al., 2020; Thompson & McHugh, 1995), mechanisms of command and control over the labour force
(Dosi & Marengo, 2015; Edwards, 1982) which are historically and institutionally dependent (Dosi,
1995).1
According to this critical assessment, grounded on both the evolutionary approach (Dosi et al., 2001)
and the Labour Process Theory (thereafter LPT, see Braverman, 1974; Edwards, 1982; Knights David
& Hugh, 1990), the technical content of the production process goes hand in hand with work
organization made explicit in a set of procedures and standards, i.e., organizational routines (M. C.
Becker, 2004; Clegg, 1981; Coriat & Dosi, 1998).
Therefore, routine defines a way of performing task, rather than the task itself to be performed, as
defined by the RBTC. To clarify, the same manual or intellectual tasks can be performed in a more or

1
 As organisational practices, including routines, are historically and institutionally contingent, they are highly heterogeneous
across sectors and countries even in the case of similar level of technological advancement/adoption (Fana et al., 2020).
Hence, using data measured on a specific country may lead to substantial biased, if not misleading, result when the same
measure is applied to other socio-economic structures. This is true even when the different countries share similar levels of
technological development, especially if non-market variables, like institutions, are left out the analysis.
Routine-biased technical change can fail: evidence from France

less routinised or autonomous way depending on the organisational practices prevailing at the
workplace.
But what routines are about and how ICT deployment at the workplace shape them?
In the standard Autor, Levy and Murnane (2003) model, “a task is “routine” if it can be accomplished
by machines following explicit programmed rules” and this is made possible because “these tasks
require methodical repetition of an unwavering procedure”. Routine appears as an innate tasks’
attribute. However, routines as “recurrent actions patterns” (Dosi et al., 2001) which may or may not
be codified into technological devices (digital or not) are a collective social outcome. Historically, even
Taylorism is about tasks routinization whose aim was not the substitution of human tasks by
machines per se but a mechanism able to codify tacit knowledge and shift the control over the
production process from the worker to the management.
This is what LPT defines as the deskilling of the workforce (Braverman, 1974). As stated by Edwards
(1982) “computers can send instructions according to its pre-programmed routine as to what
operations or activities workers are to perform” and then send information to a central programming
computer controlled by the management who can indirectly follow the entire production process and
its phases. In other words, while computers might substitute several workers’ tasks, like computing,
their adoption at the workplace may took place without replacement of human labour. A well-
established example drawn from reality is the adoption of digital tools at the shopfloor used by the
management to monitor and dictate the pace of work to subordinates. In this, as in other cases, the
choice to introduce new digital devices always respond to the balance of power and its dialectic
among workers and management/ownership and only to a lesser extent to technical considerations.
At the same time, digital-enabled machines are learning tools acquiring information and workers’
knowledge on specific tasks like the ability to solve problems as they emerge during a production
phase. Computers therefore store tacit knowledge which will be incorporated into instructions and
procedures to be followed once similar events occur. In this case, the replacement between machine
and human labour do not relate to the repetitiveness of tasks but workers’ analytical capacity which
will be subtracted from their control (leading to a deskilling process). At the same time, the possibility
to codify analytical tasks into procedure transform workers’ tasks by making them more standardised.
Consequently, the positive relationship between the deployment of new technologies and wages of
those in charge of supervisory activities can no longer be attributed to a technical complementarity
but to their political role within the workplace. Conversely, declining wages for workers’ subject to
more standardisation (because of the introduction of new technology) depend on the ability to
disempower them rather than actual substitutability. Yet, the latter relationship will be one of the
focuses of the present study.
Following the social embedded definition of routine, Fernández-Macías and Bisello (2021) propose
an extended conceptual taxonomy of tasks which classifies tasks into two main dimensions: contents
vs methods of work and tools. The first dimension includes a number of task indicators map what
people do (content of work), that is the activities required to produce output from a technical
perspective. The second dimension of the framework aims at capturing how workers do what they do,
that is the organizational practices prevailing in a specific production process and the tools (digital
and non-digital) used at work.
From an analytical point of view, the conceptual framework applied here is able to grasp the
complexity and multidimensionality of social relations embodied in jobs. It is paramount to note that
differently from the standard or other task approaches proposed in the literature, the extended
Routine-biased technical change can fail: evidence from France

framework discriminates routine from other forms of control/autonomy (De La Rica et al., 2020;
Marcolin et al., 2016) as well as managerial tasks which pertain to the social content of tasks and
not to a generic abstract analytical content (Autor et al., 2003; Autor & Handel, 2013).
At the same time, impersonal and codified forms of control can co-exist with different level of
autonomy, depending on the specificities of the production process as well the internal organisation.
Looking into more detail at routine, as described above, we distinguish between repetitiveness and
standardisation, two different concepts which do not necessarily overlap nor distribute accordingly
across jobs. The conceptual choice has already been proven consistent empirically: for instance,
Bisello et al. (2021) show that - at the European level - workers characterised by higher level of
repetitiveness are also highly standardised, while the opposite does not necessarily hold, especially
at the top of the occupational ranking.
We then move forward and refine the measure of routine as it appears in Fernandez-Macias and
Bisello’s (2021) framework by detailing the concept of standardisation following Edwards (1982).
According to this scholar, standardisation (captures institutionalised control and can take two
different forms: 1) bureaucratic control and 2) technical control.
In Edwards’ own words: “more formal, consciously contrived controls could be embedded in either the
physical structure of the labour process (producing “technical” control) or in its social structure
(producing “bureaucratic” control). New systems made control more institutional and hence less visible
to workers. Technical control reduces workers to attendants of prepaced machinery.” Instead, “This
system, [bureaucratic control], is the institutionalisation of hierarchical power. Rule of law replaces
rule by supervisory command in the direction of work, the procedure for evaluating workers’
performance, and the exercise of the firm’s sanctions and rewards; supervisors and workers alike
become subject to the dictates of “company policy” (1982, pp. 20–21).

 3. Data and Methodology

The dataset
The empirical analysis employs data from the Enquête Complémentaire Emploi: Conditions de travail
(Complementary Survey of Employment: Working Conditions, EC afterwards) carried out since 1978
by the Direction de l’Animation de la Recherche, des Études et des Statistiques (DARES) of the French
Ministry of Labour. The EC represents the oldest European database that collects information at the
individual level on working conditions, task content, work organization, mechanical and digital tools
use at work, socio-demographic characteristics, contractual arrangements, and wages. It is nowadays
run every three years and covers almost the entire spectrum of occupations at four-digit and
economic sectors at two-digit level, depending on the wave. We restrict the analysis using two main
waves, 2005 and 2016, so to avoid any inconsistency driven by potential effects induced by
reorganisation and/or restructuring practices during the 2008 Crisis.
The survey is representative of the entire working population (employees or not) resulting in a
database of around 15,196 observations in 2005 and 18,048 in 2016. Over time, the main building
blocks and questions have been maintained almost unaltered especially on work content and
organisational practices with some minor changes across waves (for a detailed description of the
survey see Dares, 2005). Major changes relate to the inclusion of wages since 2005 and a detailed
section on health and safety since 2013.
Routine-biased technical change can fail: evidence from France

The consistent structure over a long-time span allows to overcome some limitations that apply to
most databases used for tasks analysis. The EC allows to measure tasks directly and consistently
over time within jobs (occupation by sector combinations) together with detailed employment
structure and individual characteristics.
Classification for economic sectors and occupations are coded in both the French and International
classifications, which allows to overcome problems related to changes in the ISCO classification. For
the sake of consistency, our empirical analysis uses information from the Classification of Professions
and Socioprofessional Categories2003 (henceforth PCS 2003) three-digit level recorded in both
waves and an aggregation of economic sectors based on high-tech statistics provided by Eurostat
(2020) for both Nace rev11 and Nace rev2 to avoid changes due to the update of the NACE
classification occurred in 2008. The resulting aggregation consists in nine macro-sectors: Primary;
Construction; Low-Tech Industries; High-Tech Industries; Low Knowledge-Intensive Sectors;
Knowledge-Intensive Sectors; Public administration; Education and Health.2
To capture the composition of the employment structure at the aggregate level and to characterise
work activity at the individual level, we use jobs as unit of analysis (Hurley, John et al., 2013; Wright
& Dweyer, 2003) where each job, a cell, is defined as the combination between occupation and sector.
Using this definition, the resulting job matrix consists of 1,742 cells (jobs) in 2005 and 2,239 in 2016,
where each cell has a different size in terms of employment given by population weights (with some
missing cells because of null employment: e.g., Fishermen in the Health sector).

Tasks measures
Using data for 2005 and 2016 from the EC survey, we build individual tasks profiles refining the
conceptual framework developed by Fernández-Macías and Bisello (2021)

Measures of tasks content.
We distinguish among three groups of task indicators for the content of work: physical, intellectual,
and social tasks. Physical tasks are proxied by physical strength (i.e., the requirement of moving or
carrying heavy loads), while within intellectual ones we restrict our analysis to conceptualization which
refers to conceptualization, learning and abstraction activities as form of complex information
processing. Finally, we measure social tasks detailing between serving and attending activities which
measure whether the worker is in direct contact with the public like clients or customers and managing
and coordinating (whether the respondent instructs and supervises others’ work activities).
Distinguishing between the type of social tasks performed is relevant since it captures very different
forms of interactions: while serving and attending is a material input of work towards the production
of output (a sales worker interacts with clients to sell them some goods/services), the activity of
managing and/or supervising does not transform material inputs but applies hierarchical power over
subordinates.

2
 The aggregation used in this paper follows Eurostat reclassification of manufacturing and service industries
according to their technological intensity. In order to reduce the number of groups we incorporate “medium-
high technology” sectors with the high-tech ones and “low-tech technology” group into the low technology one.
Table A 1 in Appendix provides the aggregation for Nace rev2 data while the corresponding table for Nace rev
11 data can be found at https://ec.europa.eu/eurostat/cache/metadata/Annexes/htec_esms_an2.pdf and
https://ec.europa.eu/eurostat/cache/metadata/Annexes/htec_esms_an3.pdf
Routine-biased technical change can fail: evidence from France

Measures of methods of work and tools.
Methods of work capturing organisational practices are operationalized using three groups of
indicators. The first one refers to teamwork, that is the extent to which workers collaborate with
colleagues in the execution of their tasks. The second involves workers’ autonomy captured by the
degree of workers’ latitude in carrying out their tasks and forms of direct control (internal and
external)3 exercised over them. More precisely, latitude is measured by bundling questions related to
workers’ ability to interrupt their own work beyond pre-established breaks; whether instructions by
the hierarchy establish both what to do and how to perform the task; freedom not to strictly follow
hierarchical instructions on procedures and goals. Then, internal control indicates the degree of direct
control that workers experience from their bosses or supervisors within their organization while
external control refers to the degree of control exerted on the workers by figures external to their
workplace, such as a client influencing deadlines. The last set of indicators within methods of work
captures the extent of routine at work, which encompasses both the degree of repetitiveness and
standardization of the labour process. Repetitiveness draws from a direct question asking whether
the execution of one's work implies the continuous repetition of gestures or operations.
Standardisation captures the extent to which work execution follows pre-codified standards and
procedures (Harry Braverman, 1974; Edwards, 1982). Using the information provided in the EC and
following Edwards (1982) our measure of standardisation is detailed into:
 ● technical control measuring if the pace and rhythm of work is imposed by the automatic
 cadence of a part or movement of a machine;
 ● bureaucratic control further decomposed into a) digital monitoring: whether pace of work is
 imposed on workers by computerized tracking and monitoring systems and b) objective:
 whether the worker has to achieve specified quantifiable objective.

Finally, tools used at work complete the second dimension coherently with the theoretical arguments
outlined in the previous section. Briefly, technological tools (whether digital or mechanical)
complement the organisational structure and their adoption directly depend on work organisation and
simultaneously shape the division of labour.
In what follow, we measure the types of digital tools used at work distinguishing between basic Ict
and digitally-enabled machines. The first indicator includes the use of internet for professional
purposes, emails, and internal networks (i.e., intranet), while the second bundle together different type
of machines: mobile phone, microcomputer (whether or not connected to a network or other
computers), terminals and desktop and laptops.
Although raw measures for ICT and more broadly computerization remained the same across waves,
the complexity and sophistication of the same type of digital machine has evolved rapidly, expanding
its application within the workplace both within and between occupations. From a qualitative and
technical perspective, what a computer can process and its potential interconnectedness with other
devices has changed, as it is the case for the integration between email boxes and other applications
(MS Office, monitoring and production flows applications).

To build the tasks indicators presented above, we use for each of them the same set of questions
and variables - reported in Table A 2 in Appendix - across different EC waves. The resulting tasks

3
 The two variables capturing direct control are inverted to capture workers’ autonomy from that form of
control (the higher the value of internal and external control indicator, the higher the autonomy).
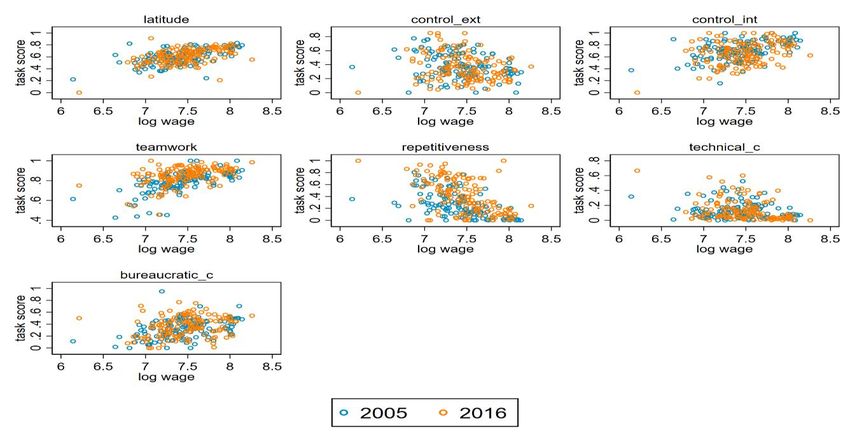
Routine-biased technical change can fail: evidence from France

profile is therefore fully consistent over time. Methodologically, the construction of the task indicators
follows the procedure adopted in (Fana et al., 2021) in which, for each indicator, the task score is
defined at the worker level as the average score across variables/items related to the specific
measure. The only exception refers to ICT indicators which are not originally included in the 2016
wave; therefore, we imputed the average score by job (at three-digit occupational and two-digit
sectoral level) and gender using 2013 data. In this case, the resulting indicator is no longer defined
at the worker level but at the gender-job one. Moreover, in order to maintain consistency across the
two waves, we apply the same procedure to 2005 data.
As already pointed out in several recent studies (S. O. Becker & Muendler, 2015; Bisello et al., 2019;
Freeman et al., 2020; Marcolin et al., 2019) tasks profiles mostly differ within rather than between
occupations and the same do tasks changes over time. This is confirmed in our setting where, by
means of a shift share analysis4 reported in Figure 1, the within job component dominates changes
in tasks over time for at least half the tasks indicators considered. A second result spurring from the
shift share analysis is the overall increase in repetitiveness as well as bureaucratic control and
physical tasks, in line with findings from the European Job Monitor 2016 (Fernández-Macías et al.,
2016). For instance, according to the EJM 2016, despite the decrease in routinised jobs, the overall
level of routine intensifies over time. Moreover, the substantial relative increase in repetitiveness
compared to the other indicators is surprising. The indicator has been built using the same question
between the two waves so that potential bias in reporting or measurement are strongly mitigated. A
deeper inspection across occupations (detailed using the two-digit PCS 2003 classification) shows
that repetitiveness increases for all occupations; higher changes occur at the top of the occupational
ranking where repetitiveness more than double for workers performing professional and clerical
occupations (see Table A 3 in the Appendix).
Such result can be related to the increase in the standardisation of work, captured by the substantial
within increase in bureaucratic control: the more procedures are codified (i.e., standardised), the more
tasks become repetitive. This outcome is coherent with the deskilling hypothesis. Indeed, higher ICT
adoption increases the possibility to standardise a given task, absorbing the analytical and/or
problem-solving part into the machine, while leaving the worker with just the repetitiveness of
operation. This interpretation is also in line with our theoretical understanding of routine and the
relationship between measures of routine and ICT deployment, which do not necessarily substitute
nor complement tasks but enter the workplace to expand the potential of control and its
organisational rationalisation (Nobel, 1984; Nuvolari, 2002; Trusson et al., 2018). Furthermore, while
the share of the workforce using both basic ICT and other digitally enabled machines increases, the
compositional effect is by far outweighed by the more intensive use of digital tools at the workplace
(the within component).

4
 The shift share analysis is used to decompose the change in each task indicator over two periods,
∆ = − −1 , into the between effect capturing the reallocation of workers between jobs and
the effect of the change of a given task indicator within each job. The analytical formulation is ∆ =
 ∑ ̅ ∆ + ∑ ̅ ∆ + = + where j index jobs, is the employment share of job j
in period t. Overbars indicate average over time of the given quantity: ̅ = ( + +1 )/2 and
 ̅ = ( + +1 )/2. and refer respectively to the between and within component. Finally,
 captures the interaction between task and employment change which can be computed as residual.
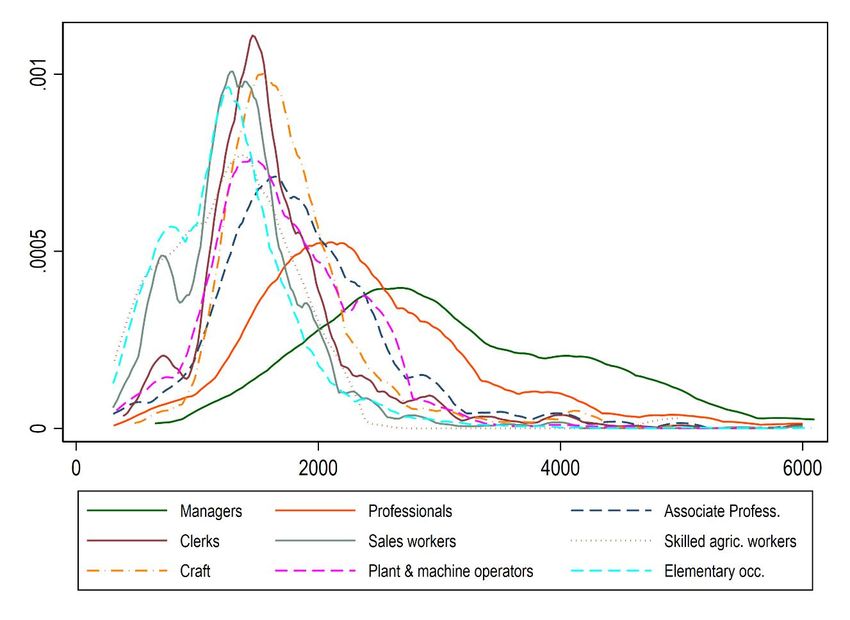
Routine-biased technical change can fail: evidence from France

Finally, it is also interesting to observe the higher contribution of the compositional (between)
component - compared to the within variation - for serving and attending activities: it is in line with
the expansion of the service sector. Conversely, increases in intellectual tasks, i.e., conceptualisation,
is mostly driven by the within component meaning that intellectual activities increase for most of the
occupations, even those with low initial levels of conceptualisation.

Figure 1: Shift share analysis, 1995-2016

Source: authors’ elaboration on EC data.

Wage Measures
Detailed information on wages at the individual level are consistently provided within the EC over
waves. In particular, workers are asked to report their net monthly wage including, if any, the variable
component due to performance-based premia (at the individual, team or company level). To validate
the answers, the survey includes additional questions on annual wage and detailed (fourteen) ranges
of net monthly wage. After comparing the consistency between monthly and annual wage using the
number of months worked during the year, we opt for monthly wage (including premia) the main
outcome variable used in the empirical analysis.
According to the RBTC theory, wage dynamic is strictly linked to tasks performed at work more than
other explanatory factors, like changing in labour market institutions. Differences in wages across
occupations mostly depend on the different tasks profile prevailing across them: the more the routine
level the lower the returns, and viceversa (Acemoglu & Autor, 2011; D. Autor, 2013a; De La Rica et
al., 2020; Fortin & Lemieux, 2016). A preliminary descriptive analysis performed using our data does
not confirm such relationship. For instance, plotting tasks indicators against monthly (log) wage –
Figure 2 and Figure 3 – clearly shows a positive relationship between wages and managerial tasks
Routine-biased technical change can fail: evidence from France

as well as workers’ autonomy but also with respect to proxies for standardisation and teamwork.
Conversely, wages show a negative association with the level of physical tasks and repetitiveness.

Figure 2: Average occupational (log) wages in 2005 and 2016 by tasks content indicators

Source: Authors’ elaboration on EC data.

Figure 3: Average occupational (log) wages in 2005 and 2016 by Methods of work indicators

Source: Authors’ elaboration on EC data.
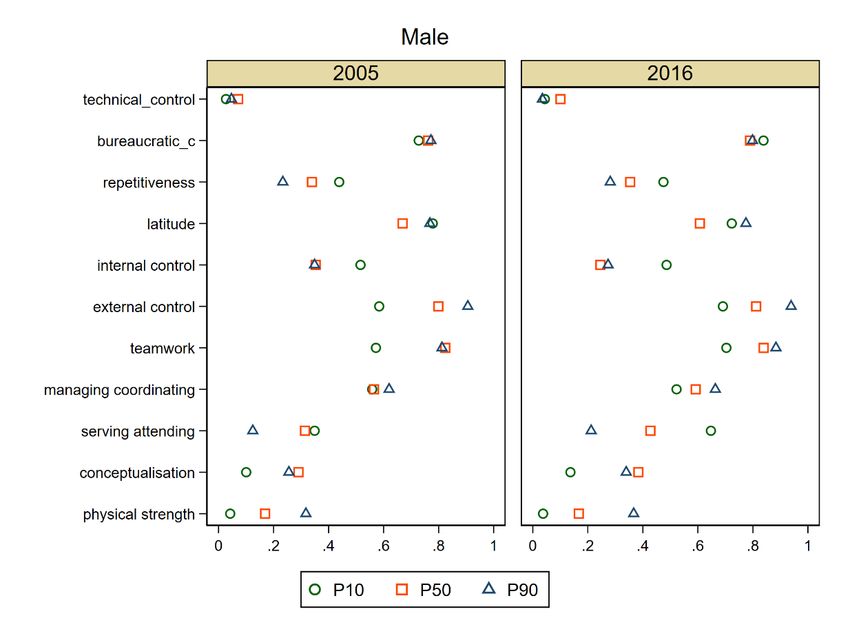
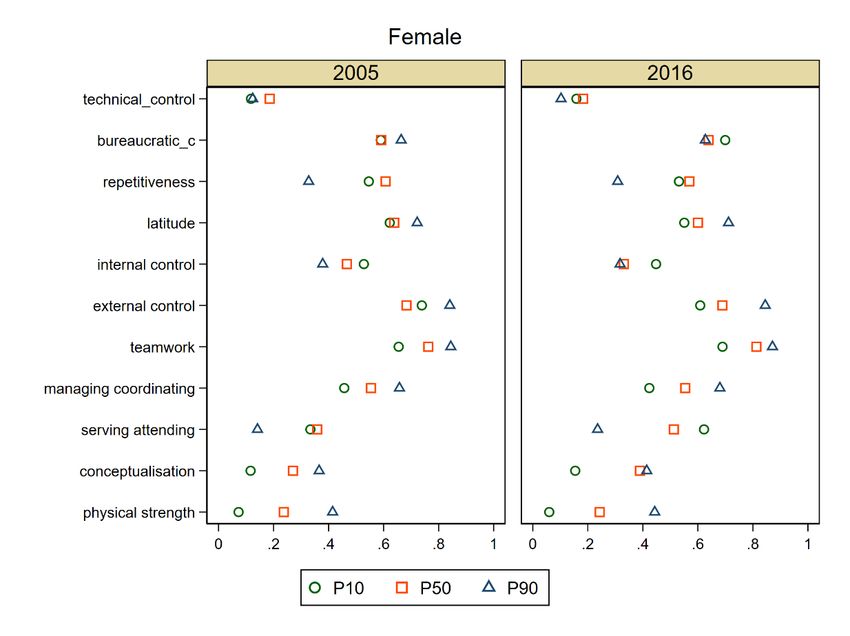
Routine-biased technical change can fail: evidence from France

Exploiting the possibility to measure if and to what extent tasks change at the individual level within
jobs over time, we are able to inspect dynamically the tasks profile across wage percentiles.
According to these summary statistics, reported in Table 1 , tasks behave as expected across relevant
deciles in terms of content, with low-wage earners being characterised by more physical tasks, less
conceptualisation and especially a substantially lower level of managing role which strongly
decreases over time. Looking at methods of work, top earners are endowed with higher level of
autonomy in terms of latitude but not as for direct control. Among routine indicators top earners are
subject to less repetitiveness but higher standardisation compared to low-wage earners. However,
over time, interesting dynamics emerge: first, routine increases for all groups although different
indicators show different patterns. For instance, the relative increase in repetitiveness results in a U-
shaped pattern, while a reverse U-shaped pattern is detected for bureaucratic control, where the
indicator increases more at the median of the wage distribution. Changes in technical control are
substantially negative at the top of the wage distribution while positive at the bottom. Finally, direct
control (both internal and external) decreases for all groups, while latitude slightly increases for
median and top earners. Putting together evidence on organisational practices, it is as if bureaucratic
control (routine) replaces direct supervision exerted by the hierarchy. Managerial roles keep
concentrating at the top of the wage distribution which is in line with previous finding.

Table 1: tasks profile by wage decile and relative change, 2005-2016

 10th 50th 90th Delta 2016-2005(%)
 2005 2016 2005 2016 2005 2016 10th 50th 90th
physical strength 0.468 0.487 0.491 0.458 0.291 0.298 4.1 -6.7 2.5
conceptualisation 0.626 0.674 0.734 0.752 0.867 0.883 7.7 2.6 1.9
serving attending 0.691 0.810 0.665 0.717 0.707 0.696 17.2 7.7 -1.4
managing
coordinating 0.051 0.042 0.208 0.204 0.376 0.412 -17.0 -1.7 9.6
teamwork 0.594 0.701 0.789 0.826 0.832 0.876 17.9 4.7 5.4
latitude 0.531 0.502 0.559 0.574 0.643 0.673 -5.5 2.7 4.8
control int 0.737 0.688 0.652 0.604 0.740 0.737 -6.6 -7.4 -0.5
control ext 0.519 0.478 0.417 0.287 0.367 0.300 -7.9 -31.2 -18.3
repetitiveness 0.345 0.642 0.339 0.469 0.135 0.226 86.1 38.2 67.7
technical control 0.052 0.067 0.136 0.140 0.094 0.075 30.7 3.1 -19.6
bureaucratic
control 0.105 0.140 0.279 0.386 0.322 0.384 33.9 38.3 19.2
Source: Authors’ elaboration on EC data.

Considering the wage distribution overall, it is useful to present the wage inequality trajectories over
the decade under analysis. The Gini coefficient for both male and female workers slightly reduce from
2005 to 2016 - we have a Gini reduction in the population of about 1 point (from 0.255 to 0.245).
Routine-biased technical change can fail: evidence from France

This trend is mostly explained by the increase in the log-wage of the bottom 10th percentile,
especially for women who slightly reduce their distance from both the median and top 90th. On the
contrary, the distance between the median and top 90 is merely constant.

 4. Econometric and statistical methods

To understand if and to what extent the employment structure, tasks, individual characteristics and
labour market institutions affect wages and their dispersion over time, we rely on the contribution of
Firpo, Fortin and Lemieux (2018; 2011) which allows, by means of a Recentred Influence Function
(RIF), to estimate the effect of a set of covariates beyond the mean.
In our case, the effects of tasks as well as individual and institutional characteristics may vary across
the log-wage distribution. The existing techniques i.e., conditional quantile regression introduced by
(Koenker & Bassett, 1978) permit such estimation, but the RIF-OLS method - or unconditional quantile
regression (UQR) - introduced by Firpo, Fortin and Lemieux (2009, henceforth FFL), has a clear
significant advantage. Indeed, it enables to estimate the (marginal) effects of explanatory variables
on the unconditional distribution of y and how this affects distribution statistics like Gini index,
quantiles, variances, etc. The unconditional effect is important because it permits to answers
questions about how the covariates’ coefficient change along the wage distribution. In our case, for
example, to what extent different tasks affect the wage distributions at different points (wage
deciles), without conditioning the wage distribution on education (or any other covariate). In other
words, the high or low-wage worker is identified in “absolute” way on the log-wage distribution and
is not redefined conditional on covariates and, hence, on different subgroups, as in the standard
conditional quantile regression.
More formally, the building block of the RIF-OLS is the influence-function. Considering a given
distributional statistic v(Fy) – bottom 10th, median and top 90th percentile as well 50/10 and 90/50
ratios in our case – computed on the distribution F, the influence function of v(Fy) represents the
effect of an infinitesimal change in the function F at a given point y (of our log-wage distribution).
Hampel (1974) provides a formal definition of the influence function (IF) as:

 ((1 − ) + ∆ ) − ( )
 ( ; , ) = (1)

FFL (2009) recentred the function adding back the distributional statistic to the IF:

 ( ; , ) = ( ) + ( ; , ) (2)

and demonstrate how the distributional statistic v(Fy) can be written in terms of expectations and,
applying the law of iterated expectations, also in terms of expectations of the conditional RIF:

 ( ) = ∫ [ ( ; , ) | = ] ∗ ( ) (3)
Routine-biased technical change can fail: evidence from France

According to equation (3) when covariates are present and we are interested in understanding their
effect on a distributional statistic v(Fy), it is necessary to integrate over the [ ( ; , ) | ].
To do so, FFL (2009) propose a simple OLS regression, obtaining the RIF-OLS:

 ( ) = [ ( ; , )] = ( ) + ( ) (4)

where coefficient can be interpreted unconditionally, in FFL’s (2009) terms, the unconditional partial
effect (UPE). However, the interpretation of our coefficients is different from the standard OLS
regression: represents the expected change in our distributional statistic if the (unconditional)
average of X increases by one unit.

 5. Empirical results

In this section, we present estimation results of the RIF-OLS by gender and year over main percentiles
(10th, 50th and 90th) in which log monthly wage is regressed on the rich set of explanatory variables
capturing three main set of covariates: tasks profile, individual and job characteristics, and contractual
and working time arrangements5, used as proxy for labour market institutions. The analysis is run
over the full sample (private and public employees) exploiting variation at the job level, that is
controlling for the interaction between occupations and economic sectors classified respectively at
the PCS 2003 three digit and nine sectors, aggregated according to Section 3. Those occupations with
less than thirty observations have been recoded to the nearest code.
The choice to perform separate analysis by gender is coherent with most recent literature on
differences in tasks among men and women. Such differences arise not only because of gender
occupational segregation but also within the same occupation (Autor, 2013; West, 1990). Fana et al.
(2021), using data from the Enquête Complémentaire Emploi: Conditions de travail, show that
difference in tasks allocation within the same job are substantial and persist over time also for the
case of France.
According to our evidence, for both male and female workers, the effect on wages across the
distribution is mostly driven by experience within the firm, contractual arrangement and working time
and to a lower extent by education and nationality. Tasks’ indicators if any play a very minor role in
explaining differences in wages within jobs along the distribution.
More precisely, estimates at the beginning of the period for men – first three columns of Table 2 –
show that being a part-time worker has a substantial negative impact6 along the distribution with
major effect at the bottom, while being permanent instead of temporary worker has a positive effect
only for workers belonging to the 10th percentile. Seniority is another relevant factor explaining wage
differentials, especially at the bottom and at the median of the distribution with monotonic effect as
tenure increases. However, returns at the top of the distribution due to seniority within the firm show
a positive and significant effect only in the case of more than ten years compared to less than one

5
 Table A 4 in Appendix reports the distribution of each set of covariates at relevant wage percentiles (10 th,
50th and 90th percentile) in both points in time.
6
 After controlling for the number of hours worked (coefficients not reported).
Routine-biased technical change can fail: evidence from France

year experience. As expected, the effect of formal education is monotonic within each percentile but
significant only in the case of upper tertiary education for the 90th percentile.
With respect to tasks indicators, challenging results emerge. First, routine indicators (and each of its
component) have a minor effect if any on wages. Indeed, at the bottom 10th the most relevant effect,
associated to routine, is about 0.02% (0.017/0.765) of the part-time coefficient. More interestingly,
a negative effect on wage is found only for repetitiveness both at the median and top of the
distribution. It is worth recalling that we are exploiting differences within jobs, all of which are
characterised by a certain degree of repetitiveness, even at the top. Moreover, as for bureaucratic
control, an increase of one standard deviation in the average score7 of monitoring and tracking
devices increases rather than decreases wages at the bottom of the distribution, while being subject
to predefined objectives has a positive effect at the median and top of the wage distribution. The
latter result is somehow expected considering that our wage measure includes performance-based
pay (although we cannot distinguish whether at the individual, team, or firm level). Increasing the
level of hierarchical authority within the organisation (proxied by managing/coordinating) has the
expected positive effect on wages, which increases along the distribution.
Finally, we do not find any supporting evidence for the computerisation hypothesis according to which
returns in the middle of the distribution decrease as computerisation expands. For instance, basic ICT
use has no significant effect on wages.
On the contrary, other ICT tools show positive monotonic effects. This seems to be reasonable as in
2005 we have a very low average score of different types of digital devices (0.26). Therefore, their
use guarantees higher returns along the entire wage distributions which increases at the top. For
example, a unit increase in the (unconditional) average score in the use of other ICT tools increases
the log-wage at the median by 5.5 per cent (0.412/7.484) and by 8 per cent at the top 90th. To deepen
the analysis on the relationship between computerisation and routine, we interacted ICT variables
with detailed routine indicators without finding any significant effect nor changes in the sign and
magnitude of single covariates. For robustness, we also run an additional specification restricting the
sample to private employees only, including firm size as additional control which is available only for
the private sector. Once interacting ICT use with firm size, any significant change emerged in terms
of tasks’ association to log-wage. Furthermore, the use of other ICT tools guarantees additional higher
returns at the top 90th in the larger firms in 2005, coherently with the baseline results. The
significance vanishes in 2016 as the computers and other digital devices spread across all type of
firms and along the entire wage distribution (estimation results are reported in Table A 7 and Table
A 8).
Overall, the same general conclusions drawn for 2005 holds for the analysis in 2016. Two main
differences emerge: first, contractual and part-time work variables lose their statistical significance
at the top of the distribution. Second, basic ICT use turns to be positive and significant at the bottom,
while other digital tools lose their explanatory power. Our interpretation for this evidence is that in
most recent years, relevance for digital information processing comes from the use of
software/applications regardless of the type of physical device. This is in line with an evolutionary
and additive character of technological devices which nowadays allow for the integration of different
software/applications. For example, a mobile phone in 2005 may not support application for

7
 As anticipated, the coefficient of the independent variable represents the expected change in our outcome if the average
of X increases by one unit. We have standardized measures of tasks, therefore we interpret our results as the expected
change in outcome if the average of X increases by one standard deviation.
Routine-biased technical change can fail: evidence from France

scheduling and communication platforms therefore the possibility for information exchange and
processing was possible only when using a desktop or microcomputer.
Turning our attention to the impact of covariates on wages for women, regression results reported
in

Table 3 show very similar estimates in terms of tasks compared to male workers. The most interesting
effect is the positive and significant effect of physical strength at the bottom 10 th. Our intuition is
that this effect results from the jobs clustering by gender. In other words, women working in male-
jobs obtain higher returns compared to women employed in female-jobs. However, all the tasks’
coefficients are all around 0.1% of the part-time effect, implying a very marginal role in our model
specification.
Seniority within the firm has a positive and monotonic effect both for female workers belonging to
the 10th and 50th percentiles. Working part time has, as expected, a negative and significant effect
which decreases as one moves from the bottom to the top of the wage distribution. However, the
part-time effect is much weaker compared to male counterpart i.e., it seems that males have more
to lose compared to women. Nonetheless, this basically reflects the worse starting conditions of
women who are more concentrated in atypical form of employment.
Individual characteristics matter as well. In particular, higher levels of education have higher returns
at each point of the distribution although they are not necessarily significant: only holding a
Baccalauréat plus two years of tertiary education or upper-level tertiary education (four or more
years) matter. As expected, returns to education are higher for top wage earners. Finally, being
foreigners and in particular naturalised French citizen reduce wage more at the bottom than at the
top. Also for female workers, the comparison between 2005 and 2016 results into minor differences
not reversing any of the argument presented above.
Routine-biased technical change can fail: evidence from France

Table 2: RIF OLS Male by relevant percentiles, 2005 and 2016.
 2005 2016

 10th 50th 90th 10th 50th 90th

Tasks

digital monitoring 0.017** 0.007 -0.001 0.036*** 0.01 -0.01

objectif -0.000 0.013** 0.022* 0.018 0.012 0.021

technical_control -0.002 0.005 0.012 0.014 0.017* 0.009

repetitiveness -0.001 -0.013* -0.019** -0.01 -0.008 -0.02

managing_coordinating 0.029*** 0.03*** 0.049*** 0.013 0.041*** 0.059***

physical_strength 0.010 -0.037*** -0.032** -0.016 -0.021* -0.05**

basic_ict 0.031 -0.033 -0.035 0.270*** 0.108 0.014

others 0.278*** 0.412*** 0.661*** -0.01 0.129 -0.106

Contractual arrangements

Part-Time=1 -0.765*** -0.235*** -0.156** -0.825*** -0.243*** 0.136

permanent=1 0.248*** -0.013 0.01 0.253*** 0.041 0.024

Tenure:

between 1 and 5 ys 0.09** 0.047** -0.003 0.031 0.039 0.073

between 5 and 10 ys 0.194*** 0.101*** 0.039 0.113* 0.04 0.049

>10 ys 0.273*** 0.240*** 0.165*** 0.149** 0.175*** 0.242***

Individual characteristics

Aucun diplÔme -0.045* -0.039** -0.007 -0.072 -0.037 0.039

Bac tech ou profes. -0.04 -0.031 0.056 -0.02 0.005 0.031

Bac général brevet
supérieur -0.056* -0.01 0.065 0.014 0.040 0.01

Bac+2 -0.002 0.002 0.051 -0.007 0.060* -0.02

Bac+3 ou Bac+4 0.013 -0.014 0.130 -0.045 0.013 -0.075

Dip. supérieur À bac+4 0.033 0.028 0.193* 0.058 0.092** 0.170

Naturalized French 0.01 -0.041 -0.055 0.004 0.034 0.051

Foreigner 0.01 0.027 -0.026 -0.073 -0.027 -0.112

Constant 7.702*** 7.634*** 7.368*** 7.725*** 7.864*** 7.815***

Region FE Yes Yes Yes Yes Yes Yes

Job FE Yes Yes Yes Yes Yes Yes

R-squared 0.404 0.495 0.404 0.522 0.484 0.414

N 6103 6103 6103 6265 6265 6265

Rif-Mean 7.109 7.484 8.084 7.093 7.515 8.056
Routine-biased technical change can fail: evidence from France

Table 3: RIF OLS Female at relevant percentiles, 2005 and 2016
 2005 2016

 10th 50th 90th 10th 50th 90th

Tasks

digital monitoring -0.003 0..025*** -0.002 0.041* 0.018** 0.013

objectif 0.012 0.013* 0.023* -0.032 0.009 0.029*

technical control 0.026 0.007 -0.004 0.065* -0.005 -0.027*

repetitiveness 0.017 -0.014* -0.018** -0.031 -0.029*** -0.019

managing coordinating 0.010 0.023*** 0.065*** -0.0121 0.010 0.075***

physical strength 0.046* -0.014* -0.009 0.099*** -0.023* -0.027

Basic ict 0.039 0.293*** -0.021 0.047 0.174** 0.015

others -0.264 -0.249 0.256 0.399 0.06 0.483**

Contractual arrangements

part-Time=1 -0.294*** -0.204*** -0.145*** -0.454*** -0.165*** -0.049

permanent=1 0.150** -0.029 -0.044* 0.405*** 0.095*** 0.063*

Tenure:

between 1 and 5 ys 0.404** 0.073*** -0.006 0.205 -0.013 -0.002

between 5 and 10 ys 0.489*** 0.156*** 0.019 0.299** 0.057* 0.035

>10 ys 0.576*** 0.270*** 0.209*** 0.360*** 0.169*** 0.128**

Individual characteristics

Aucun diplôme -0.116* -0.017 -0.015 -0.217 -0.030 0.036

Bac tech ou profes. 0.028 -0.016 0.032 -0.059 -0.025 -0.001

Bac général brevet
supérieur 0.07 0.024 0.057* -0.023 -0.025 -0.01

Bac+2 0.109* 0.07*** 0.074* 0.104 -0.002 0.025

Bac+3 ou Bac+4 0.107 0.056** 0.07 0.159 0.034 0.02

Dip. supérieur à bac+4 0.120 0.120*** 0.313*** 0.100 0.081** 0.152*

Naturalized French -0.193* -0.066* -0.118*** -0.176 0.087* 0.062

Foreigner -0.104 -0.087** -0.071 -0.242 -0.02 -0.057

Constant 3.804*** 7.195*** 7.710*** 3.952*** 7.125*** 7.391***

Region FE Yes Yes Yes Yes Yes Yes

Job FE Yes Yes Yes Yes Yes Yes

R-squared 0.39 0.522 0.377 0.448 0.538 0.43

N 6787 6787 6787 9105 9105 9105
You can also read