Role of combining neutrophil to lymphocyte ratio and pretreatment body mass index in predicting progression free survival in patients with ...
←
→
Page content transcription
If your browser does not render page correctly, please read the page content below

EXPERIMENTAL AND THERAPEUTIC MEDICINE 21: 526, 2021

            Role of combining neutrophil‑to‑lymphocyte ratio and
                 pretreatment body mass index in predicting
                  progression‑free survival in patients with
             non‑small cell lung cancer treated with nivolumab
            RADU DRAGOMIR1, ADELINA SILVANA DRAGOMIR2, ALINA NEGRU3, SORIN SĂFTESCU4,
            DOREL POPOVICI4, MICHAEL SCHENKER5, RALUCA LUPUȘORU6,7 and ȘERBAN NEGRU4

        1
        Department of Obstetrics and Gynecology, ‘Victor Babeș’ University of Medicine and Pharmacy of Timisoara,
   300041 Timisoara; 2Department of Oncology, ‘Carol Davila’ University of Medicine and Pharmacy, 020021 Bucharest;
         Departments of 3Cardiology, 4Oncology, ‘Victor Babeș’ University of Medicine and Pharmacy of Timisoara,
        300041 Timisoara; 5Department of Oncology, University of Medicine and Pharmacy Craiova, 200349 Craiova;
   6
    II Department of Internal Medicine, Gastroenterology and Hepatology Discipline, 7Department of Functional Sciences,
        Medical Informatics and Biostatistics Discipline, Center for Modeling Biological Systems and Data Analysis,
              ‘Victor Babeș’ University of Medicine and Pharmacy of Timisoara, 300041 Timisoara, Romania

                                   Received December 24, 2020; Accepted January 26, 2021

                                                  DOI: 10.3892/etm.2021.9958

Abstract. Identifying markers capable of predicting                23 weeks, while in subjects with NLR4 ≥3, PFS was 19 weeks
outcomes in lung cancer patients treated with nivolumab            (P= 0.33). Multivariate analysis for the association with PFS
represents a growing research interest. The combination of         showed that baseline NLR, male sex and BMI were associated
neutrophil‑to‑lymphocyte ratio (NLR) and body mass index           independently, thus we could develop a significant statistical
(BMI) may help predict treatment efficacy. Thus, the present       model [AUROC= 0.76, 95% CI (0.45‑0.89), P= 0.03], a new
study aimed to investigate the influence of NLR and BMI on         predictive score for PFS. The assessment of NLR and BMI
progression‑free survival (PFS) in non‑small‑cell lung cancer      may represent simple and useful biomarkers; combining them
(NSCLC) patients treated with nivolumab. A retrospec‑              and taking into consideration the male sex may predict PFS in
tive study was made on 80 patients with NSCLC that were            patients with advanced NSCLC treated with nivolumab.
treated with nivolumab at the OncoHelp Oncology Center,
Timisoara, Romania after platinum‑based chemotherapy,              Introduction
from January 2018 to April 2020. Patients were administered
nivolumab at a dose of 3 mg/m2 or 240 mg total dose, every         Lung cancer (LC) remains the leading cause of cancer‑related
2 weeks. The predictive impact of NLR (baseline at 2 and           mortality and the most common diagnosed cancer worldwide,
4 weeks after the start of nivolumab) and BMI for disease          in both sexes and for all age groups; in 2018 an estimated
progression was assessed. Median PFS for subjects with             1.7 million deaths, with an incidence of approximately
NLR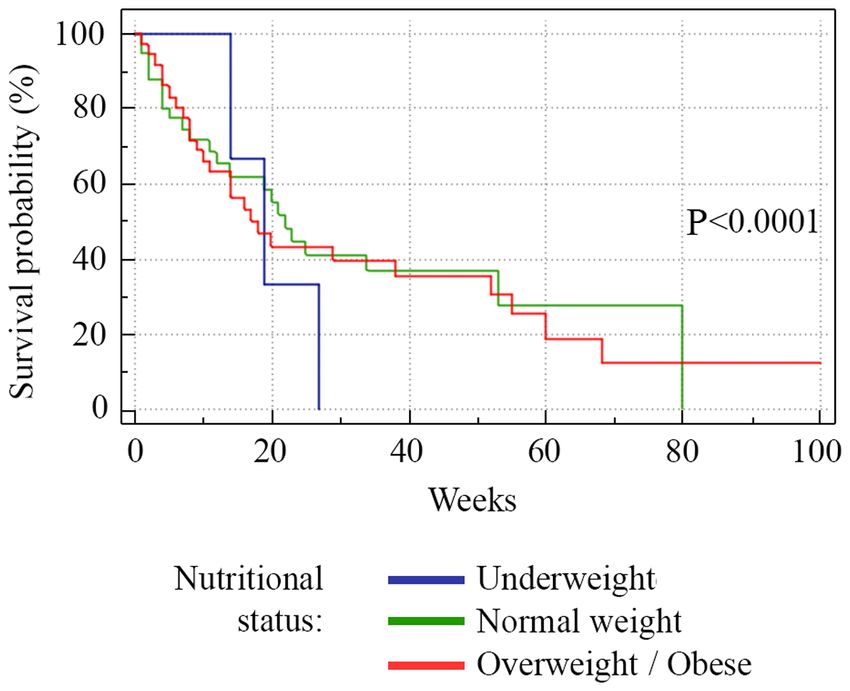
2             DRAGOMIR et al: NLR AND PRETREATMENT BMI FOR PREDICTING PFS IN NIVOLUMAB-TREATED NSCLC

various cancer sites have concluded that systemic inflamma‑         Statistical analysis. MedCalc software for Windows
tion, indexed commonly by the neutrophil‑to‑lymphocyte ratio        (v. 19.2.0) (https://www.medcalc.org/) and the R software
(NLR), calculated as the ratio between the absolute neutrophil      packages (v.3.3) (R Foundation for Statistical Computing,
count and the absolute lymphocyte count in the peripheral           Vienna, Austria, https://cran.r‑project.org/) were used for
blood, is associated with a poorer prognosis in patients with       statistical computing. The Kolmogorov‑Smirnov test was
cancer (5,6).                                                       used for testing the distribution of numerical variables.
    Another key factor in the development and thera‑                Qualitative variables are presented as numbers and percent‑
peutic response in cancer is represented by the body mass           ages. Parametric tests (t‑test, ANOVA) were used for the
index (BMI), where obesity appears to influence the immune          assessment of differences between numerical variables with
system and to induce a state of low‑grade inflammation (7).         normal distribution and nonparametric tests (Mann‑Whitney
Furthermore, Cortellini et al found that overweight/obese           or Kruskal‑Wallis tests) for variables with non‑normal
patients who suffer from different types of diseases, including     distribution. The Chi‑square (χ²) test was used for comparing
lung cancer, have a better response to anti‑PD‑1/PD‑L1 anti‑        proportions expressed as percentages (‘n’ designates the
bodies (8), a fact also observed in other retrospective studies     total number of patients included in a particular subgroup).
regarding advanced/metastatic melanoma (9,10).                      Univariate and multivariate logistic regression analysis
    The association between inflammatory and nutritional            was performed to assess the association between variables.
status may help predict treatment efficacy and allow patient        Survival curves were calculated with the Kaplan‑Meier
selection for different types of treatment. Therefore, our study    method and differences between groups were assessed with
aimed to investigate the influence of baseline NLR and BMI          the log‑rank test. Multivariate survival analysis was carried
on progression‑free survival (PFS) in NSCLC patients treated        out using the Cox proportional hazards model. For the best
with nivolumab.                                                     threshold, the area under the receiver operating characteristic
                                                                    (AUROC) curve analysis was used, by identifying the optimal
Patients and methods                                                cut‑off values using the Youden index. We considered a
                                                                    P‑value of 0.05 as the threshold for statistical significance
Study population. A retrospective study was carried out on          and a confidence level of 95% for estimating intervals.
80 patients with NSCLC who were treated with nivolumab
after failed response to platinum‑based chemotherapy, from          Results
January 2018 to April 2020, at the OncoHelp Oncology Center,
Timisoara, Romania.                                                 Baseline characteristics. A total of 80 patients were included
    Inclusion criteria were: Patients older than 18 years of age,   in the study (mean age 60.91±8.42, 70% male). Patient charac‑
diagnosed with NSCLC as confirmed by histopathological              teristics are documented in Table I. A total of 54/80 (67.5%)
analysis, who failed first‑line treatment. Exclusion criteria       patients were diagnosed with adenocarcinomas, 20/80 (25.0%)
were patients who did not have the available biochemical            patients with squamous cell carcinoma and 6/80 (7.5%) patients
tests and evaluation of nutritional status. Nivolumab (3 mg/m2      with uncategorized NSCLC. A total of 4/80 (5%) patients
or 240 mg total dose) was administered every 2 weeks until          had epidermal growth factor receptor (EGFR) mutation and
the occurrence of disease progression, unacceptable toxicity,       1/80 (1.2%) patients had echinoderm microtubule‑associated
treatment withdrawal or patient death.                              protein‑like 4‑anaplastic lymphoma kinase (ALK) fusion
    PFS was the time from the start of nivolumab treatment to       gene. The most prevalent nutritional status was normal weight
disease progression or death.                                       (51.2%); 50 subjects (62.5%) had NLR ≥3. Additional charac‑
    All patients gave their informed consent for data collection.   teristics are presented in Table I.
The study protocol was conducted according to the Helsinki              The frequency of nutritional status, evaluated by BMI,
Declaration after the approval by OncoHelp Oncology Center's        showed some differences according to age (P=0.01). Subjects
Ethics Committee (no. 1b/27.04.2020).                               under 65 years had a higher prevalence of normal weight
                                                                    (54%), while subjects over 65 years had a higher prevalence of
Clinical assessment. Clinical assessment, anthropometric            overweight/obese (50%). There were no differences between
and demographic data were collected from the medical                the NLR distribution in subjects under 65 years and subjects
records including: Age, sex, hemogram parameters (leuko‑            over 65 years (70 vs. 50%, P=0.12).
cyte count, neutrophil count, lymphocyte count, platelet
count, hemoglobin value, NLR) at initial diagnosis, after 2         Treatment response and survival analysis. A total of 35% of
and after 4 weeks, pathological diagnosis, tumor stage, treat‑      the patients succumbed to the disease (28/80), 26.2% of the
ment, progression, and death. TNM staging was recorded for          patients had progressive disease (21/80), 32.5% (26/80) had
all patients. The NLR ratio was obtained from the absolute          stable disease and 6.3% (5/80) were hazard (lost from evidence
neutrophil count and the absolute lymphocyte count and for          due to non‑oncological causes or low compliance for treat‑
the first analysis, it was dichotomized according to previous       ment) (Fig. 1). Median PFS was 13 weeks (range 1‑80) (Fig. 2).
literature (11), NLR ≥3 and NLR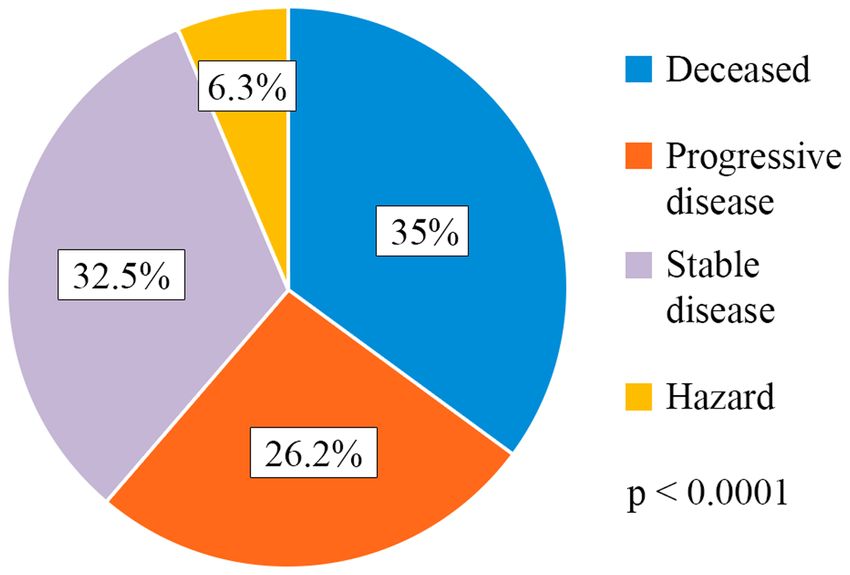
EXPERIMENTAL AND THERAPEUTIC MEDICINE 21: 526, 2021                                                          3

Table I. Baseline characteristics of the NSCLC patients
(N=80).

Parameter                                                  Data values

Age (years), mean ± SD                                     60.91±8.42
Sex (male), n (%)                                           56 (70.0)
BMI (kg/m²), mean ± SD                                     25.03±5.36
NLR ≥3, n (%)
 Yes                                                        50 (62.5)
 No                                                         30 (37.5)
Nutritional status, n (%)
                                                                         Figure 2. Kaplan‑Meier survival analysis. Median PFS was 13 weeks
 Underweight                                                 3 (3.7)     (range 1‑80). The horizontal axis represents PFS measured in weeks and
 Normal weight                                              41 (51.2)    the vertical axis represents the percentage of patients who survived without
 Overweight/obese                                           36 (45.0)    progression at a given time. PFS, progression‑free survival.

Histological type, n (%)
 Adenocarcinoma                                             54 (67.5)
 Squamous cell carcinoma                                    20 (25.0)
 Uncategorized NSCLC                                         6 (7.5)
Targetable driver mutation, n (%)
 EGFR                                                        4 (5.0)
 ALK                                                         1 (1.2)
Stage, n (%)
 1                                                           2 (2.5)
 2                                                           5 (6.2)
 3                                                          25 (31.2)
 4                                                          48 (60.0)
Progressive disease, n (%)
 Yes                                                        21 (26.2)
 No                                                         59 (67.5)    Figure 3. Kaplan‑Meier plots quantifying the effects of NLR on PFS. The
Status, n (%)                                                            horizontal axis represents PFS measured in weeks and the vertical axis
                                                                         represents the percentage of patients who survived without progression at
 Alive                                                      52 (65.0)    a given time, depending on the NLR value. PFS, progression‑free survival;
 Deceased                                                   28 (35.0)    NLR, neutrophil‑to‑lymphocyte ratio.

BMI, body mass index; n, number of observations; NLR, neutro‑
phil‑to‑lymphocyte ratio; NSCLC, non‑small cell carcinoma; EGFR,
epidermal growth factor receptor; ALK, anaplastic lymphoma kinase.

                                                                         Figure 4. Kaplan‑Meier plots quantifying the effects of nutritional status on
                                                                         the PFS in NSCLC patients. The horizontal axis represents PFS measured
                                                                         in weeks and the vertical axis represents the percentage of patients who
                                                                         survived without progression at a given time, depending on the nutritional
              Figure 1. Treatment response distribution.                 status. PFS, progression‑free survival; NSCLC, non‑small‑cell lung cancer.

higher survival rate (P=0.001), while underweight subjects had           Relationship between NLR and PFS. We analyzed initial
a lower survival rate (P=0.0001) (Fig. 4).                               NLR, NLR at 2 weeks (NLR2) and NLR at 4 weeks (NLR4).
4 DRAGOMIR et al: NLR AND PRETREATMENT BMI FOR PREDICTING PFS IN NIVOLUMAB-TREATED NSCLC Table II. Performance of baseline NLR, NLR2 and NLR4 for predicting PFS. Variable Cut‑off AUROC P‑value Se (%) Sp (%) PPV (%) NPV (%) NLR 3.28 0.55
EXPERIMENTAL AND THERAPEUTIC MEDICINE 21: 526, 2021                                                                                                                    5

Table III. Univariate and multivariate logistic regression model for NLR by clinical characteristics of the NSCLC patients.

                                                                Univariate analysis                                                                          Multivariate analysis
                                             ‑‑‑‑‑‑‑‑‑‑‑‑‑‑‑‑‑‑‑‑‑‑‑‑‑‑‑‑‑‑‑‑‑‑‑‑‑‑‑‑‑‑‑‑‑‑‑‑‑‑‑‑‑‑‑‑‑‑‑‑‑‑‑‑‑‑‑‑‑‑‑‑‑‑‑                     ‑‑‑‑‑‑‑‑‑‑‑‑‑‑‑‑‑‑‑‑‑‑‑‑‑‑‑‑‑‑‑‑‑‑‑‑‑‑‑‑‑‑‑‑‑‑‑‑‑‑‑‑‑‑‑‑‑‑‑‑‑‑‑-‑‑‑‑‑‑‑‑‑
Variables                                      OR (95% CI)                                               P‑value                              OR (95% CI)                                               P‑value

Age over 65 years                            0.42 (0.16‑1.09)                                               0.04                             0.89 (0.65‑1.2)                                              0.48
Male sex                                     1.05 (0.38‑2.91)                                               0.03                             1.28 (0.54‑1.8)                                              0.91
BMI value                                    0.96 (0.58‑1.56)                                               0.01                             1.01 (0.23‑1.9)                                             0.001
Nutritional status
 Underweight                                    27 (7.1‑30)                                                 0.04                               15 (5.7‑21.3)                                              0.01
 Normal weight                               2.07 (0.82‑5.20)                                               0.11                                     ‑                                                      ‑
 Overweight/obese                            0.60 (0.24‑1.49)                                               0.27                                     ‑                                                      ‑

NSCLC, non‑small cell lung cancer; BMI, body mass index; OR, odds ratio; CI, confidence interval.

Table IV. Univariate and multivariate logistic regression model for PFS by clinical characteristics of the NSCLC patients.

                                                               Univariate analysis                                                                          Multivariate analysis
                                            ‑‑‑‑‑‑‑‑‑‑‑‑‑‑‑‑‑‑‑‑‑‑‑‑‑‑‑‑‑‑‑‑‑‑‑‑‑‑‑‑‑‑‑‑‑‑‑‑‑‑‑‑‑‑‑‑‑‑‑‑‑‑‑‑‑‑‑‑‑‑‑‑‑‑‑                   ‑‑‑‑‑‑‑‑‑‑‑‑‑‑‑‑‑‑‑‑‑‑‑‑‑‑‑‑‑‑‑‑‑‑‑‑‑‑‑‑‑‑‑‑‑‑‑‑‑‑‑‑‑‑‑‑‑‑‑‑‑‑‑‑‑‑‑‑‑‑‑‑‑‑‑
Variables                                      OR (95% CI)                                              P‑value                              OR (95% CI)                                               P‑value

Age over 65 years                           0.86 (0.20‑1.10)                                              0.56                                     ‑                                                        ‑
NLR                                         1.03 (0.37‑2.88)                                              0.001                            1.10 (0.38‑3.12)                                               0.01
Male sex                                    0.80 (0.27‑2.35)                                              0.02                             0.95 (0.86‑1.05)                                               0.04
BMI value                                   0.95 (0.87‑1.01)                                              0.01                             0.96 (0.96‑1.91)                                              0.001
Nutritional status
 Underweight                                1.42 (0.12‑16.5)                                              0.77                                            ‑                                                  ‑
 Normal weight                              1.37 (0.50‑3.76)                                              0.55                                            ‑                                                  ‑
 Overweight/obese                           0.84 (0.28‑2.51)                                              0.75                                            ‑                                                  ‑

PFS, progression‑free survival; NSCLC, non‑small cell lung cancer; BMI, body mass index; OR, odds ratio; CI, confidence interval.

Table V. Univariate and multivariate Cox regression models of factors that may influence patient survival.

                                                       Univariate analysis                                                                          Multivariate analysis
                             ‑‑‑‑‑‑‑‑‑‑‑‑‑‑‑‑‑‑‑‑‑‑‑‑‑‑‑‑‑‑‑‑‑‑‑‑‑‑‑‑‑‑‑‑‑‑‑‑‑‑‑‑‑‑‑‑‑‑‑‑‑‑‑‑‑‑‑‑‑‑‑‑‑‑‑‑‑‑‑‑‑‑‑‑‑‑‑‑‑‑    ‑‑‑‑‑‑‑‑‑‑‑‑‑‑‑‑‑‑‑‑‑‑‑‑‑‑‑‑‑‑‑‑‑‑‑‑‑‑‑‑‑‑‑‑‑‑‑‑‑‑‑‑‑‑‑‑‑‑‑‑‑‑‑‑‑‑‑‑‑‑‑‑‑‑‑‑‑‑‑‑‑‑‑-‑‑‑‑‑‑‑
                                                                  95% CI                                                                                          95% CI
                             ‑‑‑‑‑‑‑‑‑‑‑‑‑‑‑‑‑‑‑‑‑‑‑‑‑‑‑‑‑‑‑‑‑‑‑‑‑‑‑‑‑‑‑‑‑‑‑‑‑‑‑‑‑‑‑‑‑‑‑‑‑‑‑‑‑‑‑‑‑‑‑‑‑‑‑‑‑‑‑‑‑‑‑‑‑‑‑‑‑‑    ‑‑‑‑‑‑‑‑‑‑‑‑‑‑‑‑‑‑‑‑‑‑‑‑‑‑‑‑‑‑‑‑‑‑‑‑‑‑‑‑‑‑‑‑‑‑‑‑‑‑‑‑‑‑‑‑‑‑‑‑‑‑‑‑‑‑‑‑‑‑‑‑‑‑‑‑‑‑‑‑‑‑‑‑-‑‑‑‑‑‑
Variables                     HR                    Lower                     Upper                     P‑value             HR                    Lower                     Upper                      P‑value

Age (years)
6 DRAGOMIR et al: NLR AND PRETREATMENT BMI FOR PREDICTING PFS IN NIVOLUMAB-TREATED NSCLC of solid tumors (12), while the absence of inflammation could category presented a significantly lower PFS, intersecting with favor outcomes, even though, in this situation, tumors could what Cortellini et al revealed in their retrospective obser‑ develop unnoticed (13,14). Accordingly, NLR, as an indi‑ vational study, which included NSCLC patients receiving cator of systemic inflammation associated with alterations ICIs (41). in peripheral blood leukocytes, could play a significant role The biological basis that stands between the association in various cancers and it has been extensively studied in this of BMI and cancer survival following immunotherapy is just matter (6,15). An integral part of the innate immune system at the beginning of understanding. The obese state induces a is represented by neutrophils, with both immune‑suppressive low‑grade systemic inflammation and an impaired immune and tumor‑promoting roles being described (16‑20). Beside response, including T‑cell dysfunction and a growing number the fact that neutrophils produce chemokines and cytokines of exhausted PD‑1‑presenting T‑cells in adipose tissue and that influence tumor progression, they can also suppress the tumor microenvironment via a leptin‑dependent mechanism, immune activity of lymphocytes to further promote metas‑ which are known to have a strong affinity for PD‑L1, a ligand tasis (21‑23). Lymphocytes have been proven to exhibit a located on tumor cells, meant to further suppress T‑cell vital role in host cell‑mediated immune regulation and their function (7). Based on this hypothesis, nivolumab, which increased infiltration into tumors has been linked with a better acts as an anti‑PD‑1 antibody, blocking the bonding between response to cytotoxic treatment and progression in cancer PD‑L1/PD‑1 molecules, might induce a better response in patients (24,25). Furthermore, tumor‑infiltrating lymphocytes patients with increased BMI and an established PD‑1 T‑cell (TILs) have been shown to have prognostic significance in exhausted state. cancer clinical outcomes (26,27). Considering that immune Despite not being the main aim of the present study, our checkpoint inhibitors (ICIs) block negative regulators of T‑cell statistical analysis revealed that the male sex may represent a function, thus enhancing antitumor immunity (28), an altera‑ poor predictive factor for PFS, a fact that proves to be inconsis‑ tion in peripheral blood leukocytes in favor of neutrophils, tent with other studies that showed variation in ICI outcomes with a commonly associated lymphopenia, could influence the related to sex (10,42,43). At the same time, according to efficacy of ICIs. Bagley et al demonstrated that higher pretreat‑ univariate and multivariate logistic regression analysis, male ment NLR in patients with advanced NSCLC treated with sex, NLR and BMI were found to be associated with PFS. nivolumab was independently associated with lower PFS and Consequently, we proposed a new predictive score for PFS. overall survival (OS) (29). However, the pre‑specified cut‑off PFS‑NSCLC Score has the ability to rule‑out the poor outcome value for NLR used in this study was 5, based on the validation at a cut‑off value of more than 1.32 with a specificity of 90.4% of a previous study that assessed patients with metastatic mela‑ and a negative predictive value of 95.7%. noma treated with ipilimumab (30). Conversely, in an Asian Nevertheless, our study has its limitations. The number of cohort, Nakaya et al did not report a significant association patients in our cohort was relatively moderate with a few dispro‑ between baseline NLR and median PFS, but revealed that a portions regarding baseline characteristics, such as sex, NLR and NLR
EXPERIMENTAL AND THERAPEUTIC MEDICINE 21: 526, 2021                                                  7

Availability of data and materials                                      10. McQuade JL, Daniel CR, Hess KR, Mak C, Wang DY, Rai RR,
                                                                            Park JJ, Haydu LE, Spencer C, Wongchenko M, et al: Association
                                                                            of body‑mass index and outcomes in patients with metastatic
The data generated or analyzed during this study are included               melanoma treated with targeted therapy, immunotherapy, or
in this published article or are available from the corresponding           chemotherapy: A retrospective, multicohort analysis. Lancet
                                                                            Oncol 19: 310‑22, 2018.
author on reasonable request.                                           11. Ozyurek BA, Ozdemirel TS, Ozden SB, Erdogan Y, Kaplan B
                                                                            and Kaplan T: Prognostic value of the neutrophil to lymphocyte
Authors' contributions                                                      ratio (NLR) in lung cancer cases. Asian Pac J Cancer Prev 18:
                                                                            1417‑1421, 2017.
                                                                        12. Hanahan D and Weinberg RA: Hallmarks of cancer: The next
RD and RL organized the study, analyzed and interpreted the                 generation. Cell 144: 646‑674, 2011.
study data and wrote the manuscript. ASD, AN, SS, DP and                13. Fouad TM, Kogawa T, Liu DD, Shen Y, Masuda H, El‑Zein R,
                                                                            Woodwa rd WA, Chavez‑MacGregor M, Alva rez R H,
MS analyzed the data and helped to draft the findings and                   Arun B, et al: Erratum: Overall survival differences between
critically reviewed the manuscript; SN interpreted the data                 patients with inflammatory and noninflammatory breast cancer
and critically reviewed the manuscript for intellectual content.            presenting with distant metastasis at diagnosis. Breast Cancer
                                                                            Res Treat 152: 407‑416, 2015.
All the authors have read and approved the final version of the         14. Faur CI, Pop DL, Motoc AGM, Folescu R, Grigoraş ML,
manuscript for publication.                                                 Gurguş D, Zamfir CL, Iacob M, Vermeşan D, Deleanu BN, et al:
                                                                            Large giant cell tumor of the posterior iliac bone‑an atypical
                                                                            location. A case report and literature review. Rom J Morphol
Ethics approval and consent to participate                                  Embryol 61: 247‑252, 2020.
                                                                        15. Guthrie GJ, Charles KA, Roxburgh CS, Horgan PG,
All patients provided written informed consent for the study                McMillan DC and Clarke SJ: The systemic inflammation‑based
                                                                            neutrophil‑lymphocyte ratio: Experience in patients with cancer.
participation and data collection. The study protocol was                   Crit Rev Oncol Hematol 88: 218‑230, 2013.
conducted according to the principles of the Declaration of             16. Hao S, Andersen M and Yu H: Detection of immune suppressive
Helsinki after the approval by OncoHelp Oncology Center's                   neutrophils in peripheral blood samples of cancer patients. Am
                                                                            J Blood Res 3: 239‑245, 2013.
Ethics Committee (no. 1b/27.04.2020).                                   17. Pillay J, Kamp VM, van Hoffen E, Visser T, Tak T, Lammers JW,
                                                                            Ulfman LH, Leenen LP, Pickkers P and Koenderman L: A subset
Patient consent for publication                                             of neutrophils in human systemic inflammation inhibits T cell
                                                                            responses through mac‑1. J Clin Invest 122: 327‑336, 2012.
                                                                        18. Pillay J, Tak T, Kamp VM and Koenderman L: Immune suppres‑
Not applicable.                                                             sion by neutrophils and granulocytic myeloid‑derived suppressor
                                                                            cells: Similarities and differences. Cell Mol Life Sci 70:
                                                                            3813‑3827, 2013.
Competing interests                                                     19. Uribe‑Querol E and Rosales C: Neutrophils in cancer: Two sides
                                                                            of the same coin. J Immunol Res 2015: 983698, 2015.
The authors declare that they have no competing interests.              20. Cools‑Lartigue J, Spicer J, Najmeh S and Ferri L: Neutrophil
                                                                            extracellular traps in cancer progression. Cell Mol Life Sci 71:
                                                                            4179‑4194, 2014.
References                                                              21. Galdiero MR, Garlanda C, Jaillon S, Marone G and Mantovani A:
                                                                            Tumor associated macrophages and neutrophils in tumor progres‑
 1. World Health Organization. Lung cancer. Available at:                   sion. J Cell Physiol 228: 1404‑1412, 2013.
    http://globocan.iarc.fr/Pages/fact_sheets_cancer.aspx. Accessed     22. Coffelt SB, Kersten K, Doornebal CW, Weiden J, Vrijland K,
    June 4, 2020                                                            Hau CS, Verstegen NJ, Ciampricotti M, Hawinkels LJ, Jonkers J
 2. Inamura K: Lung cancer: Understanding its molecular pathology           and de Visser KE: IL‑17‑producing γδ T cells and neutrophils
                                                                            conspire to promote breast cancer metastasis. Nature 522:
    and the 2015 WHO classification. Front Oncol 7: 193, 2017.              345‑348, 2015.
 3. Onoi K, Chihara Y, Uchino J, Shimamoto T, Morimoto Y,               23. Fridlender ZG, Albelda SM and Granot Z: Promoting metastasis:
    Iwasaku M, Kaneko Y, Yamada T and Takayama K: Immune                    Neutrophils and T cells join forces. Cell Res 25: 765‑766, 2015.
    checkpoint inhibitors for lung cancer treatment: A review. J Clin   24. Gooden MJ, de Bock GH, Leffers N, Daemen T and Nijman HW:
    Med 9: 1362, 2020.                                                      The prognostic influence of tumour‑infiltrating lymphocytes in
 4. Malhotra J, Jabbour SK and Aisner J: Current state of immu‑             cancer: A systematic review with meta‑analysis. Br J Cancer 105:
    notherapy for non‑small cell lung cancer. Transl Lung Cancer            93‑103, 2011.
    Res 6: 196‑211, 2017.                                               25. Sarraf KM, Belcher E, Raevsky E, Nicholson AG, Goldstraw P
 5. Han F, Liu Y, Cheng S, Sun Z, Sheng C, Sun X, Shang X, Tian W,          and Lim E: Neutrophil/lymphocyte ratio and its association with
    Wang X, Li J, et al: Diagnosis and survival values of neutro‑           survival after complete resection in non‑small cell lung cancer.
    phil‑lymphocyte ratio (NLR) and red blood cell distribution width       J Thorac Cardiovasc Surg 137: 425‑428, 2009.
    (RDW) in esophageal cancer. Clin Chim Acta 488: 150‑158, 2019.      26. Geng Y, Shao Y, He W, Hu W, Xu Y, Chen J, Wu C and Jiang J:
 6. Templeton AJ, McNamara MG, Šeruga B, Vera‑Badillo FE,                   Prognostic role of tumor‑infiltrating lymphocytes in lung cancer:
    Aneja P, Ocaña A, Leibowitz‑Amit R, Sonpavde G, Knox JJ,                A meta‑analysis. Cell Physiol Biochem 37: 1560‑1571, 2015.
    Tran B, et al: Prognostic role of neutrophil‑to‑lymphocyte ratio    27. Zeng DQ, Yu YF, Ou QY, Li XY, Zhong RZ, Xie CM and
    in solid tumors: A systematic review and meta‑analysis. J Natl          Hu QG: Prognostic and predictive value of tumor‑infiltrating
    Cancer Inst 106: dju124, 2014.                                          lymphocytes for clinical therapeutic research in patients with
 7. Woodall MJ, Neumann S, Campbell K, Pattison ST and                      non‑small cell lung cancer. Oncotarget 7: 13765‑13781, 2016.
    Young SL: The effects of obesity on anti‑cancer immunity and        28. Pardoll DM: The blockade of immune checkpoints in cancer
    cancer immunotherapy. Cancers (Basel) 12: 1230, 2020.                   immunotherapy. Nat Rev Cancer 12: 252‑264, 2012.
 8. Cortellini A, Bersanelli M, Buti S, Cannita K, Santini D,           29. Bagley SJ, Kothari S, Aggarwal C, Bauml JM, Alley EW,
    Perrone F, Giusti R, Tiseo M, Michiara M, Di Marino P, et al: A         Evans TL, Kosteva JA, Ciunci CA, Gabriel PE, Thompson JC, et al:
    multicenter study of body mass index in cancer patients treated         Pretreatment neutrophil‑to‑lymphocyte ratio as a marker
    with anti‑PD‑1/PD‑L1 immune checkpoint inhibitors: When                 of outcomes in nivolumab‑treated patients with advanced
    overweight becomes favorable. J Immunother Cancer 7: 57, 2019.          non‑small‑cell lung cancer. Lung Cancer 106: 1‑7, 2017.
 9. Naik GS, Waikar SS, Johnson AE, Buchbinder EI, Haq R,               30. Ferrucci PF, Gandini S, Battaglia A, Alfieri S, Di Giacomo AM,
    Hodi RS, Schoenfeld JD and Ott PA: Complex inter‑relationship           Giannarelli D, Cappellini GC, De Galitiis F, Marchetti P,
    of body mass index, sex and serum creatinine on survival:               Amato G, et al: Baseline neutrophil‑to‑lymphocyte ratio is asso‑
    Exploring the obesity paradox in melanoma patients treated with         ciated with outcome of ipilimumab‑treated metastatic melanoma
    checkpoint inhibition. J Immunother Cancer 7: 89, 2019.                 patients. Br J Cancer 112: 1904‑1910, 2015.
8 DRAGOMIR et al: NLR AND PRETREATMENT BMI FOR PREDICTING PFS IN NIVOLUMAB-TREATED NSCLC
31. Nakaya A, Kurata T, Yoshioka H, Takeyasu Y, Niki M, 40. Kichenadasse G, Miners JO, Mangoni AA, Rowland A,
Kibata K, Satsutani N, Ogata M, Miyara T and Nomura S: Hopkins AM and Sorich MJ: Association between body mass
Neutrophil‑To‑Lymphocyte ratio as an early marker of outcomes index and overall survival with immune checkpoint inhibitor
in patients with advanced non‑small‑cell lung cancer treated with therapy for advanced non‑small cell lung cancer. JAMA Oncol 6:
nivolumab. Int J Clin Oncol 23: 634‑640, 2018. 512‑518, 2020.
32. Wolin KY, Carson K and Colditz GA: Obesity and cancer. 41. Cortellini A, Bersanelli M, Santini D, Buti S, Tiseo M, Cannita K,
Oncologist 15: 556‑565, 2010. Perrone F, Giusti R, De Tursi M, Zoratto F, et al: Another side
33. De Pergola G and Silvestris F: Obesity as a major risk factor for of the association between body mass index (BMI) and clinical
cancer. J Obes 2013: 291546, 2013. outcomes of cancer patients receiving programmed cell death
34. Reeves GK, Pirie K, Beral V, Green J, Spencer E and Bull D; protein‑1 (PD‑1)/Programmed cell death‑ligand 1 (PD‑L1)
Million Women Study Collaboration: Cancer incidence and checkpoint inhibitors: A multicentre analysis of immune‑related
mortality in relation to body mass index in the million women adverse events. Eur J Cancer 128: 17‑26, 2020.
study: Cohort study. BMJ 335: 1134, 2007. 42. Wallis CJD, Butaney M, Satkunasivam R, Freedland SJ, Patel SP,
35. Vucenik I and Stains JP: Obesity and cancer risk: Evidence, Hamid O, Pal SK and Klaassen Z: Association of patient sex with
mechanisms, and recommendations. Ann NY Acad Sci 1271: efficacy of immune checkpoint inhibitors and overall survival
37‑43, 2012. in advanced cancers: A systematic review and meta‑analysis.
36. Tobias DK, Pan A, Jackson CL, O'Reilly EJ, Ding EL, Willett WC, JAMA Oncol 5: 529‑536, 2019.
Manson JE and Hu FB: Body‑Mass index and mortality among 43. Sagerup CMT, Småstuen M, Johannesen TB, Helland A and
adults with incident type 2 diabetes. N Engl J Med 370: 233‑244, Brustugun OT: Sex‑Specific trends in lung cancer incidence and
2014. survival: A population study of 40 118 cases. Thorax 66: 301‑307,
37. Andersen KK and Olsen TS: The obesity paradox in stroke: 2011.
Lower mortality and lower risk of readmission for recurrent
stroke in obese stroke patients. Int J Stroke 10: 99‑104, 2015.
38. Curtis JP, Selter JG, Wang Y, Rathore SS, Jovin IS, Jadbabaie F,
Kosiborod M, Portnay EL, Sokol SI, Bader F, et al: The obesity This work is licensed under a Creative Commons
paradox: Body mass index and outcomes in patients with heart Attribution-NonCommercial-NoDerivatives 4.0
failure. Arch Intern Med 168: 55‑61, 2005, 2008. International (CC BY-NC-ND 4.0) License.
39. Silva TH, Schilithz AO, Peres WAF and Murad LB:
Neutrophil‑lymphocyte ratio and nutritional status are clinically
useful in predicting prognosis in colorectal cancer patients. Nutr
Cancer 72: 1345‑1354, 2020.You can also read