Rethinking Evaluation Practices in Visual Question Answering: A Case Study on Out-of-Distribution Generalization
←
→
Page content transcription
If your browser does not render page correctly, please read the page content below
Rethinking Evaluation Practices in Visual Question Answering:
                                                        A Case Study on Out-of-Distribution Generalization
                                                         Aishwarya Agrawal∗,‡,♦,♥ Ivana Kajić∗,♦ Emanuele Bugliarello∗,4
                                                       Elnaz Davoodi♦ Anita Gergely♦ Phil Blunsom\ Aida Nematzadeh∗,‡,♦
                                                          ♦
                                                              DeepMind ♥ University of Montreal, Mila, Canada CIFAR AI Chair
                                                                    4
                                                                      University of Copenhagen \ University of Oxford
                                                       {aiagrawal,kivana,nematzadeh}@deepmind.com                                 emanuele@di.ku.dk

                                                                  Abstract                                      modalities, abstract reasoning, and commonsense
                                                                                                                and knowledge based reasoning. One of the goals
                                                 Vision-and-language (V&L) models pre-                          of the VQA research has been fostering the de-
                                                 trained on large-scale multimodal data have                    velopment of systems that are able to answer any
arXiv:2205.12191v1 [cs.CL] 24 May 2022

                                                 demonstrated strong performance on vari-
                                                                                                                open-ended question about any image. This moti-
                                                 ous tasks such as image captioning and vi-
                                                 sual question answering (VQA). The qual-                       vation has inspired a fruitful line of research in de-
                                                 ity of such models is commonly assessed                        signing VQA benchmarks (Malinowski and Fritz,
                                                 by measuring their performance on unseen                       2014; Antol et al., 2015; Krishna et al., 2017;
                                                 data that typically comes from the same dis-                   Goyal et al., 2017; Johnson et al., 2017; Gurari
                                                 tribution as the training data. However, we                    et al., 2018; Hudson and Manning, 2019; Singh
                                                 observe that these models exhibit poor out-                    et al., 2019; Marino et al., 2019) and developing
                                                 of-distribution (OOD) generalization on the                    VQA models (Yang et al., 2015; Anderson et al.,
                                                 task of VQA. To better understand the un-
                                                                                                                2018a; Cadène et al., 2019; Lu et al., 2019; Chen
                                                 derlying causes of poor generalization, we
                                                 comprehensively investigate performance of                     et al., 2020; Gan et al., 2020; Cho et al., 2021a;
                                                 two pretrained V&L models under different                      Wang et al., 2022; Li et al., 2021b).
                                                 settings (i.e. classification and open-ended                      In this work, we investigate if today’s strong
                                                 text generation) by conducting cross-dataset                   VQA models can indeed answer any open-ended
                                                 evaluations. We find that these models tend
                                                                                                                question about images or if they are mostly
                                                 to learn to solve the benchmark, rather than
                                                 learning the high-level skills required by the
                                                                                                                suitable for answering questions from the VQA
                                                 VQA task. We also argue that in most cases                     benchmarks they are optimized for. In other
                                                 generative models are less susceptible to                      words, are models learning to solve the task or
                                                 shifts in data distribution, while frequently                  learning to solve the datasets? We believe that
                                                 performing better on our tested benchmarks.                    learning to solve the task of VQA (rather than
                                                 Moreover, we find that multimodal pretrain-                    the benchmarks) is more aligned with the goal of
                                                 ing improves OOD performance in most set-                      building real-world VQA systems.
                                                 tings. Finally, we revisit assumptions un-
                                                 derlying the use of automatic VQA evalua-                         Early work on VQA mostly focused on devel-
                                                 tion metrics, and empirically show that their                  oping models designed to tackle specific VQA
                                                 stringent nature repeatedly penalizes mod-                     benchmarks. While this work has resulted in no-
                                                 els for correct responses.                                     table innovations (e.g., cross-attention, Yang et al.
                                                                                                                2015; Anderson et al. 2018a, multimodal pooling,
                                         1    Introduction                                                      Fukui et al. 2016; Kim et al. 2016; Yu et al. 2017,
                                                                                                                modular networks, Andreas et al. 2015; Hu et al.
                                         Visual Question Answering (VQA) is the task of                         2017, etc.), it is mostly limited to settings where
                                         automatically answering natural language open-                         train and test examples are independent and iden-
                                         ended questions about images. Tackling VQA                             tically distributed (IID). On the other hand, the re-
                                         involves requires multiple skills: language un-                        cent V&L pretraining paradigm (Lu et al., 2019;
                                         derstanding, visual understanding, integrating in-                     Chen et al., 2020; Li et al., 2021b, inter alia) has
                                         formation across the two (vision and language)                         shifted the focus towards building general-purpose
                                             ∗
                                                denotes equal contribution. ‡ denotes equal senior con-
                                                                                                                V&L models that are pretrained on large datasets
                                         tribution. Detailed contributions are reported at the end of the       of image–text pairs and then fine-tuned for spe-
                                         manuscript.                                                            cific tasks such as VQA, image retrieval, referring

                                                                                                            1
expressions, etc. However, these models are also            tings compared to IID ones. Moreover, in most of
examined in IID settings where the fine-tuning and          the cases, image–text pretraining is the least use-
test splits are from the same benchmark. Such IID           ful for OOD settings where models are tested on
evaluation can give a false sense of progress as a          V IZ W IZ, high-lighting the challenges of a real-
significant percentage of it could be due to models         world benchmark such as V IZ W IZ (which is the
relying on spurious correlations in data (Agrawal           only real-world VQA benchmark, with questions
et al., 2016, 2018). In order to better understand          and images curated from the visually impaired).
the capabilities and to test the real-world applica-
                                                               The majority of the work on VQA has focused
bility of current VQA models, we believe we need
                                                            on discriminative modeling by framing question
to examine their out-of-distribution (OOD) gener-
                                                            answering as a classification problem over a fixed
alization capabilities: that is, how they perform on
                                                            number of answer classes curated from the train-
examples drawn from a distribution other than that
                                                            ing or fine-tuning data. Alternatively, more re-
of the training or fine-tuning set.
                                                            cent models rely on generative modeling, where
   In this work, we focus on OOD evalua-                    a model produces a sequence of tokens to form an
tion of current strong pretrained V&L models                answer, with the potential to generate answers that
(V I LBERT and ALBEF; Lu et al., 2019; Li et al.,           were not seen in the fine-tuning data. So, for OOD
2021b). We consider four representative VQA                 generalization where there is likely mismatch be-
benchmarks (VQAV 2, GQA, VG, and V IZ W IZ,                 tween answer classes in fine-tune and test sets,
Agrawal et al. 2018; Hudson and Manning 2019;               we examine if a generative model has the poten-
Krishna et al. 2017; Gurari et al. 2018). In each           tial to be more robust compared to a discrimina-
experiment, we fine-tune our pretrained models              tive one. We examine this hypothesis by evaluat-
on the train split of one of the benchmarks, and            ing both generative and discriminative versions of
test them on the validation split of all benchmarks.        our pretrained models (i.e., V I LBERT and AL-
For a given fine-tuning benchmark (e.g., VQAV 2),           BEF) in IID and OOD settings. In most cases,
this setup results in an IID setting (tested on             we observe that generative models are more ro-
VQAV 2) and three OOD settings (tested on VG,               bust to OOD evaluation. Moreover, the discrimi-
V IZ W IZ, and GQA). We also evaluate our mod-              native setting is especially limiting for real-world
els on the VQA-CP benchmark (Agrawal et al.,                VQA applications (e.g., answering questions of
2018) by fine-tuning and testing on train and test          visually-impaired users) where the set of answers
splits (respectively) of VQA-CP. Note that VQA-             a model needs to produce at test time cannot be
CP train and test splits are OOD by design.                 pre-determined. Thus, we argue for generative
   We first ask if our models indeed generalize to          modeling of VQA where a model is not limited
benchmarks that are different from the fine-tuning          to pre-defined set of answer classes. In fact, in an
data (i.e., the OOD setting): we observe a notable          emerging line of research (Cho et al., 2021b; Wang
drop in performance from IID to OOD settings                et al., 2022; Alayrac et al., 2022), generative mod-
(across models and benchmarks) showing that our             eling has been identified as a promising direction
models mostly learn about a specific VQA bench-             as a way to unify various V&L tasks.
mark as opposed to the general skill of answering              Finally, we examine if the performance of our
questions about images. We also show that this re-          pretrained models is negatively impacted by a
sult is not simply due to a mismatch between the            stringent evaluation metric that matches generated
set of answer classes between the fine-tuning and           strings to a limited number of ground-truth an-
test data, nor due to poor representation of test an-       swers: do we penalize a correct generated answer
swer classes in fine-tuning data.                           because it does not exist in the ground-truth an-
   Recent Transformer-based V&L models are                  swers? This can be potentially more disadvanta-
pretrained on large amounts of image–text data.             geous for the OOD settings where the fine-tuning
While it has been shown that the such pretrain-             and test benchmarks have different answer distri-
ing improves VQA performance in IID settings,               butions. Upon performing human evaluation of
we examine whether pretraining on image–text                model responses, we find that the current standard
data helps in OOD settings. We found that while             VQA accuracy metrics are not robust—they miss
image–text pretraining is helpful in most OOD set-          out on a notable percentage of correct model re-
tings, it is not always more useful in OOD set-             sponses due to their stringent nature. As expected,

                                                        2
this effect is more pronounced for the OOD set-             generalization in vision and NLP, respectively.
tings than the IID ones. Nevertheless, models                  Zero-shot VQA with pretrained models: In
still show poor OOD generalization despite the re-          an emerging line of research (Jin et al., 2021;
duced gap between IID and OOD performance.                  Tsimpoukelli et al., 2021; Alayrac et al., 2022;
   Overall, we observe that the recent pretrained           Dai et al., 2022; Song et al., 2022; Piergiovanni
models, despite their remarkable success in IID             et al., 2022), large-scale pretrained unimodal (vi-
settings, generalize poorly to OOD settings. While          sion only, language only) general-purpose mod-
recent work on generative modeling of VQA is                els (Brown et al., 2020; Radford et al., 2021; Jia
promising, to make progress towards models that             et al., 2021) are repurposed to tackle V&L tasks
learn the general skill of VQA, we encourage                such as VQA in zero-shot or few-shot fashion. In
the community to focus on evaluation paradigms              particular, the unimodal visual and language mod-
that test for OOD generalization, as we believe             els are interconnected via image captioning ob-
such evaluation is more aligned with building real-         jectives. And then this interconnected model is
world VQA systems. Moreover, there is a need to             evaluated for the task of VQA, without ever train-
develop more robust evaluation metrics for VQA              ing the model to answer questions about images.
to more accurately evaluate the quality of current          The model relies on the visual grounding learnt
models, especially in the OOD settings.                     during image captioning training and in-context
                                                            learning (Brown et al., 2020) abilities of pretrained
2   Related Work                                            large language models to tackle VQA at test time.
                                                            While such zero-shot VQA evaluations are a better
Beyond IID evaluation in VQA: Previous studies              test of generalizability than IID evaluations, this
have evaluated the VQA models beyond the IID                line of work does not focus on a thorough analysis
setting for robustness to specific and controlled           of models in zero-shot settings.
aspects such as, novel compositions of seen con-
cepts (Agrawal et al., 2017; Johnson et al., 2017;          3     Experimental Setup
Hudson and Manning, 2019), change in prior dis-
tributions of answers per question type (Agrawal            In this section, we present our framework to exam-
et al., 2018), adversarial examples provided by hu-         ine OOD generalization in VQA. We examine two
mans (Sheng et al., 2021; Li et al., 2021c), consis-        pretrained Transformers across five benchmarks.
tency, negation, simple perturbation in questions
(Jimenez et al., 2022), and controlled shifts in lan-       3.1    Models
guage and vision modalities (Akula et al., 2021).           We evaluate the performance of two architec-
Our focus, on the other hand, is to evaluate for            tures that, fueled by large-scale pretraining, have
holistic robustness to OOD data without control-            achieved strong performance in various V&L
ling for specific aspects, by testing our models            tasks in the last two years: V I LBERT (Lu et al.,
on different OOD benchmarks. We believe our                 2019) and ALBEF (Li et al., 2021b).
experimental setting is more realistic as it more
closely emulates the expected experience of de-             V I LBERT is one of the first, yet strong mod-
ployed VQA systems.                                         els in the recent pretrain–fine-tune paradigm for
   Domain adaptation in VQA: Domain adap-                   V&L research. V I LBERT is a dual-stream cross-
tation is a common approach towards improving               encoder model (Bugliarello et al., 2021). Its inputs
performance in a target domain (Patel et al., 2015;         are a sequence of sub-word tokens (Sennrich et al.,
Ganin and Lempitsky, 2015; Motiian et al., 2017;            2016; Wu et al., 2016) for text, and a set of regions
Li et al., 2021a). Some studies (Jabri et al., 2016;        of interest extracted by a Faster R-CNN (Ren
Chao et al., 2018) have looked into domain adap-            et al., 2015; Anderson et al., 2018b) for image.
tation of VQA models from one VQA benchmark                 The textual inputs are first processed through 6
to another. Our focus is, however, on evaluat-              Transformer layers, before being combined with
ing zero-shot generalization without any adapta-            visual inputs through inter- and intra-modal atten-
tion. This allows us to assess the robustness of cur-       tion layers. The authors fine-tune V I LBERT end-
rent models towards unforeseen distribution shifts.         to-end on VQAV 2 by framing it as a classification
Our work is in similar spirit as (Torralba and Efros,       task over the most frequent answers drawn from
2011; Hendrycks et al., 2020), who study OOD                the VQAV 2 training set. We re-implement this

                                                        3
architecture, and confirm the comparable perfor-          3.2   Datasets and Evaluation Metrics
mance by reproducing the results (see Tab. 5 in
App. A). As well, and extend it to perform VQA            Datasets. We ground our analysis on five di-
tasks in a generative manner by learning a Trans-         verse VQA datasets: VQAV 2 (Goyal et al.,
former decoder during pretraining and fine-tuning         2017), GQA (Hudson and Manning, 2019), V I -
(see App. A for implementation details). In the           SUAL G ENOME (VG; Krishna et al. 2017),
following, we refer to the discriminative version         V IZ W IZ (Gurari et al., 2018) and VQA-
of V I LBERT as V I LBERTDISC , and use V I L-            CP (Agrawal et al., 2018). VQAV 2 is the most
BERTGEN for the generative one. Unless oth-               commonly used VQA dataset to date, it consists
erwise specified, results for the V I LBERTDISC           of 265K images and 1.1M question-image pairs,
are obtained with our re-implementation for direct        each with 10 ground-truth answers. VQA-CP
comparison with V I LBERTGEN .                            re-splits the VQAV 2 dataset such that, for every
                                                          question type, train and test sets have different
ALBEF is a state-of-the-art V&L encoder. Like             prior distributions of answers. VG includes 108K
V I LBERT, ALBEF is a dual-stream encoder but             images and 1.7M questions, each paired with a
with two main differences: first, the visual inputs       single answer, centered around either the full im-
are image patches that are processed through a vi-        age or a specific region within it. GQA is an-
sion Transformer (Dosovitskiy et al., 2021; Tou-          other large-scale effort (22M questions, each with
vron et al., 2021) that is jointly trained with the       one answer) that focuses on compositionality of
rest of the model; and second, the cross-modal            template-generated questions for real-world im-
interactions happen through standard Transformer          ages (from VG). Following prior work, we use the
cross-attention at each layer (whereas V I LBERT          GQA balanced subset (1.5M questions). Finally,
uses co-attention layers specifically designed for        V IZ W IZ is the only real-world VQA dataset as it
V I LBERT for sparse cross-modal interactions).           was collected from visually impaired people. It
In addition, the model is trained with pseudo-            consists of 31K image-question pairs, each paired
targets that are generates from a moving-average          with 10 answers.
version of its weights. Li et al. (2021b) fine-              Due to the nature of the datasets and their an-
tune ALBEF on VQAV 2 in a generative way by               notation protocols, there are several differences
adding a 6-layer Transformer decoder to generate          among them. Both VQAV 2 and GQA mostly
answers (ALBEFGEN ). We use the official imple-           have one-word answers (89% and 81%, respec-
mentation,1 and furthermore train a discriminative        tively) whilst VG and V IZ W IZ usually have
variant (ALBEFDISC ) by learning a multi-answer           longer ones too (only 57% and 67% one-word an-
classifier, similar to V I LBERTDISC .                    swers, respectively). The type of questions also
                                                          varies across datasets: VG does not contain bi-
   In our analysis, we also investigate the role of       nary ‘yes/no’ questions, but rather spans 6 types
multimodal pretraining, by either initializing our        (what, where, when, who, why, and how). By
models from the released checkpoints (which cor-          design, GQA questions require more composi-
respond to the pretrained models) or not. V I L-          tional skills than in other datasets but do not test
BERT was pretrained on 3M image–text pairs                for counting skills (Hudson and Manning, 2019),
from Conceptual Captions (CC; Sharma et al.               while V IZ W IZ has a significant proportion of
2018). ALBEF (Li et al., 2021b) was released              OCR questions (21%) and are more conversational
with two checkpoints: one where the model                 since they are collected from blind people through
was pretrained on 4M images from CC, MS-                  speech based interface (Gurari et al., 2018). More-
COCO (Lin et al., 2014), SBU (Ordonez et al.,             over, a significant number of V IZ W IZ questions
2011) and Visual Genome (Krishna et al., 2017)            (28%) are unanswerable because of the challenges
combined; and another where it was additionally           faced by the users in taking pictures, resulting in
pretrained on Conceptual 12M (Changpinyo et al.,          poor focus, poor lighting or entirely missing the
2021) for a total of 14M images.                          entity of interest. Note that due to such pictures,
                                                          the distribution of images in V IZ W IZ is differ-
                                                          ent from that in other datasets (consisting of good
  1
      https://github.com/salesforce/ALBEF.                quality images).

                                                      4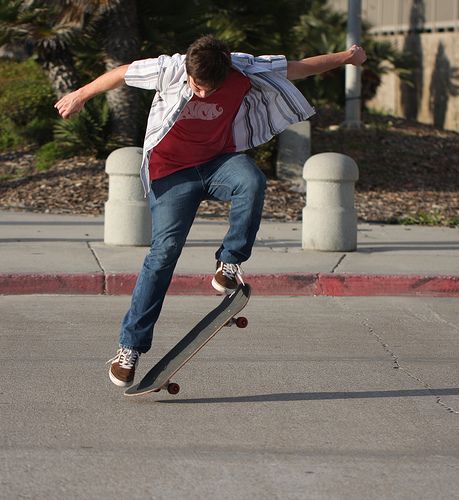
Evaluation Metrics. The VQA benchmarks we                             of a different one (e.g., V IZ W IZ). We call this
experiment with use string matching (after some                       evaluation setting out-of-distribution (OOD) be-
simple pre-processing) between the model re-                          cause the distribution of the test benchmark is dif-
sponse and the ground truth answer(s) to compute                      ferent than that of the train one.3 We also consider
the model accuracy. VQAV 2 and V IZ W IZ, which                       the typical setting where we test our models on
both have 10 answers per question, account for di-                    the validation split of the fine-tuning benchmark
versity in ground-truth answers by scoring a given                    (e.g., fine-tune on the train split of VQAV 2 and
model answer as min{1.0, 0.3 × count}, where                          test on its validation split). We refer to this as the
count is the number of times a given answer ap-                       independent and identically distributed (IID) set-
pears in the list of 10 ground-truth answers. For                     ting. If our pretrained models are indeed learn-
GQA and VG, both with only one ground-truth                           ing the VQA skill, we expect to see a small drop
answer per question, we use top-1 accuracy.2                          in performance between the IID and OOD set-
                                                                      tings. Given this setup, we evaluate our four pre-
3.3      Training Details                                             trained models (generative and discriminative ver-
Following common practice, for discriminative                         sions of V I LBERT and ALBEF) by fine-tuning
models, we select the top-k most frequent answers                     them on each of the four VQA benchmarks and
from the fine-tuning dataset, as the set of answer                    testing them against all the benchmarks.
classes to perform classification over. Here k is                        The results are presented in Fig. 1, where the x-
a dataset-dependent variable. For VQAV 2 and                          axis depicts the evaluation benchmarks and each
GQA, we use the same answer sets as V I LBERT                         bar represents a fine-tuning dataset. First, across
(3,129 and 1,533, respectively). For V IZ W IZ, we                    all models, for each benchmark, we see a no-
select the answers that appear at least 8 times in                    table drop in the VQA accuracy from the IID set-
training and validation sets, for a total of 3,112                    ting (bar heights highlighted in bold) to the OOD
answers that cover 97% of the data. For VG, we                        ones. For both ALBEF and V I LBERT models,
select the answers that appear at least 29 times in                   the largest performance drop is observed when
the dataset, for a total of 3,449 answers that cover                  we evaluate models against the V IZ W IZ bench-
76.5% of the data. Importantly, combined with the                     mark (with a maximum of 40.7 point drop for
VQA accuracy metric defined above, this results in                    V I LBERTDISC fine-tuned on VG, and a minimum
an upperbound to the accuracy that discriminative                     of 23.7 point drop for ALBEFDISC fine-tuned on
models can achieve in each dataset (see Tab. 2).                      VQAV 2). This result highlights that the V IZ W IZ
   All models are trained exclusively on the re-                      benchmark—curated from the visually-impaired
spective training sets and evaluated on the vali-                     users—is the most dissimilar to other VQA bench-
dation sets, which allows us to conduct in-depth                      marks and thus is a challenging benchmark for the
analyses that would otherwise be impossible to                        OOD evaluation. Moreover, even the smallest per-
carry out on the private test sets. As there is no of-                formance drop, which happens when fine-tuning
ficial split of Visual Genome, we randomly sample                     models on VQAV 2 and evaluating them on VG,
the data into training (60%) and validation (40%)                     is quite large (i.e., 5.3 points for ALBEFGEN ).
such that no image appears in the two splits.                         These results show that the pretrained models are
                                                                      largely learning the fine-tuning benchmark with-
4       Out-of-Distribution Generalization
                                                                      out learning to solve the VQA task.
We first ask if our pretrained models can learn the                      Second, we observe that fine-tuning on VQAV 2
skill of visual question answering (VQA) or if they                   results in the lowest drop in IID to OOD perfor-
simply learn to solve a specific VQA benchmark                        mance across all conditions – the VQAV 2 bar
by latching on dataset-specific correlations. To                      (shown in blue in Fig. 1) is the closet to the
answer this question, we fine-tune our pretrained                     IID one for GQA, VG, and V IZ W IZ. We con-
models on the train split of one benchmark (e.g.,                     clude that fine-tuning on VQAV 2 yields a model
VQAV 2) but evaluate them on the validation split                     that best generalizes to the OOD setting for our
    2
     We note that GQA and VG propose top-5 accuracy. We,
                                                                      benchmarks. This result is not simply due to the
instead, opt for top-1 accuracy for two reasons. First, to keep
                                                                         3
a consistent setup with VQAV 2 and V IZ W IZ. Second, we                  We note that the degree to which each benchmark is
believe top-5 accuracy is impractical for many applications,          OOD for a given fine-tuning dataset varies depending on the
such as answering questions for visually impaired users.              similarity of their images and the quality of their language.

                                                                  5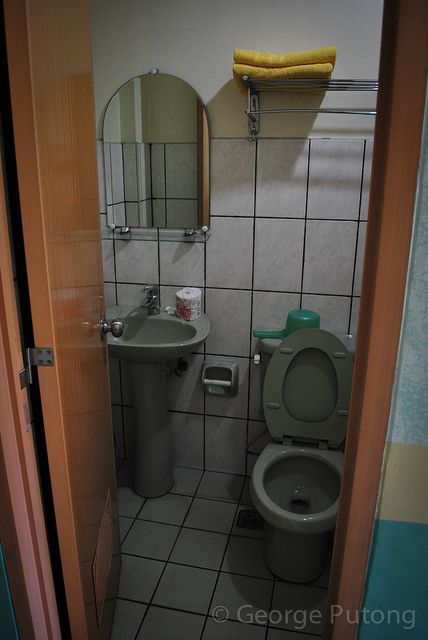
Fine-tuning dataset Model
GQA VQAv2 VG VizWiz Discriminative Generative
VILBERT
80
65.3 65.8
61.5 62.2
VQA Accuracy (%)
60
46.9 47.5
42.6 41.841.8 40.339.1 39.9
40 34.632.4
28.727.929.5
21.921.523.4 23.4
20 17.1 17.417.5 15.013.2
5.7 3.3 8.6 7.7 6.8 6.7
0
GQA VQAv2 VG VizWiz
ALBEF
80
70.372.1
61.764.2
VQA Accuracy (%)
60
49.350.1 50.3
45.7 47.1
42.744.5 41.4
40 37.339.2
31.233.4 33.4
23.723.6 22.8 24.5 22.8
20 18.2 19.5 17.719.8
9.1 11.512.5 10.012.2
1.9
0
GQA VQAv2 VG VizWiz
Test dataset
Figure 1: Comparing IID vs OOD performance on GQA, VQAV 2, VG and V IZ W IZ. Top: V I LBERT
pretrained using BERT weights and CC. Bottom: ALBEF pretrained using BERT weights, plus CC,
VG, SBU, MS-COCO and C12M datasets (14M total). VQA accuracies highlighted in bold denote IID
performance.
size of the fine-tuning benchmark as VG is larger sets). In this section, we examine to what extent
than VQAV 2. Similarly, for all models, the OOD this limitation affects OOD performance by con-
performance obtained on each fine-tuning bench- trolling for the mismatch in answer sets between
mark is the highest when the model is evaluated the fine-tuning and test sets. We do so by con-
on VQAV 2. We conjecture that VQAV 2 is the sidering only the test questions corresponding to
most similar to other benchmarks (GQA, VG, the intersection of top-k answers that are present
V IZ W IZ). Lastly, given their differences in pre- in both the fine-tune set and the test sets. While
training datasets and architecture, we cannot di- this issue is apparent for discriminative models, it
rectly compare ALBEF and V I LBERT models. also impacts the performance of generative mod-
Nevertheless, overall, ALBEF models mostly out- els, as the number of data points for each answer
perform V I LBERT ones (in 27 / 32 evaluations). class seen by the generative model during fine-
tuning varies: data-points in top-k answer set are
4.1 Evaluating on Shared Answer Sets more frequent than others (by definition of top-
k). In other words, even though a tokenizer used
Discriminative models treat VQA as a classifica- to produce an answer could generate it, it is un-
tion task over the set of top-k most frequent an- likely (or less likely) to do so if it has not seen
swers curated from the fine-tuning data. This lim- (or seen rarely) that combination of tokens dur-
its the performance of discriminative models: if a ing fine-tuning. Thus, even for generative models,
model has never seen a certain answer during fine- we consider performance on top-k most frequent
tuning, or it has seen it infrequently, it will perform classes for each benchmark.
poorly when expected to produce such an answer
during test time. While this limitation also affects In the following, we report the accuracy on
IID evaluation, we expect it to have a stronger ef- the subset of test questions whose answers are
fect in OOD generalization (due to potentially dif- shared between both the IID and the OOD mod-
ferent answer distributions in the fine-tune and test els. For instance, when comparing the perfor-
6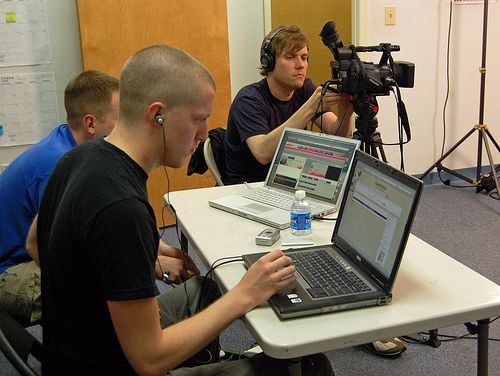
Fine-tuning dataset
                                                       GQA          VQAv2             VG              VizWiz

                             VILBERTDISC               VILBERTGEN                         ALBEFDISC                 ALBEFGEN
                   80   #*    #*    *#     * #   # *    #*   *#      * #         #*       #*    *#       * #   #*   #*   *#    * #
VQA Accuracy (%)

                   60

                   40

                   20

                   0
                        GQA VQAv2 VG VizWiz      GQA VQAv2 VG VizWiz             GQA VQAv2 VG VizWiz           GQA VQAv2 VG VizWiz

  Figure 2: Test performance on GQA, VQAV 2, VG and V IZ W IZ for all models. Solid bars represent
  IID/OOD evaluation on the entire test set, and stacked dotted bars are improvements when evaluating on
  questions corresponding to shared answer sets between IID and OOD settings. IID evaluation is high-
  lighted with the hash symbol (#), and shared answer set is computed with respect to the bar denoted
  with an asterisk (*). Note that for a given test benchmark, not all bars are comparable with each other
  due to different answer sets used, resulting in accuracy computation over different subsets of test ques-
  tions. Only the highlighted IID and OOD bars can be compared with each other. For IID comparisons
  corresponding to the non highlighted OOD bars, please refer to Tab. 10 (App. B).

  mance of the VQAV 2 and VG fine-tuned mod-                                   We observe a similar pattern across the models:
  els on the VQAV 2 test set, we compute the av-                            in most cases, using a shared answer set improves
  erage accuracy on those VQAV 2 questions whose                            the performance, both in IID and OOD setups.
  ground truth answers are present in the top-k an-                         Overall we still observe a notable gap between
  swers from VQAV 2 as well as the top-k answers                            the OOD and IID settings for the best case OOD
  from VG: we extract the common answer labels                              generalization scenario, showing that a shared an-
  (between VQAV 2 and VG top-k answers) and                                 swer set does not circumvent the difficulty of OOD
  compute performance on test questions belonging                           generalization for these models. The largest OOD
  to these shared answer labels only.                                       improvement (28.4 points) upon using shared an-
     Fig. 2 shows the improvement in the VQA ac-                            swer set is observed for ALBEFGEN fine-tuned
  curacy when controlling for the shared answer set                         on GQA and tested on VG. In some IID cases,
  (represented with dotted bars) over the IID and                           but not in OOD ones, restricting the answer set to
  OOD evaluation accuracy shown in Fig. 1 (repre-                           common answers hurts the performance (indicated
  sented with solid-colored bars in Fig. 2).4 Since                         as a lack of dotted bar in Fig. 2). Interestingly,
  for each IID evaluation there are three possible                          this pattern is observed across all models for some
  settings corresponding to answer intersection with                        combinations of benchmarks: GQA IID evalua-
  each of the other three benchmarks, we only report                        tion using the joint GQA-VG answer subset, as
  the evaluation on the answers intersection result-                        well as VQAV 2 IID evaluation using VQAV 2-VG
  ing in the smallest gap between IID and OOD, and                          answer set, implying the GQA and VQAV 2 ques-
  report the remaining numbers in Tab. 10 (App. B).                         tions corresponding to shared ans set with VG are
  Thus, the difference between the height of the IID                        more difficult than the average difficulty of these
  bar (highlighted with with the # symbol) and the                          test sets.
  OOD bar (highlighted with the * symbol) with re-
  spect to which answer intersection between IID                            Is the poor OOD performance correlated with
  and OOD is computed, represents the best case                             poor representation of the test answer classes in
  scenario for OOD generalization, i.e., the least                          fine-tuning data? As established in the previous
  drop from IID to OOD.                                                     section, controlling for shared answer classes only
                   4
                                                                            partially explains poor OOD performance. Here,
       Note that for a given test benchmark, not all bars are
  comparable with each other due to different answer sets used,
                                                                            we explore whether the drop in OOD performance
  resulting in accuracy computation over different subsets of               (compared to IID) is correlated with the poor rep-
  test questions.                                                           resentation of test answer classes in OOD fine-

                                                                        7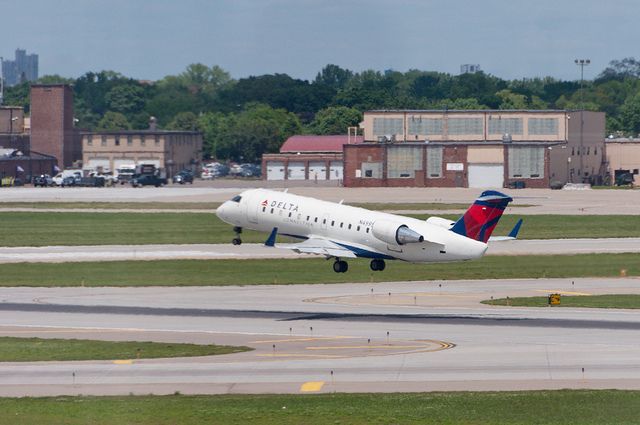
VQAV 2 GQA            VG      V IZ W IZ
                  VQAV 2 GQA          VG     V IZ W IZ                VQAV 2            92.9      96.7     65.1      43.6
   VQAV 2            –        0.43    0.51      0.25                  GQA               73.5      99.9     44.8      36.6
   GQA              0.27        –     0.43      0.19                  VG                52.7      62.4     74.2      32.3
   VG               0.26      0.36      –       0.13                  V IZ W IZ         79.4      82.5     40.9      86.2
   V IZ W IZ        0.47      0.55    0.48        –
                                                                   Table 2: Maximum achievable accuracy for all test
Table 1:   Spearman’s rank correlation between                     answers based on the top-k answers present in
drops in test accuracy (from IID to OOD) and                       the respective fine-tuning sets. Rows correspond
the differences in proportion of answer classes                    to the fine-tuning datasets, columns correspond to
between IID and OOD fine-tune sets for AL-                         the test benchmarks.
BEFGEN . All ρ values significant with p <
.05. Rows correspond to the fine-tuning datasets,
                                                                   imum VQA accuracy we can achieve in both IID
columns correspond to the test benchmarks.
                                                                   and OOD settings if we treat VQA as a classifica-
                                                                   tion task?
tune set when evaluated on the shared answer set.                     To answer this question, we compute the upper-
In other words, we examine the relationship be-                    bound performance of our models (i.e., maximum
tween higher drop for classes that are represented                 achievable accuracy) by assuming that each test
less frequently in the OOD fine-tune set.                          question is answered correctly.6 This accuracy is
   In order to do so, we first compute per answer-                 computed using the VQA evaluation metric ex-
class accuracy (average accuracy of all test ques-                 plained in Sec. 3. The results are shown in Tab. 2.
tions belonging to the same answer class) for an-                     When comparing a diagonal value in the ta-
swers in shared answer set. We then sort the                       ble (denoting maximum achievable IID accuracy)
shared answer classes based on their weighted                      with the rest of the values in the same column, we
drop in per-class accuracy from IID to OOD (IID                    notice a large drop in accuracy from the IID to
accuracy - OOD accuracy), i.e. absolute drop in                    the OOD settings, with V IZ W IZ having the over-
per-class accuracy weighted by number of data                      all lowest achievable accuracies in OOD settings.
points belonging to that class in the test set. We                 This result reconfirms the difficulty of generaliz-
then compute the Spearman’s rank correlation of                    ing to a real-world dataset such as V IZ W IZ in a
these weighted drop in per-class accuracies with                   discriminative setting.
difference in percentage frequencies of the answer                    We also note that our ALBEFDISC and V I L-
classes between IID and OOD fine-tune sets (per-                   BERTDISC models perform notably worse than
centage frequency of an answer class in IID - its                  maximum achievable accuracy in all settings (with
percentage frequency in OOD). The results for                      the smallest gap of 19.3% across all conditions,
ALBEFGEN are shown in Tab. 1, showing a mod-                       see Fig. 1); as a result, the poor OOD performance
erate to strong correlations for many datasets, with               in the discriminative setting is not simply due to
lowest correlations for V IZ W IZ (test set).5 A sim-              the low maximum achievable accuracy.7 We con-
ilar, comparable pattern of results is observed for                clude that the common practice of modeling VQA
other models and is reported in App. B. We argue                   as a classification task severely limits the general-
that this relationship is a contributing factor to the             ization capability of models to new datasets. On
weak OOD generalization, but also explore other                    the other hand, generative models do not suffer
causes in Sec. 7.                                                  from a fixed class set. They can generate a larger
                                                                   set of answers—all words for which the tokens
4.2    The Case for the Generative Evaluation                      occur in the pretraining data, including those that
As mentioned previously, a discriminative model                    are out-of-vocabulary for the given VQA fine-tune
cannot correctly answer questions for which the                       6
                                                                         For VQAV 2 and V IZ W IZ with multiple ground-truth an-
answers lie outside the pre-defined top-k classes.                 swers, we use the answer with highest accuracy to compute
An interesting question is then: what is the max-                  the upper-bound.
                                                                       7
                                                                         In our analyses, we also noted that differences in answer
   5
    As a simple baseline test, we also compute correlations        pre-processing strategies can result in slightly different num-
and p-values for a permuted dataset to confirm their lack of       bers than those reported in Tab. 2. However, those differences
significance, or correlation values close to zero.                 did not change the conclusion of our findings.

                                                               8
datasets. We argue that generative modeling is a           other.8 Fig. 4 shows the difference between the
more promising solution for the real-world appli-          VQA accuracy of models with and without multi-
cation of VQA; in fact, recent work has identified         modal pretraining—each bar in the plot shows the
text generation as a way to unify various V&L              gap between a bar in Fig. 1 and the equivalent ex-
tasks (e.g., Cho et al., 2021a; Wang et al., 2022;         periment without multimodal pretraining.
Alayrac et al., 2022).                                        We observe that multimodal pretraining is help-
   Given the discussed benefits of generative mod-         ful in almost all conditions: all but 9 (out of 96)
eling, we next ask if our V I LBERTGEN and                 comparative experiments in Fig. 4 exhibit a posi-
ALBEFGEN models are more successful in OOD                 tive percentage point difference in VQA accuracy
generalization compared to their discriminative            when the setting with multimodal pretraining and
counterparts.      To answer this question, for            without are compared. Pretraining is improving
each model (i.e., generative/discriminative AL-            OOD performance likely because it can reduce the
BEF/V I LBERT), we first calculate the gap be-             gap between the train and OOD test data by po-
tween the IID setting with each OOD setting                tentially exposing the model to a more diverse set
(i.e., ∆ OOD) resulting in three numbers for each          of data points during pretraining. In our experi-
benchmark; for example, for the VQAV 2 bench-              ments, the maximum gain from multimodal pre-
mark, ∆ OOD numbers are calculated between                 training is indeed observed in OOD settings for
the model fine-tuned on VQAV 2 and those fined-            both V I LBERT (fine-tune on V IZ W IZ and test on
tuned on VG, GQA, and V IZ W IZ. Note that the             GQA) and ALBEF (fine-tune on GQA and test
higher the ∆ OOD value, the poorer a model is in           on VQAV 2); however, multimodal pretraining is
OOD generalization. We then calculate the differ-          not always more useful in OOD settings compared
ence between the ∆ OOD values of the generative            to IID ones. For example, when evaluating V I L-
and discriminate models (ALBEF/V I LBERT).                 BERT on VQAV 2, pretraining helps the IID set-
Fig. 3 visualizes this result; the benchmarks are          ting more than some of the OOD settings.
shown on the x-axis and each circle represents                Multimodal pretraining is detrimental for some
difference in ∆ OOD values between the genera-             cases where models are fine-tuned on V IZ W IZ. In
tive and the discriminative model for a given fine-        V I LBERT models, the largest performance drop
tuning dataset. If a generative model is more ro-          between the settings with and without pretraining
bust to OOD evaluation, we expect to see smaller           is observed when fine-tuning on V IZ W IZ and test-
∆ OOD value for that model compared to its dis-            ing on VQAV 2 (-3.8%). For the ALBEF fam-
criminative counter part. As a result, when the            ily, multimodal pretraining is most hurtful when
circles are below the x-axis (depicting negative           fine-tuning and testing on V IZ W IZ (-3.5%). Inter-
values), the generative model is more robust than          estingly, multimodal pretraining is also the least
the discriminative one. We observe that generative         helpful for OOD settings where models are evalu-
ALBEF models often outperform the discrimina-              ated on V IZ W IZ (the OOD bars for V IZ W IZ test
tive counterparts with respect to better OOD gen-          set are the shortest). These observations highlight
eralization. Such consistent pattern was not ob-           the dissimilarity of the V IZ W IZ benchmark and
served for V I LBERT models.                               the pretraining datasets as we expect the pretrain-
                                                           ing to be more helpful when pretraining and test
                                                           datasets are more similar (Hendricks et al., 2021).
5   The Effect of Multimodal Pretraining                      When comparing generative and discriminative
                                                           settings for each model, we observe that multi-
                                                           modal pretraining is more effective for the genera-
Previous work has shown that pretraining on mul-
                                                           tive ALBEF compared to the discriminative AL-
timodal (i.e., image–text) data improves IID per-
                                                           BEF (compare the shaded and solid bar with the
formance (e.g., Lu et al., 2019; Li et al., 2021b);
                                                           same color in Fig. 4 middle and bottom). For
here, we ask if multimodal pretraining can help in
                                                           the V I LBERT model, we generally do not ob-
OOD settings as well. Thus, we repeat the exper-
                                                           serve such a pattern—discriminative and gener-
iments in Sec. 4 without pretraining our models
(V I LBERT and ALBEF) on multimodal data; in-                 8
                                                               We note that both models are initialized with BERT
stead we train the models on the train split of one        weights; here we do not study the effect of pretraining on
benchmark and test it on the validation split of an-       language-only data.

                                                       9
VILBERT               ALBEF (BERT + 4M)                 ALBEF (BERT + 14M)
Generative OOD - Discriminative OOD   10

                                                                                                                                                              Better
                                                                          Train dataset
                                                                                 GQA

                                                                                                                                    Generative Discriminative
                                      5                                          VQAv2
                                                                                 VG

                                                                                                                                               Better
                                                                                 VizWiz
                                      0

                                      5

                                      10
                                           GQA VQAv2   VG   VizWiz   GQA VQAv2     VG      VizWiz     GQA VQAv2      VG    VizWiz
                                                                            Test dataset
     Figure 3: Difference in ∆ OOD values between discriminative and generative models. A ∆ OOD value
     is the difference between the IID and OOD accuracy for a benchmark pair. Positive values on the y-
     axis mean that discriminative models have a smaller gap on that benchmark combination, while negative
     values denote smaller gap for the generative models.

     ative models mostly show comparable improve-                                Thus, models that overfit to answer priors in
     ments due to multimodal pretraining. A potential                            training data and lack sufficient visual grounding
     explanation for the difference between the effect                           show poor generalization on the VQA-CP test set
     of pretraining in ALBEF and V I LBERT could be                              (when trained on the VQA-CP training set). For
     the difference in their pretraining datasets, in terms                      comparison, we also report the performance of
     of both size and quality: ALBEF is pretrained on                            Counterfactual VQA (CF-VQA; Niu et al. 2021),
     a larger dataset and its pretraining data contains                          a state-of-art method on VQA-CP. This method is
     more in-domain datasets, such as MS-COCO and                                based on the UpDn (Anderson et al., 2018a) archi-
     VG.                                                                         tecture (a strong model designed for VQA which
        Finally, for the ALBEF model, while we often                             was SOTA before pretrained multimodal Trans-
     observe improvements by increasing the size of                              formers) and does not use any pretraining data.
     the multimodal pretraining dataset (4M vs. 14M),                            However, this method explicitly models and tack-
     the improvements are small. When pretraining on                             les the language (i.e., question and answer) biases
     the smaller dataset (4M), we observe a median im-                           in VQA.
     provement (over no pretraining) of 1.9% for the                                The results are shown in Tab. 3. We make the
     discriminative and 4.9% for the generative AL-                              following observations:
     BEF, while the median additional improvements                                  • For all the Transformer-based models, there
     due to larger pretraining dataset (14M) are 0.1%                                 is a huge drop in the performance (at least
     and 0.6% respectively. Surprisingly, there are                                   22%) from VQAV 2 to VQA-CP. Thus, in
     also dataset pairs for which larger pretraining has a                            spite of advances in the Transformer archi-
     negative effect when compared to the performance                                 tecture and pretraining on diverse datasets,
     with a smaller pretraining set (e.g.,ALBEF model                                 models are still overfitting to answer priors
     fine-tuned on V IZ W IZ and tested on VQAV 2).                                   in the training data and lack sufficient visual
                                                                                      grounding. However, the drop is much less
     6                                Evaluation on VQA-CP                            for CF-VQA (10%), suggesting incorporat-
     In this section, we evaluate the models9 on the                                  ing inductive biases specific to the general-
     VQA under Changing Priors (VQA-CP) dataset                                       ization problem (modeling language bias in
     (Agrawal et al., 2018). This dataset is designed                                 this case) helps more than advancing the ar-
     such that, for every question type, train and test                               chitecture or scaling-up the amount of pre-
     splits have different prior distributions of answers.                            training data.
        9
          ALBEF and V I LBERTDISC (using the official code-                         • The drop from VQAV 2 to VQA-CP is gen-
     base).                                                                           erally lower for the generative ALBEF than

                                                                            10
Fine-tuning dataset Model
GQA VQAv2 VG VizWiz Discriminative Generative
VILBERT (BERT + 3M)
10
VQA Accuracy (p.p.)
8.0
5.8
4.5 4.9
5 3.5 3.7 3.4
2.6 2.7 2.6 2.8 3.1 2.4 2.4 1.8 2.8 2.5
1.8
1.0 1.5 2.0 1.4 1.1 1.1 1.8 1.4 0.9 0.5 0.8
0 -1.4 -1.8
-3.8
5
GQA VQAv2 VG VizWiz
ALBEF (BERT + 4M)
11.4
10 9.6
VQA Accuracy (p.p.)
7.8 8.0 7.8 7.3
5.8 5.3 6.0
4.9 5.0 5.1 4.4
5 4.2 3.8 3.8
2.5 2.9 3.0
2.0 2.3 2.0 1.6 1.8 1.6
1.4 0.8
0.4 0.4 0.5
0 -0.4
-1.9
5
GQA VQAv2 VG VizWiz
ALBEF (BERT + 14M)
11.4
10.7
10
VQA Accuracy (p.p.)
8.0 8.1 7.7 7.6
5.8 5.6 6.3
5.3 5.3 5.4
5 4.5 3.8 4.2 4.2 4.2 4.4
3.3 3.3 3.6
2.0 2.2 2.7
1.9 1.8 1.7
0 -0.4 0.3 -0.7
-1.7
-3.5
5
GQA VQAv2 VG VizWiz
Test dataset
Figure 4: Percentage point difference in VQA accuracy between models that have and have not been
pretrained on multimodal data for OOD and IID (highlighted in bold) evaluation. From the top to the
bottom: V I LBERT, ALBEF pretrained on a smaller dataset, ALBEF pretrained on a larger dataset.
the discriminative ALBEF (except for AL- 7 Potential Causes of Poor OOD
BEF without any multimodal pretraining). Generalization: A Qualitative Study
Thus, generative models seem to be more
In section 4, we observe that our pretrained mod-
robust than discriminative ones, especially
els exhibit poor OOD generalization for the task of
when they are pretrained (similar to the ob-
VQA. We also noted that this poor generalization
servations made in Sec. 4.2).
is not entirely explained by the absence or poor
representation of test answer classes in the train-
ing data. Here, we perform a qualitative study to
• As for the effect of pretraining, for gener- dig deeper into the potential causes of the poor
ative ALBEF, pretraining helps reduce the OOD generalization. We manually examine 20
drop from VQAV 2 to VQA-CP. However, randomly-sampled qualitative examples of failure
pretraining does not seem to help generaliza- cases on top-30 answer classes contributing the
tion (in fact it makes it worse for ALBEF) most to the drop in performance from IID to OOD.
for discriminative models. We only focus on answer classes that are shared
between the train and test splits to make sure the
performance drop is not due to the absence of an-
11Model MM PT VQAV 2 VQA-CP drop Overfitting to the answer priors. Previous
CF-VQA – 53.6 63.5 9.9 studies have shown that VQA models tend to be
biased towards the prior distribution of answers
V I LBERTDISC no 66.7 42.5 24.2
in the training set (per question type) (Agrawal
V I LBERTDISC yes 67.0 42.9 24.1
et al., 2018). We find that this limitation exists
ALBEFDISC no 64.0 40.1 23.9 in the more recent pretrained models as well, and
ALBEFDISC yes (4M) 70.0 44.4 25.6 it is especially hurtful in the OOD settings be-
ALBEFDISC yes (14M) 70.3 45.2 25.1
cause the priors need not be the same across train
ALBEFGEN no 61.4 36.6 24.8 and test sets, unlike in the IID settings. For in-
ALBEFGEN yes (4M) 71.0 49.2 21.8 stance, V I LBERTDISC fine-tuned on VQAV 2 pre-
ALBEFGEN yes (14M) 72.1 49.6 22.5
dicts “2” for a lot questions with target answer “1”
Table 3: Performance of models on VQAV 2 (IID) in the VG test set. Similarly, sometimes V I L-
and VQA-CP (OOD). The last column shows BERTDISC fine-tuned on VG incorrectly predicts
drop in performance from VQAV 2 to VQA-CP. “helmet” for VQAV 2 test questions such as “What
MM PT: Multimodal Pre-training. is the skateboarder wearing to protect his head?”,
“What protective gear is he wearing?” when the
swer classes in the training dataset. We report the skateboarder is not wearing anything. This indi-
top-5 classes that contribute the most to the drop cates that the model is relying on answer priors
in performance for each OOD setting in Tab. 11 rather than visual grounding. Our experimental
in App. C. Below, we describe four major poten- results on VQA-CP (Sec. 6) directly quantify the
tial causes10 for the poor OOD generalization that extent of such limitations in current models.
we can infer from our qualitative study on V I L-
BERTDISC 11 and ALBEFGEN . The specific ex- Overfitting to the question format. For some
amples reported below are for V I LBERTDISC . answer classes that generalize poorly in OOD set-
tings, there is a limited variation in the format of
Poor reasoning skills. In Tab. 11, we can see questions, with certain formats being quite domi-
that a model fine-tuned on VQAV 2, VG, or nant. In addition, these dominant formats are dif-
V IZ W IZ and evaluated on GQA shows the high- ferent between the OOD fine-tune and test sets.
est performance drop on classes such as “yes”, We conjecture that models are likely overfitting
“no”, “right”, “left”, “top”, and “bottom”. For to such dominant formats in fine-tuning data and
instance, VQAV 2–GQA (fine-tuned on VQAV 2, hence fail to generalize at test time when the
evaluated on GQA) model underperforms GQA- format changes. For instance, questions about
GQA model by 24% for “no.” Upon qualitative “chair” in the VQAV 2 fine-tune set are mostly
examination, we find that for many of such failure of the form “What is . . . sitting on”? whereas
cases, the GQA questions are more compositional in the GQA test set, they are mostly of the form
and hence require more complex reasoning (e.g., “What kind of furniture is . . . ?”. Thus, the “chair”
“Are there both bison and zebras in the image?”, class accuracy of V I LBERTDISC fine-tuned on
“Is the cheese to the right or to the left of the empty VQAV 2 drops from 48% when tested on VQAV 2
plate?”) than the questions for the same answer to 38% on the GQA test set. As another example,
classes in other datasets (e.g., from VQAV 2 train V I LBERTDISC trained on GQA fails terribly for
set: “Is the TV turned on?”, “Which hand is the “dog” and “cat” classes on VG test set (accuracy
man holding up?”). This study re-affirms previous drops of 47% and 43% respectively, where drop
findings (Johnson et al., 2017; Hudson and Man- is between GQA–GQA and GQA–VG). GQA
ning, 2019) – VQA models lack sufficient logical, questions are mostly of the form “What animal
spatial, and compositional reasoning skills – for . . . ?” or “What kind of animal . . . ?” whereas VG
the more recent, pretrained Transformer models. questions often do not mention the word “animal”
and are of the form “Who is . . . ?” or “What is
10
For poor OOD generalization on the V IZ W IZ bench- . . . ?” (e.g., “Who is holding the Frisbee?”, “What
mark, one of the reasons could be difference in image dis- is on the leash?”). More such examples in App. C.
tributions between V IZ W IZ (that contains many blurry pic-
tures, or pictures with poor lighting conditions) and other
three datasets (that contain clear pictures). Stringent evaluation metric. We notice that
11
We use the model trained with the official codebase. sometimes the models’ responses are correct but
12VQAv2 Question: What color is the plane? VG Question: When was this photo taken? (i.e., performing string matching with a small set
of ground-truth answers). For example, the evalu-
ation metric fails to take into account differences
(between model response and ground-truth) due to
specificity of the answers (e.g., “on table” vs. “ta-
ble”, “pizza slices” vs. “pizza”), synonyms, and
VQAv2 ground-truth answers: 〈white〉 VG ground-truth answer: daytime different interpretations of the question (e.g., the
VG model’s answer: white and blue
VQAv2 model’s answer: white
VG model’s answer: daytime
VQAv2 model’s answer: winter
right image in Fig. 5). To quantitatively evalu-
ate the extent of the this issue, we perform human
Figure 5: Examples where models are not given evaluation of our models for both IID and OOD
any credit by the evaluation metric even though settings. We aim to answer the following ques-
the responses are reasonable. h i denotes a list tions:
of unique (out of 10) ground-truth answers. VG
• Do model accuracies computed using the au-
(VQAV 2) model is a V I LBERTDISC that was
tomatic evaluation metric (as discussed in
fine-tuned on VG (VQAV 2).
Sec. 4) improve with human evaluation?
they are evaluated as incorrect because those re- • Do models still show poor OOD generaliza-
sponses do not exist in the ground-truth answers. tion after considering the results of human
For instance, VQAV 2–VG model gets penalized evaluation?
for answering “table” instead of “on table”12 (Q:
“Where is . . . ?”) or “sunny” instead of “clear” (Q: Method. We used Amazon Mechanical Turk to
“How is the weather?”). More examples in Fig. 5 collect human judgement about model responses
and App. C. This effect is expected to be more pro- on a random subset of 10K questions for each of
nounced for the OOD evaluation than IID, because the test sets—VQAV 2, GQA, VG and V IZ W IZ13 .
in IID a model can learn the format of the test an- We performed human evaluation of the responses
swer (“on table” vs. “table”, “clear vs. sunny”) from the following models – V I LBERTDISC 14 and
from the train set, whereas in OOD the format in V I LBERTGEN trained on the VQAV 2, GQA, VG
the train set can be different from the test set. Also, datasets. We did not collect human judgements
such stringent evaluation (i.e., performing string for models fine-tuned on V IZ W IZ, because a sig-
matching with a small set of ground-truth answers) nificant proportion of the responses from these
is expected to hurt generative models more than models tend to be “unanswerable” or “unsuitable”
discriminative ones because they show more vari- (35% on VQAV 2, 39% on GQA, 65% on VG, and
ations in the form of the answers as they are not 64% on V IZ W IZ). Collecting human feedback
limited by a fixed answer vocabulary (e.g.., “pizza about such responses would not provide useful in-
slices” instead of “pizza” (Q: “What are these?”), sights, because all questions in VQAV 2, GQA
“pizzeria” instead of “pizza” (Q: “What kind of and VG should be answerable, therefore all cases
restaurant is this?”). To quantify the extent of this of “unanswerable” should be incorrect. Such re-
issue and measure its effect on discriminative vs. sponses are just a side effect of a model’s priors
generative models, IID vs. OOD settings, we per- caused by all the unanswerable training points in
form human evaluation of machine generated an- the V IZ W IZ fine-tune set.
swers and provide additional insights in Sec. 8. For each response, we asked 5 raters to evaluate
the question, image, and a given model response,
8 Human Evaluation 13
Since the size of V IZ W IZ test set is less than 10K, we
collected human judgement on all the V IZ W IZ test ques-
As discussed in Sec. 7, in our qualitative study, tions. However, we dropped the questions that were tagged
we observe that sometimes when the models’ re- as “unanswerable” or “unsuitable” (more details in App. D).
sponses are reasonable, they are marked as incor- The total number of V IZ W IZ test questions for which we col-
rect due to the evaluation metrics being stringent lected human judgement is 1440 (per model).
14
For V I LBERTDISC , we had initially collected human
12
Note that before computing the accuracy, both the pre- judgements for the version trained using the official code-
dicted and the ground truth answers are pre-processed for base, and we did not collect annotations again for our re-
answer normalization but such pre-processing is very ba- implementation due to time constraints. Given our results
sic. More details of the pre-processing can be found at above, we do not expect significant differences between the
https://visualqa.org/evaluation.html two versions.
13and indicate through a binary choice whether they Interestingly, this increase in model accuracies
considered the model response a correct answer from automatic evaluation to human evaluation
to the question or not. To control the quality of is higher for V I LBERTGEN than V I LBERTDISC
the data, we filtered out low quality data using for all the benchmarks. This is expected because
different heuristics such as distribution of yes/no the generative model is more likely to produce
answers for each worker, their mean submission longer, more varied answers, which might not be
times, average agreement with their fellow work- awarded using automatic metric but are still cor-
ers, or average alignment with the automatic ac- rect responses. Moreover, human evaluation helps
curacy 15 . In each of these cases we looked at OOD settings more than the IID settings for most
random samples from the outliers to qualitatively of the benchmarks (e.g., GQA, VQAV 2). This
confirm our hypothesis. More details about the hu- is also expected, because in the OOD settings, a
man evaluation interface are in App. D. model might not learn the format of the test an-
To compute human accuracy of a model re- swer (“on table” vs. “table”, “clear vs. sunny”)
sponse (for a given question and image), we con- from the train set (unlike in the IID settings) and
sidered a response correct if at least 4 raters voted hence it is more likely to be penalized by the auto-
it is correct, and incorrect otherwise. We decided matic accuracy metric.
so in order to decrease noise introduced by cases We conclude that the currently used accuracy
where there was low agreement between raters. metrics for VQA are not robust, especially for
generative models and OOD evaluation settings.
Results and Observations. We report the hu-
Hence, to more accurately evaluate the goodness
man accuracies for V I LBERTDISC and V I L-
of our models, we need to develop better auto-
BERTGEN in Fig. 6 (middle). We also report
matic evaluation metrics for VQA.17
the accuracies obtained using automatic metrics
(please see Sec. 3.2 for description of automatic Even after the human evaluation, models still
metrics for each dataset) computed over the same exhibit poor OOD generalization. We observe
random subset of test questions as that used for hu- that the human evaluation improves the models’
man evaluation in Fig. 6 (top). And lastly, in Fig. 6 accuracies and more so for the OOD than the IID
(bottom), we present the difference in human and settings. But, does this change the observation
automatic accuracies. that models generalize poorly to OOD settings?
We next remark on the main observations from The answer is No. From Fig. 6 (middle), we can
this result. see that the models’ performance in OOD settings
is still worse compared to that in IID settings (note
Human evaluation yields significantly higher
that for V IZ W IZ benchmark, we do not have the
accuracies than automatic evaluation. As we
IID accuracy, as explained before), although the
can see from Fig. 6 (bottom), there is a signifi-
magnitude of difference between IID and OOD
cant increase (up to 33.5%) in model accuracies
accuracies is reduced compared to that with au-
from automatic evaluation to human evaluation.16
tomatic evaluation. We also note that, while with
This implies the current automatic metrics miss
the automatic evaluation, V I LBERTDISC usually
out on a lot of correct responses due to their strin-
outperformed V I LBERTGEN , with human evalu-
gent nature—string matching with a small set of
ation, V I LBERTGEN outperforms V I LBERTDISC
ground-truth answers. Tab. 12 shows some exam-
for all the test sets. This reinforces the observa-
ples for responses which were awarded 0.0 accu-
tions made in Sec. 4.2 regarding stronger OOD
racy using automatic metrics but were marked as
generalization capabilities of generative models
correct by all 5 raters during human evaluation.
over discriminative models.
15
How frequently a worker’s response (yes/no) aligns with
the automatic accuracy computed (100.0/0.0). More specif- Discussion on VQA data quality For the col-
ically, we equate the worker’s yes response with 100.0 and lected human judgement data, we find that for a
no with 0.0 and look at the average difference between the significant number of questions (32%) there was
worker’s response and the automatic accuracy
16 17
For some cases, such as models fine-tuned on VQAV 2 or In this study we focus on standard evaluation metrics for
GQA and tested on VQAV 2, and models fine-tuned on GQA each benchmark. However, it would be interesting to evaluate
and tested on GQA, human evaluation yields lower accuracy the robustness of metrics such as WUPS (Malinowski and
than automatic evaluation. We discuss this under “Discussion Fritz, 2014) that compute answer similarities based on the
on VQA data quality”. distance between them in the WordNet (Miller, 1995) tree.
14You can also read