RESULTS PRESENTATION FY-2021 - Milan, March 14th 2022 - Prada Group
←
→
Page content transcription
If your browser does not render page correctly, please read the page content below

FY-2021
RESULTS PRESENTATION

     Milan, March 14th 2022
               1              March 14th 2022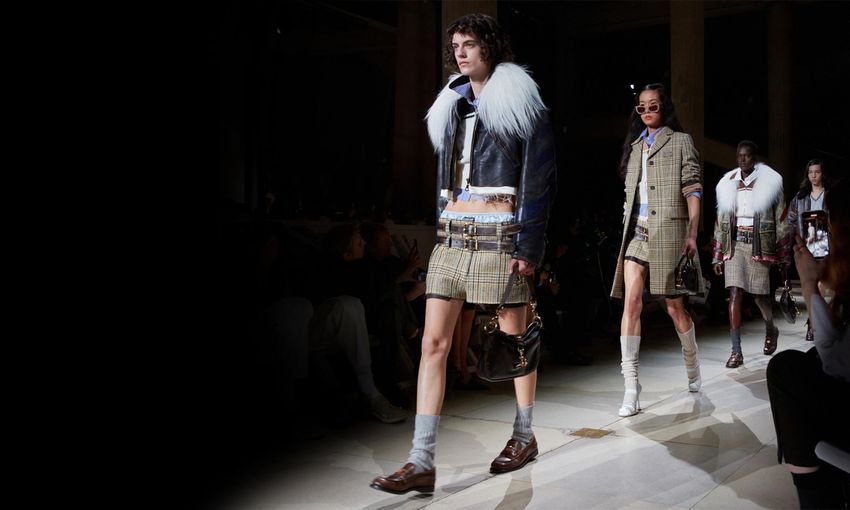
Agenda

Patrizio Bertelli – CEO
Business Update
Lorenzo Bertelli – Marketing Director and Head of CSR
Key ESG and Marketing Initiatives
Alessandra Cozzani – CFO
FY-2021 Financial Review
Paolo Zannoni – Executive Chairman
Outlook
Q&A Session

                                2                       March 14th 2022
Agenda

Patrizio Bertelli – CEO
Business Update
Lorenzo Bertelli – Marketing Director and Head of CSR
Key and ESG Marketing Initiatives
Alessandra Cozzani – CFO
FY-2021 Financial Review
Paolo Zannoni – Executive Chairman
Outlook
Q&A Session

                                3                       March 14th 2022
2021 Strategic Progress (1/2)
                                          On track

          Prada Group’s                      Style, Quality,                    Focus on
         Distinctive Vision               And Unique Products               Direct Distribution

• Continued to evolve coherently    • Strong growth across all       • Strengthened direct channels and
  with the market, reinterpreting     categories                       invested in store network
  luxury                            • Increased product value and    • Special pop-up: 68 Prada and
• Relevant, sustainable and           broadened price architecture     12 Miu Miu in FY-21
  impactful                         • Introduced new categories      • Outstanding online growth

                                                      4                                    March 14th 2022
2021 Strategic Progress (2/2)
                                             On track

       Industrial Know-How                  Increased Commitment               Investment in People and
      and Vertical Integration                  to Sustainability              Technology infrastructure

• Increased vertical integration      • Two new Board members with          • Continued to invest in human
                                        strong sustainability credentials     resources and new talents
• Reduced complexity
                                      • Substantial Board-level gender      • Technology and IT transformation
• Invested in manufacturing sites
                                        parity                                programme ongoing
  and capabilities
                                      • Scope 1 & 2 emissions reduction
                                        on track

                                                         5                                        March 14th 2022
Results Highlights - Revenues
                                 Strong growth in 2021

• Retail sales up +15% vs. FY-19, with a marked
  acceleration in Q4 at +24%

• Relevance with domestic consumers globally

• Remarkable performance in Asia, Americas,
  Middle East. Europe also above 2019

• Acceleration across all product categories

• Outstanding online growth: FY-21 online sales
  5x FY-19 level

• Total revenues up +8% vs. FY-19
  notwithstanding voluntary meaningful wholesale
  rationalisation

                                                   6         March 14th 2022
Results Highlights - Profitability & Cash Flow
                            Excellent progress in 2021

• Gross margin at 75.7% for FY-21,
  with H2 at 76.8%

• EBIT margin at 14.5% for FY-21,
  with H2 at 17.4%

• Strong operating cash flow (€ 751 mln)
  with further improvement in net working
  capital driven by supply chain excellence

• Positive net financial position of € 238 mln at
  year-end

                                                    7             March 14th 2022
2022 Priorities
                           Continue long-term strategy for growth
• Constantly adapt to highly complex and fast-
  evolving environment

• Continue to increase product content, quality
  and uniqueness

• Reinforce dialogue with younger generations
  and customer engagement

• Further invest in digital and in our retail network
  to enhance the customer experience

• Streamline manufacturing processes
  and shorten supply chain

• Integrate ESG strategy fully within the business

                                                        8           March 14th 2022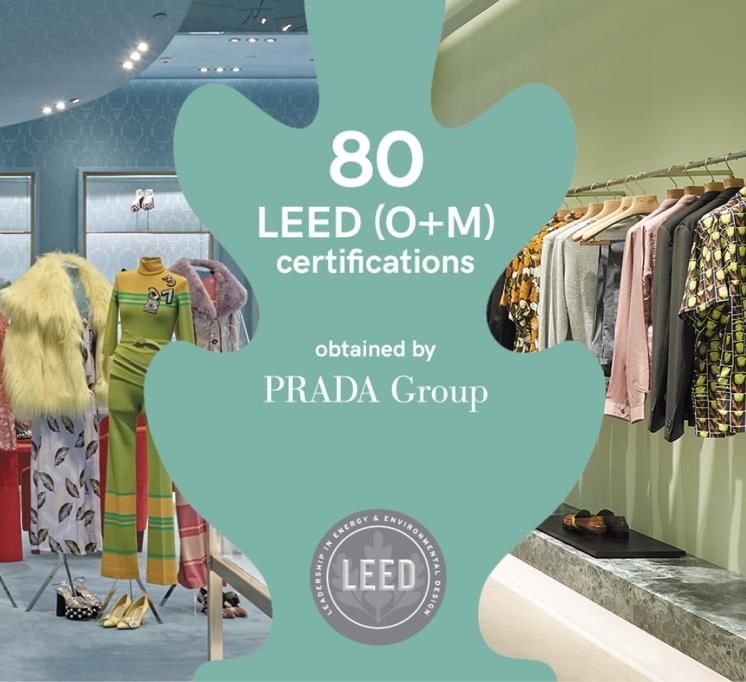
Agenda

Patrizio Bertelli – CEO
Business Update
Lorenzo Bertelli – Marketing Director and Head of CSR
Key and ESG Marketing Initiatives
Alessandra Cozzani – CFO
FY-2021 Financial Review
Paolo Zannoni – Executive Chairman
Outlook
Q&A Session

                                9                       March 14th 2022
Prada: pioneer in marketing and communications
                       Highly successful brand moments and campaigns

Innovative fashion   Successful Prada     TikTok Prada Bucket New interpretation   First-of-its-kind
show formats.        Men’s advertising    Hat Challenge       of gaming            NFT collaboration
Excellent            campaign featuring
performance          Tom Holland          • 9.5 bn views       • Prada Linea       • adidas for Prada
• Prada FW22         • Engagement rate:  • #2 searched           Rossa Riders        re-source
  Menswear show        +181% vs avg 2021   women’s product       Republic®
  Mentions: 72k                            brand in Q4-21        in partnership
  + 42% vs FW21                            LYST ranking          with Ubisoft
• Prada FW22
  Womenswear show
  Mentions: 63k
  +132% vs FW21

                                                   10                                     March 14th 2022
Miu Miu: high visibility marketing and communications
Coherent with brand DNA
Miu Miu successful Basic Instincts: Miu Miu SS22 Viral Mini-Skirt:
fashion show format advertising campaign featuring
Hailey Bieber • Most in demand item of the
Partnership with New collection
Balance to further • Engagement rate:
support the Miu Miu +8,3% vs avg 2021 • Outstanding visibility in media
exposure exposure and celebrities
• Mentions: • Dedicated independent fan
+88% vs SS21 pages and social media
accounts
11 March 14th 2022Brand heat and leadership: Prada & Miu Miu FY 2021
Prada.com
website traffic1
+59% visits YOY
miumiu.com
website traffic1
+13%
visits YOY
Share of Search
effectiveness2 +55%
2021 vs 2020
Share of Search
effectiveness2 +35%
2021 vs 2020
Among the
hottest brands Top 3
Q4 2021 Lyst Index
Entering
the ranking # 20
Q4 2021 Lyst Index
1 Source Adobe Analytics
2 Source Adobe Analytics - Growth of search traffic to website, including natural and paid search (not limited to Google)
12 March 14th 2022ESG Agenda
Three pillars across Group activities
We commit to shape our We commit to an inclusive, We commit to share
operations to reduce our creative and fair workplace our values and to build a
footprint sustainable society
• Mitigate our impact • Champion diversity and • Contribute to cultural
on climate change promote inclusion debate
• Preserve the • Foster creativity and • Further sustainability
ecosystems knowhow preservation literacy
• Embrace circular • Ensure wellbeing and • Inspire scientific
thinking fair workplace evolution
WITH PARTNERS
We commit to engage with our partners to strengthen our sustainability path
13 March 14th 2022Continued ESG focus
Concrete actions and progress
Governance Climate Strategy Materials Innovation Diversity & Inclusion
• ESG Board Committee • SBTs business ambition • Re-Nylon: achieved • Substantial gender
formalized for 1.5°C (*) full conversion parity at Board level
• Pamela Culpepper and • Scope 1 & 2 emissions • New strategic • First luxury fashion
Anna Maria Rugarli reduction on track, membership with Group to join The
appointed to the Board identification of scope Textile Exchange Valuable 500
and already focused on 3 reduction actions
ESG progress • Full certification by • Progress on DE&I
• Carbon neutral for Leather Working Group agenda (**)
scope 1 & 2 emissions by 2023
by mid-2022
• Leading position in
LEED green building
certifications
(*) Science based targets initiatives (**) Diversity, Equity and Inclusion
14 March 14th 2022Agenda
Patrizio Bertelli – CEO
Business Update
Lorenzo Bertelli – Marketing Director and Head of CSR
Key and ESG Marketing Initiatives
Alessandra Cozzani – CFO
FY-2021 Financial Review
Paolo Zannoni – Executive Chairman
Outlook
Q&A Session
15 March 14th 2022Key Financials Summary
Solid growth and continued profitability improvement
FY Revenues: FY EBIT: FY Operating Cash Flow **:
€3,366m (+41% vs. 20 / +8% vs. 19) * €489m € 751m
Retail Revenues (€m) and growth (%) * EBIT (€m) and margin (%) Net Financial Position (€m) ***
+15%
+40%
2.931
2.931
2.931 14.5%
9.5% 0.8%
2.6362.636
2.636
2.115
2.115 499 499 238 238
238
2.115 489
307
307307
2020 20 -311-311
-311
-406
-406
-406
FY-19 FY-20
FY-19
FY-19 FY-20 FY-21
FY-20 FY-21
FY-21 FY-19 FY-20
FY-19
FY-19 FY-20 FY-21
FY-20 FY-21
FY-21 FY-19 FY-20
FY-19
FY-19 FY-20 FY-21
FY-20 FY-21
FY-21
(**) Generated by operating activities
(*) at constant exchange rates (%)
(***) (Net debt) / Net Cash position
16 March 14th 2022Net sales by Channel
Retail sales well above 2019 levels more than offsetting wholesale rationalisation
Wholesale
€ mln / % change same FX FY 21 FY 21 vs. FY 21 vs. 10%
FY 20 FY 19 DFS
2%
Retail 2,931 +40% +15%
Wholesale 386 +41% -29%
Total 3,317 +40% +8%
Retail
88%
Retail
• Excellent performance driven by full price sales
• 10% of stores closed on average during the period (17% in H1 and 3% in H2)
• Outstanding growth in online sales (5x FY-19 and strong double digit vs. FY-20)
• Stable retail network: 635 DOS end of December 2021, +2 net vs. FY-20
Wholesale
• Selective approach to traditional wholesale and e-tailers
17 March 14th 2022Retail sales trend
Strong acceleration vs. 2019
24%
18%
13%
3%
Q1-21 Q2-21 Q3-21 Q4-21
% average 22% 13% 3% 2%
store closed
18 March 14th 2022Retail sales by Geography
Outstanding growth in US, Asia and ME, good rebound in EU and JP
Middle East
€ mln / % change same FX FY-21 FY 21 vs. FY 21 vs. 4%
FY 20 FY 19
Asia Pacific 1,192 +29% +30%
Japan
Europe 749 +35% -11% 10% Americas
20%
Americas 572 +103% +69%
Japan 297 +16% -17%
Middle East 121 +62% +43% APAC Europe
41% 26%
Total 2,931 +40% +15%
Asia Pacific
• Very solid double digit growth on a 2-year stack notwithstanding
renewed restrictions in August and December
• Sustained demand in key markets throughout the period vs. 2019:
China +56%, Korea +90%, Taiwan +61%
Europe
• Solid rebound in H2-21 driven by local customers
• Turned positive in Q4-21 above 2019 levels, in spite of renewed Japan
COVID-19 restrictions • Covid-19 restrictions highly impacting sales in the first 9 months
• Gradual recovery, returning to 2019 sales levels in Q4-21
Americas
• Sharp increase troughout the year Middle East
• Strong progress across all countries: US, Canada and Latin America • Strong growth driven by locals and some resumption in tourism
19 March 14th 2022Retail sales organic growth vs. 2019 by Geography
Outstanding growth in US, Asia and ME, good rebound in EU and JP
Asia Pacific Europe Americas Japan Middle East
82%
60%
53%
35%
28%
25%
2%
H1-21 H2-21 H1-21 H2-21
H1-21 H2-21 H1-21 H2-21 H1-21 H2-21
-10%
-24%
-29%
20 March 14th 2022Retail sales by Product
Acceleration across all categories – all growing double digit in H2-21 vs. 2019
Other
€ mln / % change same FX FY 21 FY 21 vs. FY 21 vs. 2%
FY 20 FY 19
Leather Goods 1,530 +31% +7%
Shoes
18%
Ready to Wear 826 +53% +36%
Footwear 521 +49% +16%
Other 54 +70% -5% Leather Goods
52%
RTW
Total 2,931 +40% +15% 28%
Leather Goods
• High demand from iconic and new bags lines
• Outstanding growth from accessories
• Well balanced growth across multiple price points and materials
Ready to Wear
• Superior performance testifying design leadership
• Success of Prada and Miu Miu collections
• Progress in high-performance fashion sportswear: Linea Rossa, Adidas/Prada Re-nylon
Footwear
• Lifestyle and new collections drove a sharp acceleration in H2-21
21 March 14th 2022Retail sales by Brand
Outstanding performance of the Prada brand, Miu Miu turnaround on track
Church's Other
€ mln / % change same FX FY 21 FY 21 vs. FY 21 vs. 1% 1%
FY 20 FY 19
Prada 2,537 +44% +21%
Miu Miu
12%
Miu Miu 347 +20% -7%
Church’s 30 +11% -41%
Other (*) 17 +67% -9%
Prada
Total 2,931 +40% +15%
87%
(*) includes Marchesi and Car Shoe
Prada
• Robust growth on a 2-year basis, accelerating QoQ
• Double digit growth across all categories relative to 2019 in both semesters
Miu Miu
• Sequential improvement across the year vs. 2019
• Outstanding performance in RTW, strong double-digit growth vs. 2019
• Success of denim collections / Upcycled by Miu Miu collaboration with Levi’s
Church’s
• Heavily impacted by the unfavourable geographic exposure (~80% sales generated in EU)
22 March 14th 2022Gross margin development
Margins at record high
+5.2% -0.5% 76.8%
+2.9% -0.3%
74.3%
72.1%
71.7%
+260 bps vs. 19 +470 bps vs. 19
H2-2019 product FX H2-2021
H1-2019 product FX H1-2021
channel
channel
country
country
• Gross margin increased to ~ 77% in H2
• Driven by richer product mix, channel / country mix and scale
23 March 14th 2022Operating costs
Effective cost management, increasing investments in A&P
€ mln
+43 2,058
+73 2,058 2,013 -48 +63 -12
+13 949
+87
+161
1,723
FY-20 Selling A&P PD G&A FY-21 FY-19 Selling A&P PD G&A FY-21
• Total opex increased by:
+19% vs. 2020 (+20% at constant fx)
+2% vs. 2019 (+4% at constant fx)
24 March 14th 2022EBIT bridge
Sharp profitability improvement in H2
€ mln
+29 -71
+209
324
+124
+26 166 156
150 -69
+58
+107% vs. 2019
+10% vs. 2019 +50% vs. 2020
H1-19 Revenues Gross Opex H1-21 H2-19 Revenues Gross Opex H2-21
Margin Margin
EBIT 11% 9% 17%
Margin 10%
25 March 14th 2022Capex
Invest in our retail network, supply chain and IT backbone
€ mln
216
71
Corporate, IT & Industrial
122
Real estate 59
Retail 61
86
61
FY-2
FY-200 FY-2
FY-211
• 2 net openings
• ~ 120 renovation and relocation projects
26 March 14th 2022Net Operating Working Capital
Supply chain excellence
€ mln
602
667
290 329
Trade Payables
Trade Receivables
666 663
Inventory
-290
-390
FY-20 FY-21
FY 2 0 FY 2 1
• Significant improvement in NWC, closing the year at 18% on sales, well below 2019 level
• Trade payables up due to increasing production activities
27 March 14th 2022Net Financial Position
€ mln
Opening Net financial position surplus / (deficit) - 31/12/2020 (311)
Consolidated Net Result 295
Net Working Capital 72
Depreciation and Amortization / other non monetary items 388
Investments -219
Dividends -91
Other 104
Closing Net financial position surplus / (deficit) - 31/12/2021 238
28 March 14th 2022Agenda
Patrizio Bertelli – CEO
Business Update
Lorenzo Bertelli – Marketing Director and Head of CSR
Key and ESG Marketing Initiatives
Alessandra Cozzani – CFO
FY-2021 Financial Review
Paolo Zannoni – Executive Chairman
Outlook
Q&A Session
29 March 14th 2022Outlook
Deliver long-term strategy for growth
2021 was a turning point for Prada
Decisive actions to evolve the business
delivered strong growth and increased
profitability
Robust start to 2022, long-term strategy
well on track
On course to meet our medium-term targets
The Group will continuously monitor, react
and adapt to increasingly complex business
environment
30 March 14th 2022Q&A session
31 March 14th 2022APPENDIX 32 March 14th 2022
Condensed P&L
€m                                      FY 2019               FY 2020                 FY 2021
Net Revenues                     3,226        100%     2,423        100%       3,366            100%

COGS                             -906         -28.1%   -679         -28,0%      818             -24,3%

Gross Margin                     2,320        71.9%    1,743        72.0%      2,547            75.7%

Selling                          -1,470       -45.6%   -1,260       -52.0%     1,421            -42.2%

Advertising & Promotion          -231         -7.2%    -207         -8.5%       294             -8.7%

Design and Product Development   -127         -3.9%    -102         -4.2%       115             -3.4%

G&A                              -184         -5.7%    -154         -6.4%       227             -6.7%

Operating expenses               -2,013       -62.4%   -1,723       -71.1%     -2,058           -61.1%

EBIT                              307         9.5%      20          0.8%        489             14.5%

Total Financial expenses          -72         -2.2%     -72         -3.0%       -68             -2.0%

EBT                               235         7.3%      -52         -2.1%       422             12.5%

Income Taxes                      23          0.7%       -3         -0.1%      -127             -3.8%

Minority Income                    2          0,1%       0              0.0%     1              0.0%

Group Net income / (Loss)         256         7.9%      -54         -2.2%       294             8.8%

Total D&A                        -690         -21.4%   -669         -27.6%     -631             -18.7%

EBITDA                            997         30.9%     689         28.4%      1,120            33.3%

                                                  33                                  March 14th 2022
Condensed Balance Sheet
€m 31 Dec 2019 31 Dec 2020 31 Dec 2021
Right of use 2,363 2,054 1,956
Non current assets (excl deferred tax assets) 2,671 2,507 2,490
Net operating working capital 703 667 602
Other current assets / (liabilities), net -6 25 -163
Other non current assets / (liabilities), net 79 42 51
Net invested capital 5,809 5,296 4,936
Consolidated shareholders’ equity 2,989 2,852 3,129
Net financial position (surplus) / deficit 406 311 -238
Long term lease liability 2,006 1,730 1,627
Short term lease liability 410 404 418
Total 5,809 5,296 4,936
Operating cash flow 362 262 751
Net working Capital / Sales 22% 28% 18%
Capex 302 122 216
Debt / Equity 14% 11% negative
34 March 14th 2022You can also read