Redefining MCC's Candidate Pool: Evaluating Alternative Approaches to Measuring Distribution of Poverty - Prepared for the Millennium Challenge ...
←
→
Page content transcription
If your browser does not render page correctly, please read the page content below
Redefining MCC’s Candidate Pool:
Evaluating Alternative Approaches to
 Measuring Distribution of Poverty

   Prepared for the Millennium Challenge Corporation

                          By
                    Tianhui DiLuzio
                      Yoona Kim
                       Xin Nong
                       Fei Wang

         Workshop in International Public Affairs
                      Spring 2016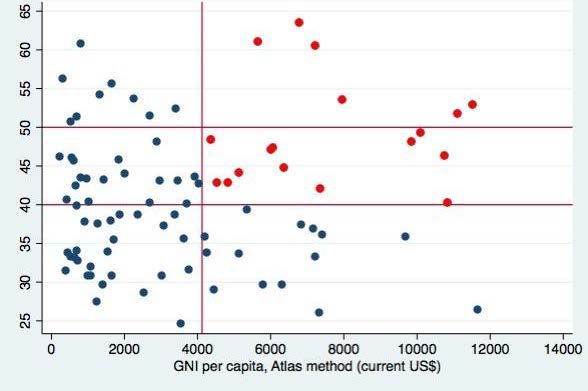
©2016 Board of Regents of the University of Wisconsin System
                                        All rights reserved.

                                         For an online copy, see
               www.lafollette.wisc.edu/research-public-service/workshops-in-public-affairs
                                    publications@lafollette.wisc.edu

         The Robert M. La Follette School of Public Affairs is a teaching and research department
           of the University of Wisconsin–Madison. The school takes no stand on policy issues;
                    opinions expressed in these pages reflect the views of the authors.

The University of Wisconsin–Madison is an equal opportunity and affirmative-action educator and employer.
                        We promote excellence through diversity in all programs.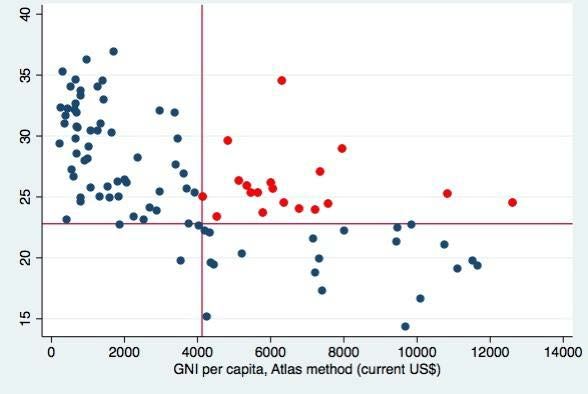
Table of Contents
List of Tables and Figures.............................................................................................................. iv
Foreword ..........................................................................................................................................v
Acknowledgments.......................................................................................................................... vi
Executive Summary ...................................................................................................................... vii
Introduction ......................................................................................................................................1
Section I. Literature Review ............................................................................................................3
   A. The Changing Distribution of Global Poverty and Inequality ................................................3
   B. Measurement of World Poverty ..............................................................................................4
   C. Multidimensional Measurement ..............................................................................................5
Section II. A Grandfather Clause for Graduating Countries............................................................5
Section III. Criteria for Analysis ......................................................................................................8
   A. Comprehensiveness .................................................................................................................9
   B. Conceptual Fidelity .................................................................................................................9
   C. Comparability ..........................................................................................................................9
   D. Data Quality ............................................................................................................................9
Section IV. Policy Alternatives......................................................................................................10
   A. Fragile States Index Combined with the Status Quo ............................................................10
   B. Poverty Headcount Ratio at International Poverty Lines Combined the Status Quo............13
   C. Poverty Headcount Ratio at National Poverty Lines Combined the Status Quo ..................16
   D. Inequality Measure Combined with the Status Quo .............................................................18
Section V. Recommendation .........................................................................................................21
Appendices .....................................................................................................................................23
   Appendix A. ...............................................................................................................................23
   Appendix B ................................................................................................................................24
References ......................................................................................................................................25

                                                                        iii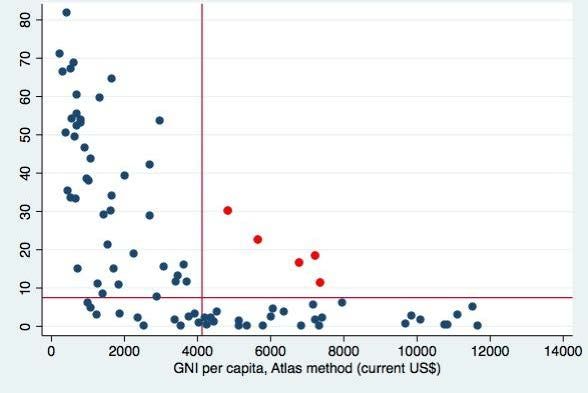
List of Tables and Figures
Figure 1. Decreasing MCC Candidate Pool .................................................................................1

Table 1. Percentage of Poor Living in LICs/LMICs and UMICs ................................................3

Table 2. Simulation Results of Graduated Countries in the Next 10 Years ................................7

Table 3. List of Graduated Countries ...........................................................................................8

Figure 2. Cutoff Line of Fragile States Index ............................................................................11

Table 4. Additional Countries under the Fragility Alternative ..................................................12

Table 5. Additional Countries under $3.10 per Day IPL Alternative ........................................13

Figure 3. Scatter Plot of Poverty Headcount Ratio at $1.90 per Day IPL .................................14

Figure 4. Scatter Plot of Poverty Headcount Ratio at $3.10 per Day IPL .................................14

Table 6. Additional Countries under NPLs Alternative .............................................................16

Figure 5. Scatter Plot of Poverty Headcount Ratio at NPLs ......................................................17

Figure 6. Scatter Plot of GINI Index ..........................................................................................19

Table 7. Additional Countries under 50 GINI Index Thresholds ..............................................19

Table 8. Additional Countries under 40 GINI Index Thresholds ..............................................20

                                                                iv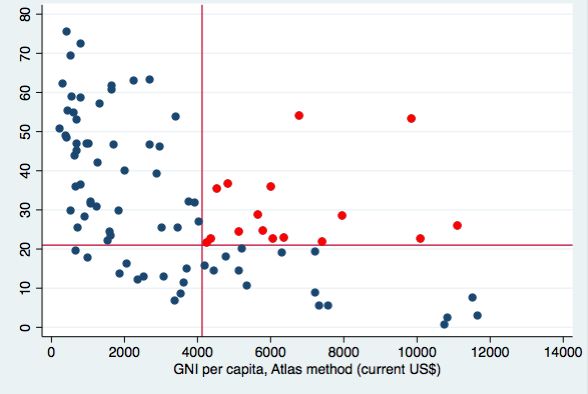
Foreword
The La Follette School of Public Affairs at the University of Wisconsin-Madison offers a two-
year graduate program leading to a Master of Public Affairs or a Master of International Public
Affairs degree. In both programs, students develop analytical tools with which to assess policy
responses to issues, evaluate implications of policies for efficiency and equity, and interpret and
present data relevant to policy considerations.

Students in the Master of International Public Affairs program produced this report for the
Millennium Challenge Corporation. The students are enrolled in the Workshop in International
Public Affairs, the capstone course in their graduate program. The workshop challenges the
students to improve their analytical skills by applying them to an issue with a substantial
international component and to contribute useful knowledge and recommendations to their client.
It provides them with practical experience applying the tools of analysis acquired during three
semesters of prior coursework to actual problems clients face in the public, nongovernmental,
and private sectors. Students work in teams to produce carefully crafted policy reports that meet
high professional standards. The reports are research-based, analytical, evaluative, and (where
relevant) prescriptive responses for real-world clients. This culminating experience is the ideal
equivalent of the thesis for the La Follette School degrees in public affairs. While the acquisition
of a set of analytical skills is important, it is no substitute for learning by doing.

This report grapples with a central challenge in development: the growth in incomes in many
poor countries in recent decades. This has had the positive effect of lifting many countries out of
the lowest income categories. But many poor people still live in those countries. Aid agencies,
like the Millennium Challenge Corporation, have to reconsider what it means to fund poverty
reduction under these new circumstances. This report is the second in a series completed by the
La Follette School that considers new ways of measuring poverty. The analysis uses simulations
to identify which countries would still be considered eligible for funding under each approach.

The opinions and judgments presented in the report do not represent the views, official or
unofficial, of the La Follette School or of the client for which the report was prepared.

                                                                   Professor Donald P. Moynihan
                                                                Epstein Professor of Public Affairs
                                                                                        May 2016
                                                                              Madison, Wisconsin

                                                 v
Acknowledgments
We would like to express thanks to all of the faculty and staff at the La Follette School of Public
Affairs, for without their academic knowledge, technical help, and moral support, the production
of this report would not have been possible. First and foremost we are grateful to Professor
Donald Moynihan for his guidance throughout the semester. We would also like to thank
Professor Valerie Kozel and Professor Timothy Smeeding for their advices on issues. Finally, we
would like to thank the Millennium Challenge Corporation for providing us with the opportunity
to work on a project that aspires to help combat global poverty.
viExecutive Summary
The Millennium Challenge Corporation (MCC) – a U.S. foreign aid agency – faces a gradually
decreasing number of candidates eligible for funding. Federal law requires that only low-income
countries or lower-middle income countries as classified by the World Bank are eligible for
MCC assistance. As incomes in poorer countries have increased, 36 countries have graduated
from eligibility and more will follow, even as there remains high poverty in many of these
countries. Therefore, MCC is interested in identifying alternative measures of poverty so that it
can be sure it is engaging those countries where MCC assistance may have the greatest impact.
The criteria with which we evaluate each alternative measurement include comprehensiveness,
conceptual fidelity, comparability, data quality, and feasibility. The comprehensiveness criterion
accounts for the number of countries and population that are added into the MCC candidate pool
under each policy option. Conceptual fidelity examines whether the data used is directly related
to poverty or if it measures other issues that could have an effect on poverty. The comparability
criterion asks if each data set relies on the same baseline measurement (e.g., is poverty measured
in income or consumption?). Data quality ensures that the source information is credible, up-to-
date with the most accurate and reflective information. Finally, feasibility examines whether the
policy alternative requires Congressional approval.
We evaluate four policy options, which we combine with the current gross national income
(GNI) per capita measurement. The four alternatives are:
(1) Fragility index: this index is generated by the Fund for Peace organization and evaluates
social, economic, and political indicators and provides a score for each country. The argument
for this index is that a higher income country no longer eligible for MCC assistance could still
suffer from issues such as regional conflicts or unstable circumstances that could contribute to
lower societal well-being.
(2) Poverty headcount ratio at international poverty lines (IPLs): this alternative would allow
MCC to work with upper-middle income countries (UMICs) with poverty rates at IPLs above a
certain level.
(3) Poverty headcount ratio at national poverty lines (NPLs): this alternative would qualify
UMICs with poverty rates at NPLs above a certain level for MCC’s assistance.
(4) Measure of inequality: this alternative would allow MCC to focus on UMICs with high
inequality even with high GNI per capita.
We offer two recommendations. First, that MCC propose to Congress that it be allowed to adopt
a grandfather clause. This would allow a country to continue to be considered for funding for
five consecutive years after it graduates from the traditional threshold if the GNI per capita is
still below a certain cutoff line. The World Bank poverty guidelines are the basis for MCC
statutory guidance on poverty, but the Bank and other funders have responded to growing
incomes in poorer countries by adopting such grandfather clauses. MCC already has clear
Congressionally approved funding criteria, and the grandfather provision would simply allow
MCC to apply that guidance to a broader array of countries.
viiWe also recommend applying a poverty headcount ratio at $3.10 per day IPL to UMICs
combined with the status quo when selecting candidate countries. This policy option offers the
best array of outcomes based on our criteria. It excels in terms of conceptual fidelity and
comparability, relying on a direct measure of poverty and using the same baseline for
comparison across countries. Adopting this alternative will add eight additional countries with
150 million poor people to MCC’s candidate pool.
viiiIntroduction
The Millennium Challenge Corporation (MCC) is a U.S. foreign aid agency with a goal of
reducing global poverty through economic growth. It was created by the Millennium Challenge
Act of 2003, which provides specific guidance about the types of countries MCC may fund.
MCC must determine “(a) a country’s demonstrated commitment to (i) just and democratic
governance, (ii) economic freedom, and (iii) investments in its people; (b) the opportunity to
reduce poverty and generate economic growth in the country; and (c) the availability of funds to
the MCC” (MCC 2016 candidate report). MCC uses a scorecard system that consolidates an
individual country’s scores for each of the policy indicators, and to determine a country’s
eligibility for funding assistance programs. For MCC scorecard purposes, countries with gross
national incomes (GNIs) per capita of $1,985 or less are defined as low-income countries (LICs)
and those with GNIs per capita between $1,986 and $4,125 are considered lower-middle income
countries (LMICs) for fiscal year (FY) 2016. For selection purposes, MCC defines the poorest 75
countries as LICs and the remaining countries up to the UMIC threshold of $4,125 as lower-
middle income countries (LMICs).
In FY 2007, MCC identified 99 candidate countries: 69 LICs and 30 LMICs; however, the
candidate pool has been gradually decreasing (see Figure 1). In FY 2016, MCC’s candidate pool
has 65 low-income countries and eight lower-middle income countries. Since 2004, 33 countries
have graduated beyond the income limits for MCC assistance (MCC, 2015).
Figure 1. Decreasing MCC Candidate Pool
Countries are graduating from MCC-funding eligibility in large part due to successful economic
development and an increased GNI per capita. While it is encouraging to see economic
development in many countries, there are still concerns as to whether foreign assistance is
reaching as many of the global poor as possible.
Even with high GNI per capita numbers, a country could still have many people living in
poverty. For example, Brazil is a graduated upper-middle income country (UMIC) with GNI per
capita of $11,790. It also has a poverty headcount ratio at national poverty lines (NPLs) of 7.4%.
1With total population of 206.1 million, approximately 15 million people live under Brazil’s
national poverty line.
Using a poverty headcount ratio at the international poverty line (IPL) of $1.90 per day, 9.6
million people in Brazil live in poverty. Under status quo, 149 million to 177 million people
living under the IPL of $1.90 per day are excluded from MCC assistance. Table 3 presents the 36
countries that have graduated out the MCC candidate pool with poverty headcounts at national
poverty lines (NPL). Nearly 70 million people live in poverty at NPLs in these graduated
countries. This raises concerns about whether the current statutorily imposed measurements of
poverty are flexible enough to take into account poor populations in UMICs.
Because the Millennium Challenge Act does not allow assistance to countries that have
graduated out of the $4,125 GNI per capita threshold, MCC cannot provide assistance to a
country that has seen income growth but continues to face serious poverty. In a recent report of
the Center for Global Development, Rose, Birdsall, and Diofasi (2016) address the discrepancy
between MCC’s mission and the statutory definition of poverty. Exploring alternatives for MCC
to create a better candidate pool that reflects the significant poverty and development need in
potential partner countries, they suggest a combined measure of median household income or
consumption with GNI per capita.
With a growing disparity between MCC’s mission to serve the world’s poor and the constraints
that determine who can receive support, the organization is seeking alternative approaches to
measuring poverty that are comprehensive, comparable, and reliable, and also capture countries
that graduate under the status quo approach. We examine four alternatives:
• a fragility index combined with GNI per capita
• a poverty headcount ratio at IPL combined with GNI per capita
• a poverty headcount ratio at NPL combined with GNI per capita
• inequality measures combined with GNI per capita
To assess these alternatives, we apply the following criteria for poverty measurement:
comprehensiveness, concept fidelity, comparability, data quality, and feasibility. The optimal
poverty measure should be the most comprehensive in including the majority of the world’s poor
population, and the data should have the same baseline measures (income or consumption) to
ensure comparability across countries. We consider three aspects (third-party verification,
frequency of update, and number of countries surveyed) to ensure data quality. All the data were
verified by the World Bank or credible think tanks (i.e. Fund for Peace). The desired frequency
of update would be annually or intervals less than five years. In general, more countries surveyed
will be considered more comprehensive data that is of accurate representation. Finally, we take
into account of the feasibility of statutory change when analyzing the alternatives.
The paper is organized as follows. Section II reviews research on how poverty is measured.
Section III explains the criteria used to evaluate each policy alternatives. Section IV proposes the
“grandfather clause.” Section V evaluates policy alternatives, and Section VI provides our policy
recommendation.
2Section I. Literature Review
A. The Changing Distribution of Global Poverty and Inequality
We first review the distribution of global poverty to inform our poverty metric analysis.
Traditionally, poverty was regarded as an issue for LICs only or sometimes for LMICs.
According to the World Bank, 97 percent of the world’s poor lived in LICs or LMICs in fiscal
year 1996. However, the landscape of poverty has changed dramatically over the last twenty
years. In fiscal year 2016, the portion of the poor in LICs or LMICs decreased to 79 percent, and
21 percent of the poor lived in UMICs. The change is largely due to China’s development. China
was an LIC in fiscal year 1996, but has graduated and become an UMIC in fiscal year 2012. As
Table 1 shows, 17 percent of the global poor lived in China in fiscal year 2016. Excluding China,
4 percent of the world’s poor lived in UMICs in fiscal year 2016.
Table 1. Percentage of Poor Living in LICs/LMICs and UMICs 1
FY 1996 FY 2016
LICs/LMICs 96.7% 78.9%
UMICs 3.3% 21.1%
China 41.1% 17.1%
India 26.0% 29.8%
Source: World Bank
While the last twenty years have witnessed the decrease of the number of poor people, the
triumph of the battle against poverty is accompanied by rising inequality within a country. We
consider the importance of inequality within countries when MCC is deciding which countries
should be included in the candidate pool. Ferreira and Ravallion (2008, 8-25) found that no
country has successfully developed beyond middle-income status while retaining a high level of
inequality in income or consumption. They found high inequality measures in sub-Saharan
Africa and Latin America and the Caribbean. Inequality is a bigger problem in developing
countries and there is little aggregate tendency for inequality levels to fall with economic growth.
Therefore, it may be difficult for a UMIC to grow into a high-income country (HIC) without
measures to combat poverty and inequality first. This phenomenon is known as the “MIC traps”
(Alonso et. al, 2014). Only one in 10 defined as MIC in 1960 had reached high-income status by
2010 (p. 5).
Given that more poor people live in richer countries, why should MCC allocate funds to these
countries? Reasons to support the development of a better measure of poverty include (Alonso
2007; Glenni 2011, p. 11):
• To contribute to the eradication of poverty
1 In this paper, we use $1.90 per day IPL to calculate the population of poor people.
3• To consolidate the social and economic progress already achieved, and reduce the risk of
falling back
• To support MICs’ contributions in the provision of international public goods
• To help MICs serve as poles of development at the regional level
• To ensure that the international aid system provides consistent incentives and rewards
Furthermore, Glenni (2011, 12) argues that foreign assistance should allocate funds to UMIC
because nationally, most poor people live in MICs; regionally, it will provide spillover effects to
nearby countries as MICs can provide “debt relief, technical assistance and cooperation to
support infrastructure investment, trade finance, institution building, public administration
reform and humanitarian assistance”; and globally, UMICs especially contribute to global
peacekeeping, security and migration operations, and are important actors in the prevention of
financial crises and infectious diseases in poorer countries. Alonso et. al (2014) states that the
more resources that a MIC has, the faster it will meet its development objectives and thus escape
the MIC trap.
B. Measurement of World Poverty
Measuring world poverty is a constant issue of debate, centering on what constitutes an
appropriate definition of poverty, the relative benefits of absolute versus relative poverty
indicators, and measurement of global poverty. Laderchi et al. (2003, 247) offer four approaches
in defining poverty:
• The monetary approach “identifies poverty with a shortfall in consumption (or income)
from some poverty line” (Laderchi et al., 2003, 247). Monetary dimension includes
income and consumption, both of which are derived from sample surveys of households.
Consumption is usually preferred because consumption may better reflect a household’s
ability to meet basic needs and income is often harder to measure, especially in
developing countries (Ravallion, 2010, 2).
• The capability approach “rejects monetary income as its measure of well-being, and
instead focuses on indicators of the freedom to live a ‘valued’ life” (Laderchi et al., 2003,
253). We examine a country's’ fragility index to take into account a country’s regional
conflicts, extensive corruption, or other issues that could prevent a person from leading a
“valued life.”
• Social exclusion shows whether individuals or groups are excluded from full
participation in the society in which they live
• Participatory methods aim to take into account the views of poor people in a country
instead of a monetary estimate being externally imposed.
Nobel Prize Winner Angus Deaton (2010, 6) is skeptical that it’s possible to make precise
comparisons of living standards between countries that differ widely. He argues that the current
approach to poverty lines is problematic and “that it can result in reductions in national poverty
causing increases in global poverty.” He finds it difficult to measure global poverty using one
uniform measure.
4Deaton (2001, 125) also criticizes the use of purchasing power parity exchange rates that are
used to turn the $1 per day poverty line into national currencies. He argues that “in practice, their
regular revision (to different base years with different relative prices) plays havoc with the
poverty estimates, changing them in ways that have little or nothing to do with the actual
experience of the poor.”
We aim to address Deaton’s concerns of the purchasing power parity and uniform measure of
poverty by combining a few poverty measurement techniques.
When evaluating poverty measurements, it is important to consider data quality. The data quality
assessment framework created by the International Monetary Fund (IMF) considers five
dimensions of data quality: integrity, methodological soundness, accuracy and reliability,
serviceability, and accessibility (Data Quality Assessment Framework, 2003). For integrity, data
should be generated in a professional and transparent fashion. Methodological soundness
requires concepts and definitions, scope, and classification systems to be consistent with
internationally accepted standards. Accuracy and reliability require source data to reflect
country-specific conditions and should be regularly assessed. Serviceability considers the
consistency and timeliness of the data, and accessibility takes into account whether the data is
user-friendly (Data Quality Assessment Framework, 2003).
C. Multidimensional Measurement
As discussed in the previous section, there are many approaches for measuring poverty.
Bourguignon and Chakravarty (2003, 26) suggest that a measure of poverty should depend on
income indicators as well as non-income indicators that identify aspects of welfare not captured
by income. A person’s expenditure in the market, child nutritional status, and personal
characteristics such as individual ability and physical handicap should be considered. Therefore,
we consider more than just monetary measurements of poverty.
Research has also shown that longevity, health, nutrition, and education are important indicators
for measuring welfare (Bibi, 2005). It is also noted that there is no clear relationship between a
reduction in monetary poverty and an improvement in other welfare indicators (p. 4). Therefore,
for a more rounded approach, we seek to analyze both monetary measurements of poverty and
non-monetary measurements.
We do not examine aspects of poverty related to health, education, and nutrition in our analysis
because last year’s report has already provided a comprehensive analysis of the multidimensional
measurement of poverty, and our focus lies on poverty lines across countries.
Section II. A Grandfather Clause for Graduating Countries
First, we examine the grandfather clause, which is a standalone suggestion. Simply put, this
would allow a country to continue to be considered for funding for five consecutive years (or a
similar period) after the country has graduated from the traditional threshold if the GNI per
capita is below its historical cutoff. The historical cutoff refers to the ceiling for International
Development Association (IDA) eligibility, which is $1,945 in FY 2013, whereas the GNI per
5capita for LICs in the same year is below $1,045. The historical cutoff is reset annually (World
Bank, 2013).This policy alternative can be implemented with any of the others we outline below,
one with the status quo, and so we present it as a standalone proposal.
A grandfather clause has been used by the IDA of the World Bank to continue lending money to
countries graduating from the IDA candidate pool. IDA applies three criteria to determine the
eligibility of transitional support: “a country’s GNI per capita below the historical cutoff at the
time of graduation; a significant poverty agenda, as measured by poverty levels and other social
indicators; a significant reduction in new commitments/net flows from the World Bank after
graduation from IDA.” Based on these criteria, India graduated from IDA at the end of fiscal
year 2014 but still receives transitional support on an exceptional basis from 2015 to 2017
(World Bank, 2013).
Simply reaching a pre-defined poverty threshold does not mean that poverty does not continue to
exist in the country or that a country might not slip back under that threshold in the short term.
Countries may still suffer from food scarcity, malnutrition, mortality, and other demographic
pressures, which are not fully captured by the World Bank’s poverty measure. Therefore, MCC
could apply the grandfather clause to graduating countries and allocate funds for them to address
these challenges.
Because MCC funding guidelines are based on World Bank standards, it makes sense to examine
how the Bank has dealt with the large migration of poverty into MICs. The grandfather clause is
a simple tool with no real costs, but it allows the funder to continue to allocate resources to a
wider proportion of the world’s poor. Following the World Bank model, the funding for
graduating countries can be less than the amounts received by LICs and LMICs in the candidate
pool but still be significant (World Bank, 2013).
In the case of the World Bank, countries are required to demonstrate that they have a poverty
agenda. Moreover, the poverty agenda can be measured by using a set of poverty and social
indicators. The poverty agenda works as a plan to reduce poverty. In this regard, the World Bank
uses the absolute number of poor and the incidence of poverty, Human Development Index,
regional disparities in income and poverty reduction, etc. However, we do not recommend that
MCC follow the Bank’s requirement that the country also have a poverty agenda because MCC
already has well-defined Congressional guidelines for funding poorer countries: a) a country’s
demonstrated commitment to (i) just and democratic governance, (ii) economic freedom, and (iii)
investments in its people; (b) the opportunity to reduce poverty and generate economic growth in
the country.
The grandfather clause would require statutory change, but it seems relatively feasible politically
because Congress passed a statute that allowed similar strategy in the past. Under the
Department of State, Foreign Operations, and Related Programs Appropriations Act in fiscal
year 2015, “a country that changes during the fiscal year from low income to lower-middle
income (or vice versa) will retain its candidacy status in its former income category for the fiscal
year and two subsequent fiscal years (MCC, 2015).”
6Under the grandfather clause, more countries that recently graduated could be included in the
candidate pool. By using a simulation, we find that in the next 10 years, 18 countries are
expected to graduate (Table 2). By applying the grandfather clause, the number of eligible
countries can be increased by 18. This estimate assumes all the countries’ GNI per capita will
grow at the average rate of the last five years and that the cut-off line for UMICs will increase at
the average rate of the last five years.
Table 2. Simulation Results of Graduate Countries in the Next 10 Years
Number of Global Poor
FY Expected Graduate Countries
(thousand)
2017 Samoa 0.02
El Salvador; Georgia; Indonesia;
2018 122.47
Nigeria; Sri Lanka
2019 Philippines 12.59
2020 Bolivia; Guatemala 2.54
2021 Armenia; Ukraine 0.07
Egypt; Moldova; Solomon
2022 0.21
Islands
2023 Uzbekistan 17.08
2024 Lao 1.94
2025 Congo, Rep; Vietnam 4.07
2026 None 0
2027 None 0
Source: World Bank
In Table 3, we show MCC’s graduated countries along with their poverty rate at $1.90 per day,
GINI index score, fragility index score and GNI per capita. This table shows that even with high
GNI per capita, a country can still suffer from high levels of poverty, high inequality, and high
fragility. The grandfather clause will also allow MCC to assist with the transition of these
already graduated countries.
7Table 3. Graduated Countries
Poverty Rate at Fragility
Country GINI Index GNIPP
$1.90 per day Index
Albania 1.06 28.96 19.4 4460
Algeria N/A N/A 25.3 5480
Angola 30.13 42.72 29.6 4850
Azerbaijan N/A N/A 24.4 7590
Belarus 0 26.01 19.9 7340
Belize N/A N/A 22.0 4350
Bosnia N/A N/A 24.1 4780
Brazil 4.87 52.87 19.7 11530
Bulgaria 2.03 36.01 17.3 7420
China 11.18 42.06 27.0 7380
Colombia 6.12 53.49 28.9 7970
Cuba N/A N/A 21.7 N/A
Dominican Republic 2.32 47.07 26.1 6030
Ecuador 4.43 47.29 25.6 6070
Fiji 3.6 42.78 24.5 4540
Iran, Islamic Rep. 0.08 37.35 26.8 6840
Iraq N/A 29.54 34.4 6320
Jamaica N/A N/A 20.3 5220
Jordan 0.13 33.66 26.3 5160
Kazakhstan 0.04 26.35 19.3 11670
Macedonia, FYR 1.33 44.05 21.9 5150
Maldives 5.59 36.78 21.5 7170
Marshall Islands N/A N/A N/A 4630
Mongolia 0.38 33.75 15.1 4280
Montenegro 1.69 33.19 18.7 7240
Namibia 22.6 60.97 25.3 5680
Paraguay 2.19 48.3 19.6 4380
Peru 3.7 44.73 24.5 6370
Romania 0 27.33 18.0 18410
Serbia 0.1 29.65 23.7 5820
Suriname N/A N/A N/A 9470
Thailand 0.06 39.26 25.9 5370
Tonga N/A N/A N/A 4260
Tunisia 1.99 35.81 22.2 4210
Turkmenistan N/A N/A 22.2 8020
Tuvalu N/A N/A N/A 5260
N/A=not available
Source: World Bank
Section III. Criteria for Analysis
Based on MCC’s requirements and goals for poverty measurement, we determined our criteria
for evaluating policy alternatives.
8A. Comprehensiveness
A central concern of MCC is that the current measure of poverty limits the number of countries it
can fund and by extension the growing numbers of poor people living in MICs. The criteria of
comprehensiveness reflects the idea that a measure of poverty should reflect a greater proportion
of the world’s poor. Comprehensiveness includes two impact categories: number of global poor
and number of candidate countries.
Number of Global Poor
In this impact category, we summed up the number of additional people that are added under
each policy alternative.
Number of Candidate Countries
We identify the number of additional countries made eligible with the adoption of each
alternative.
B. Conceptual Fidelity
Conceptual fidelity reflects a goal of relying on data that is directly to poverty rather than data
that might capture other issues that could have an effect on poverty. The fidelity criterion is
necessary to ensure internal validity (Hohmann & Shear, 2002).
C. Comparability
For any cross-national measure of poverty, it is helpful if that measure is truly comparable. For
this criterion, we examine each policy alternative to see if the data used by the alternative
comparable. Does it use consumption as a poverty indicator or is it an income-based
measurement? Does the data have uniformity across countries?
D. Data Quality
The third criterion, data quality, reflects a basic need for policymakers to feel confident in the
data used for decision-making. Based on the aforementioned IMF data quality framework, we
include three dimensions of data quality that are most relevant to this project.
Independently verified
The data source should be reliable, such as from the World Bank or the International Monetary
Fund. If data is produced by the country itself, this might raise moral hazard concerns if the
country stands to gain from manipulating the measure. Independent verification is also assumed
to improve the accuracy of the data and reduce unobserved measurement errors that might arise
when using multiple sources.
Frequently updated
Given the significant changes in the distribution of poverty in the last two decades, a good
measure should be updated on a regular basis to provide a timely reflection of poverty in a
particular country. It is problematic if measures for some countries are outdated. The most
desirable frequency would be annually or intervals of less than five years.
9Number of countries surveyed
To ensure the data used is good quality, we evaluate how many countries are surveyed in the
original data source. The more countries included represents better comprehensiveness of the
data and ensures that the data accounts for as many poor populations as possible.
E. Feasibility
While all the alternatives requires statutory changes, changes that are consistent with the
previous approach would be more feasible, and changes that shift far away from the previous
measure of poverty would be less feasible.
Section IV. Policy Alternatives
While the grandfather clause option broadly increased the ability to consider graduating
countries, the following policy alternatives offer different ways of measuring poverty.
A. Fragile States Index Combined with the Status Quo
This policy alternative suggests that countries classified as UMICs that score high on a fragile
states index would qualify for MCC funding.
Fragile state refers to a country that is characterized by weak state capacity and legitimacy, and
is vulnerable to internal and external shocks. The dynamics of fragility are multifold, including
post-conflict situations and deteriorating governance environments. Within a state that is deemed
to be fragile, basic services such as education, access to water, and health are affected by long-
term conflict, and certain religious or ethnic groups are excluded in society. These pose serious
problems to the country’s development.
In terms of the measure of fragility, the Fund for Peace, a U.S.-based think tank, created a fragile
states index to assess fragility in each state. The fragile states index consists of three broad
categories: social, economic, and political. Each category also consists of several indicators.
Given that MCC has its own scorecards to measure political and economic situations in each
state, we suggest that MCC would focus on only the social indicators, which include:
• demographic pressures: natural disasters, water scarcity, pollution
• refugees: displacement, refugees per capita
• group grievance: communal violence, religious violence
• human flight and brain drain: migration per capita, emigration of educated people
Under these four indicators, each country is measured on a scale from zero to 10, with 10 being
the highest intensity of fragility and zero the lowest intensity. It is measured on a continuous
scale. The methodology behind the construction of the index includes content analysis,
qualitative input, as well as quantitative data from reputable institutions such as Transparency
International and the World Health Organization (WHO).
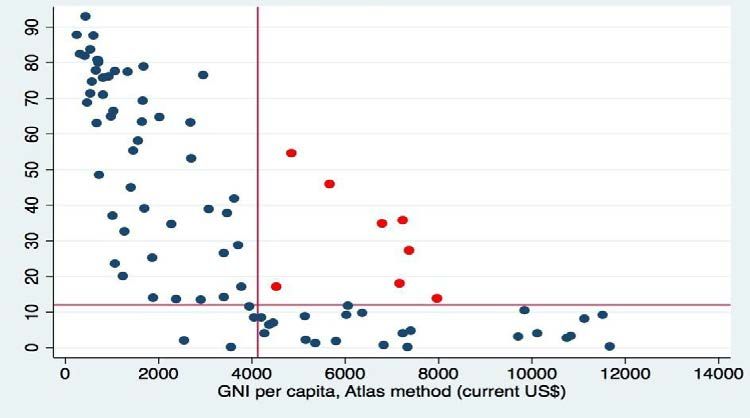
10The fragility index provides a score and ranking for each country. Based on the ranking and
score, MCC can consider if it will provide assistance to alleviate pressures in that country. Figure
2 illustrates the relationship between GNI per capita and fragile states’ index score. From the
scatter plot, it is obvious there is a negative relationship between the two. The poorer a country
becomes, the higher the score is, which indicates the country is more fragile. In this respect,
existing GNI indicators already capture many of the countries labeled as fragile. However, they
would exclude a significant number of countries that have somewhat higher income but still face
forms of fragility. Using the mean fragility index score of 23 for the aforementioned four
indicators, all of the countries in red would be excluded from funding under current MCC rules,
but would be above the average for fragility.
Figure 2. Cutoff Line of Fragile States Index
Comprehensiveness
The policy alternative ranks high in comprehensiveness. This policy option includes more
countries for MCC to consider. Under this option, 19 more UMICs would be eligible for MCC
assistance. Also, 164 million more people living in poverty would be served by MCC (Table 4).
Conceptual Fidelity
The policy alternative ranks low in terms of conceptual fidelity because it captures the effects of
poverty (such as food scarcity and malnutrition) rather than poverty per se. Therefore, it is an
indirect measure of poverty.
Comparability
Based on the fragile states index, MCC can compare countries on the same scale. The Fund for
Peace uses the same methods to generate data for each country, so it is strongly comparable
across states.
Data Quality
We classify the reliability of the data as medium. The fragile states index was created by the
Fund for Peace and published by Foreign Policy. The Fund for Peace is an independent,
nonpartisan, nonprofit research and educational institution with the aims of preventing conflict
11and promoting sustainable security. However, there is no consensus on the measure of fragility,
and the accuracy of the data is unknown. The data set is updated each year, but not every
indicator is updated annually. For example, the Fund for Peace collects data on corruption from
the Transparency International, which is one of the most prominent data sources of corruption.
However, the corruption data might be missing for one country in a particular year, so
Transparency International will continue using data from previous year. In this regard, the data
update frequency would be lower. To generate the index, the Fund for Peace surveys 178
countries – a large number of observations.
Feasibility
This policy option requires statutory change to use the fragile states index for determining
eligible graduating countries. Therefore, the feasibility of this policy alternative is low because it
also requires Congress to adopt of basket of different conceptualizations of poverty, some of
which may be politically contentious.
Table 4. Additional Countries under the Fragility Alternative
Population in
Fragile States GNI per capita
Country Poverty
Index Score (current US $)
(thousand)
Algeria* N/A 25.3 5,490
Azerbaijan* 220 24.4 7,590
Bosnia* 2 24.1 4,760
Botswana 370 23.9 7,240
China* 149,560 27 7,380
Columbia* 2,900 28.9 7,970
Dominican Republic* 239 26.1 6,030
Ecuador* 694 25.6 6,090
Equatorial Guinea N/A 24.5 10,210
Iraq* N/A 34.5 6,500
Jordan* 8 26.3 5,160
Lebanon N/A 29.2 10,030
Libya N/A 24.4 7,820
Namibia* 490 25.3 5,680
Peru* 1,131 24.5 6,360
Serbia* 7 23.7 5,820
South Africa 8,540 24 6,800
Thailand* 40 25.9 5,780
Turkey 193 25.2 10,830
Total 164,394
Data source: World Bank * Graduated country. N/A indicates missing data.
12B. Poverty Headcount Ratio at International Poverty Lines Combined with
the Status Quo
A poverty line can be defined as the money an individual needs to achieve the minimum level of
“welfare” to not be deemed “poor” (Ravallion, 2010). There are two types of poverty lines, an
absolute line and relative poverty line. The former aims to measure the cost of certain “basic
needs,” which is regarded as physiological minima for human survival. Both the $1.90 per day
and $3.10 per day IPLs belong to this category. The latter is set at a constant proportion of
current mean income or consumption (Ravallion, 2010). For example, in the United States in
2015, the poverty threshold for a single person younger than 65 years old is at an annual income
of $11,770, which is a relative poverty line.
IPLs are calculated based on NPLs, which usually reflect the line below which a person’s
minimum nutritional, clothing, and shelter needs cannot be met in that country (World Bank,
2015b). In the 990s, a group of independent researchers and the World Bank proposed measuring
global poverty by the standards of the poorest countries, based on a survey of NPLs. Since then,
NPLs have been adjusted by purchasing power parity and inflation in each country. The most
recent data of NPLs covers 88 countries (Ravallion, Chen, & Sangraula, 2009) and is reported in
the appendix.
The World Bank updated IPL from $1.25 per day to $1.90 per day in 2015 because of inflation
and the new release of 2011 purchasing power parity. Consistent with the previous IPL, the
$1.90 per day IPL is the average of the poorest 15 countries’ NPLs, and it is regarded to be the
threshold for extreme poverty. Therefore, a higher IPL (such as $3.10 per day) may be more
appropriate in terms of policy implications for MICs, and we focus on $3.10 per day IPL for the
following discussions.
We suggest that countries classified as UMICs with 12 percent or more of their population living
on less than $3.10 per day be eligible for MCC assistance. There is no magical line that
delineates the sample into poor and not-poor groups; we arrive at the 12 percent cutoff line
because the mean of the sample (UMICs) is 11.8 percent and we rounded to 12 percent. 2 This
alternative would add eight UMICs to the MCC candidate pool, five of which are graduated
countries. The new added countries are shown in Table 5.
2 We conduct robustness checks using medium and mode of the UMICs, and find the results are consistent. Using the mean of the
LICs and LMICs as the threshold will add Angola alone in MCC’s candidate pool.
13Table 5. Additional Countries under $3.10 per Day IPL Alternative
Population in Headcount Ratio Headcount Ratio GNI Per
Country Poverty at $1.90/day at $3.10/day Capita (current
(thousand) (percent) (percent) US $)
Angola* 5,980 30.13 54.52 4,850
Botswana 370 18.24 35.74 7,240
China* 149,560 11.18 27.24 7,380
Colombia 2,900 6.12 13.79 7,970
Fiji* 30 3.6 17.04 4,540
Maldives* 20 5.59 17.9 7,170
Namibia* 490 22.6 45.72 5,680
South Africa 8,540 16.56 34.68 6,800
Data source: World Bank * Graduated country.
The data is from the World Bank equity and poverty database. However, we face missing data
problems for this alternative. The way we make up for it is to substitute missing observations in
the fiscal year 2016 with the closest observations. Striking a balance between the number of
observations and the distance from the substitutions, we date our data back to as early as fiscal
year 2011. As a result, our data covers 84 countries, 31 of which are UMICs. Figure 3 and Figure
4 show the negative correlation between income per capita and poverty rate at IPLs.
Figure 3. Scatter Plot of Poverty Headcount Ratio at $1.90 per Day IPL
14Figure 4. Scatter Plot of Poverty Headcount Ratio at $3.10 per Day IPL
Comprehensiveness
This alternative ranks medium to high in terms of comprehensiveness. It would expand the MCC
candidate pool by eight countries, five of which are graduate countries. Because China is
included in this alternative, the number of the poor people covered by MCC increases
significantly. China alone accounts for 149.5 million people living in poverty, and this
alternative will bring in 167.89 million poor people.
Conceptual Fidelity
The policy alternative ranks high in terms of conceptual fidelity because it captures the status of
poverty per se. Therefore, it is a direct measure of poverty.
Comparability
This alternative ranks high to medium in terms of comparability. IPLs are generated based on
NPLs. Independent researchers and the World Bank have adjusted NPLs by purchasing power
parity and exchange rates to make poverty lines comparable across countries. However, IPLs
have advantages over NPLs in terms of comparability because IPLs use the same baseline of
comparison across countries. The only concern is that the basket of goods used to determine the
minimum consumption needed to stay out of poverty may not represent poor people across
countries.
Data Quality
This alternative has a medium score for data quality. The data is from the World Bank equity and
poverty database and is highly reliable. It is also accessible to the public; anyone can download
data from the World Bank. However, the data is not updated frequently. For UMICs, the data is
collected every three to five years. The data covers 84 countries, 31 of which are UMICs.
15Feasibility
This policy option requires statutory changes. However, it is consistent with the current approach
that based on income and consumption, which makes it more feasible than the fragility index.
C. Poverty Headcount Ratio at National Poverty Lines Combined with the
Status Quo
With this alternative, UMICs with 21 percent or more of their population living under their
national poverty lines will be included in the MCC candidate pool. The cutoff line is set at 21
percent because the mean of the sample (UMICs) is 20.8 percent and we round it to 21 percent. 3
This alternative will expand the MCC candidate pool by 16 countries, nine of which are
graduated countries. Table 5 reports the newly added countries under this alternative.
Table 6. Additional Countries under NPLs Alternative
Population in Headcount
GNI Per Capita
Country Poverty Ratio at NPL
(current US $)
(thousand) (percent)
Angola* 5,980 36.6 4,850
Bulgaria 148 21.8 7,420
Colombia 2,900 28.5 7,970
Costa Rica 79 22.4 10,120
Dominican
239 35.9 6,030
Republic*
Ecuador* 694 22.5 6,070
Fiji* 30 35.2 4,540
Macedonia* 27 24.2 5,150
Mexico 3,272 53.2 9,860
Mongolia* 11 21.6 4,280
Namibia* 490 28.7 5,680
Panama 109 25.8 11,130
Paraguay* 142 22.6 4,380
Peru* 1,131 22.7 6,370
Serbia 7 24.6 5,820
South Africa 8,540 53.8 6,800
Data source: World Bank * Graduated country.
The data is also from the World Bank equity and poverty database. It suffers from the same
missing-data problem as in poverty rate at IPLs. Again, we tackle this problem by substituting
3We conduct robustness checks using the median and mode of the UMICs, and find the results are consistent. Using the mean of
LICs and LMICs as the threshold will add Mexico alone in MCC’s candidate pool.
16missing values in FY 2016 with the closest observations within a country back to as early as FY
2011. This adjustment provides data for 88 countries, 31 of which are UMICs.
Figure 5 shows the negative relationship between poverty rate at NPLs and income per capita.
Compared to the poverty rate at $3.10 per day IPLs, poverty rate at NPLs are usually lower for
countries with lower income per capita and are usually higher for countries with higher income
per capita. That is because living standards are higher in rich countries than in poor countries.
For example, as an LMIC, India has a poverty rate of around 45 percent at $3.10 per day IPLs,
which decreases to about 20 percent at NPL. For the Dominican Republic (a UMIC), the poverty
rate at IPLs is 14 percent but rises to 36 percent at its NPL.
Figure 5. Scatter Plot of Poverty Headcount Ratio at NPLs
Comprehensiveness
This alternative ranks high in terms of comprehensiveness. It would increase the MCC candidate
pool by 16 countries, including nine graduated countries. However, because China has no data
on poverty rate at NPL, this alternative fails to make China qualified for MCC assistance, and the
number of poor people covered by MCC will not increase as many as the alternative measure of
poverty rate at IPLs. This option will add 23.8 million poor people globally to the MCC
candidate pool.
Conceptual Fidelity
Like the poverty headcount ratio at IPLs, the policy alternative ranks high in terms of conceptual
fidelity. It is a direct measure of poverty.
Comparability
This alternative has a low score in terms of comparability. Similar to IPLs, the basket of goods
used to determine the minimum consumption needed to stay out of poverty differs among
countries. Moreover, NPLs are less comparable than IPLs because the baseline for comparison
varies across countries. Therefore, NPLs do not treat people at the same level of real
17consumption in the same way. NPLs may complement the analysis of poverty for UMICs, but
NPLs alone do not perform satisfactorily in terms of policy implications.
Data Quality
This alternative has a medium score for data quality. Data of NPLs and IPLs are the same in
terms of reliability and accessibility to the public because it is the World Bank that constructs the
data. The data is collected every three to five years for UMICs and not frequently updated. The
data covers 88 countries, 31 of which are UMICs.
Feasibility
This policy option requires statutory changes. However, it is consistent with the current approach
that based on income and consumption, which makes it more feasible than the fragility index.
D. Inequality Measure Combined with the Status Quo
This alternative is also a hybrid option that keeps the status quo, GNI per capita, and adds a
second poverty measure – income distribution. Why does income distribution matter? Ravallion
(1997) indicates that although income distribution has no direct relationship to the rate of
growth, higher inequality significantly matters in terms of how much the poor share income in
the economic growth. With higher income inequality, the poor remain the same by having a
lower share of increased income from the economic growth; thus, the rate of poverty reduction
(e.g. measured by the headcount ratio of the poor) must be lower (Ravallion, 1997). To the extent
to which higher inequality tends to be less responsive to the growth rate, uneven distribution of
economic growth in a country suggests that the lower quintile of income distribution may still
remain poor or even experience extreme poverty although the top quintile enjoys the increments
of the growth.
The GINI coefficient is the most commonly used measure of inequality, showing the percentage
of expenditure (or income) attributable to each quintile of the population and ranges from zero
(perfect equality) to one (perfect inequality). The World Bank multiplies 100 to the coefficient to
present it in the GINI index (i.e., the GINI coefficient 0.3 represents 30 in the World Bank GINI
index). The GINI index typically is ranged between 30 and 50 for per capita expenditures
(Haughton & Khandker, 2009).
The combined measure of the GNI per capita threshold and GINI index would give a more
comprehensive understanding of poverty through both absolute and relative measures. This
indicator would help capture persistently high poverty in countries where the GNI indicators
have increased but have been concentrated at higher levels of the income distribution. MCC
could use this alternative to consider UMICs with a high level of inequality as eligible. However,
high-income countries (HICs) are excluded in applying this alternative because it is not aligned
with the interest of MCC to have as many UMICs as possible.
We analyzed the World Bank’s most recent GINI index data and took the same strategy for the
missing data management, as we did in the earlier section. Using observations from FY 2011
(the least recent) and FY 2016 (the most recent), 128 countries were examined for their income
inequality. Considering that the mean GINI index of these countries is 38.51, we set a
conservative threshold at 50 because countries with a GINI index higher than 50 suffer from
18severe income inequality. We also set a generous threshold at 40 to include more UMICs. Thus,
in this analysis, we consider two instances, one under the index of 50 and the other under 40. In
practice, if MCC finds it plausible to aid UMICs with the GINI index higher than either 50 or 40,
it could start identifying subnational regions in the countries where the most extreme poverty
exists and build a partnership with subnational governments in the regions.
Comprehensiveness
There are countries categorized UMICs that nationally suffer from uneven economic
development or unequal income distribution (see Figure 6). These include UMICs with higher
inequality (in red dots) and also countries that once were recipients but have graduated from
MCC funding, such as Ecuador and Peru. Although the range of GNI per capita of these
countries is beyond the eligibility threshold of $4,125, the high GINI index indicates that there
are still a number of people in extreme poverty. Pervasive economic inequality in these countries
provides MCC with opportunities to look into and consider more UMICs with the GINI index
above 50 or 40 as eligible for the aid.
Figure 6. Scatter Plot of GINI Index
For the purpose of evaluating comprehensiveness, we report the possible number of countries
included where the threshold is set at either 50 or 40 to consider potential candidate countries.
Under the threshold of 50, which is a conservative cutoff line, six countries would be newly
included in the candidate pool, including South Africa, Colombia, and Brazil. If the threshold of
40 is taken, 18 more countries (see Tables 7 and 8 below) qualify for the candidate pool than
under the threshold of 50. Depending on the threshold, six to 18 more UMICs can be newly
covered by this alternative.
19Table 7. Additional Countries under 50 GINI Index Thresholds
Population in GNI Per Capita
Country GINI Index
Poverty (thousand) (current US $)
Botswana 366 60.46 7,240
Brazil* 9,947 52.87 11,530
Colombia 2,897 53.49 7,970
Namibia* 486 60.97 5,680
Panama 109 51.67 11,130
South Africa 8,537 63.38 6,800
Data source: World Bank * Graduated country.
Table 8. Additional Countries under 40 GINI Index Thresholds
Population in GINI GNI Per Capita
Country
Poverty (thousand) Index (current US $)
Angola* 5,978 42.72 4,850
Botswana 366 60.46 7,240
Brazil* 9,947 52.87 11,530
China* 149,555 42.06 7,380
Colombia 2,897 53.49 7,970
Costa Rica 79 49.18 10,120
Dominican* 239 47.07 6,030
Ecuador* 694 47.29 6,070
Fiji* 30 42.78 4,540
Macedonia* 27 44.05 5,150
Malaysia 77 46.26 10,760
Mexico 3,272 48.07 9,860
Namibia* 486 60.97 5,680
Panama 109 51.67 11,130
Paraguay* 142 48.3 4,380
Peru* 1,131 44.73 6,370
South Africa 8,537 63.38 6,800
Turkey 193 40.17 10,840
Data source: World Bank * Graduated country.
20You can also read