Recent Geomorphological Evolution and 3D Numerical Modelling of Soft Clastic Rock Cliffs in the Mid-Western Adriatic Sea (Abruzzo, Italy) - MDPI
←
→
Page content transcription
If your browser does not render page correctly, please read the page content below
geosciences
Article
Recent Geomorphological Evolution and 3D
Numerical Modelling of Soft Clastic Rock Cliffs in
the Mid-Western Adriatic Sea (Abruzzo, Italy)
Monia Calista 1, * , Francesco Mascioli 2 , Valeria Menna 1 , Enrico Miccadei 1,3           and
Tommaso Piacentini 1,3
 1    Department of Engineering and Geology, Università degli Studi “G. d’Annunzio” Chieti-Pescara, Via dei
      Vestini 31, 66100 Chieti Scalo, Italy
 2    NLWKN-Coastal Research Station/Forschungsstelle Küste, An der Mühle 5, 26548 Norderney, Germany
 3    Istituto Nazionale di Geofisica e Vulcanologia, Sezione Roma 1, Via di Vigna Murata 605, 00143 Rome, Italy
 *    Correspondence: monia.calista@unich.it

 Received: 23 May 2019; Accepted: 10 July 2019; Published: 12 July 2019

 Abstract: Geomorphological evolution, erosion and retreat processes that affect the rocky coasts
 of the mid-western Adriatic Sea (Abruzzo, Central Italy) are the subject of this research. This
 coastal sector, one of the few examples of clastic soft rock coasts in the Mediterranean Sea,
 is characterized by active, inactive and paleo cliffs, as well as coastal slopes, composed of the
 clayey-sandy-arenaceous-conglomeratic marine sequence (Early-Middle Pleistocene) covered by
 continental deposits (Late Pleistocene-Holocene). This study provides geomorphological and 3D
 modelling stability analyses of the cliffs of Torre Mucchia, Punta Lunga, Punta Ferruccio (Ortona,
 CH) and Punta Aderci (Vasto, CH), which are popular tourist sites included in natural reserve areas.
 They are representative of two main types of active cliffs on soft clastic rocks: cliffs on sandstone
 and cliffs on conglomerate with notches. In order to evaluate the processes and factors that induce
 cliffs to retreat and their recent evolution, the research was based on a DEM analysis (LIDAR 2 ×
 2 m data), aerial photos and an orthoimages interpretation, detailed geological–geomorphological
 surveys, and a structural analysis; field and remote investigations were combined with numerical
 modelling with a FLAC3D calculation code. Geological and geomorphological field data provided
 reliable 3D models, and FLAC3D numerical analyses allowed the definition of the most critical and/or
 failure areas, and the evaluation of the controlling factors, evolution mechanisms of the slopes and
 the sliding kinematics of gravitational instability phenomena. Different retreat mechanisms have
 been observed all along the investigated coastal sectors, induced by gravitational processes due
 to coastal erosion cycles at the foot of the cliffs, and controlled by lithological features and joints
 systems. The geomorphological analysis combined with the 3D modelling (i) showed that the retreat
 process of the cliffs is connected to translational slides and rockfalls (cliffs on sandstone), combined
 rockfalls, and topples (cliffs on conglomerate), largely controlled by main joints; (ii) defined the most
 critical areas along the cliffs. These results are of great interest in the assessment of hazard connected
 to potential sliding on the cliffs. Their implementation within Geographical Information Systems
 provides a valuable contribution to the integrated management of coastal areas, strongly improving
 the identification and prediction of landscape changes and supporting a new geomorphological
 hazards assessment, in areas of high tourism, as well as natural and cultural landscape value.

 Keywords: rock coast; soft clastic rocks; active cliffs; landslides; numerical modelling; Adriatic Sea;
 Central Italy

Geosciences 2019, 9, 309; doi:10.3390/geosciences9070309                       www.mdpi.com/journal/geosciences
Geosciences 2019, 9, 309                                                                                2 of 26

1. Introduction
     Rock coasts on soft materials are the result of a complex combination of many endogenous and
exogenous factors, such as the morphostructural and stratigraphical setting, lithology, climate, wave
energy, tides, and long-term sea-level changes [1–7]. They are of great interest due to (1) retreat
rates of 10−2 to 10 m/yr, up to two orders of magnitude greater than hard rock cliffs [7–15]; (2) the
localized and episodic nature of cliff recession over a short time span and almost parallel recession
trend over a long time span [2,16,17]; (3) scattered and fast erosion cycles, consisting of toe erosion, cliff
instability, mass movements, talus deposits, beach formation and erosion, and the resumption of toe
erosion [2,7,12,17,18]. Due to the lithological variability and related strength parameters characterizing
these types of cliffs, the mechanisms and processes inducing the fast retreat are largely variable and
depend on several factors [2,7].
     As well as the other coasts on clastic soft rocks (meaning those with a uniaxial compression
strength of ≤ 5 MPa [2]) in the Mediterranean Sea, the mid-Western Adriatic coast is characterized by
high rate changes, mostly connected to landslides induced by wave-cut erosion, meteorological events
and controlled by lithological and joint features [7]. Coastal types are active, inactive and paleo cliffs,
as well as coastal slopes. Additionally, these coastal areas are popular tourist destinations, included in
natural reserve areas with beaches, cliffs and seaside resorts.
     The present study analyzed the geomorphological evolution, erosion and retreat processes of
four active cliffs of Torre Mucchia, Punta Lunga, Punta Ferruccio (Ortona, CH) and Punta Aderci
(Vasto, CH). They are examples of two main types of cliffs on soft clastic rocks developed on
an uplifted clay-sand-sandstone-conglomerate Lower Pleistocene sequence and affected by active
geomorphological processes: cliffs on sandstone and cliffs on conglomerate with notches [7]. It is
based on a combination of remote investigations (LIDAR-derived DEM processing; aerial photos
and orthoimages interpretation), field investigations (detailed geological–geomorphological surveys,
and a structural analysis), and FLAC3D numerical modelling. Through this combined approach, the
lithological, geomorphological and structural-jointing features were investigated, focusing on their
role on the stability, processes and dynamics affecting the soft clastic rock cliffs.
     The geological-geomorphologic analysis, combined with the LIDAR data (point cloud
derived), provided a reliable three-dimensional model (including morphological, lithological and
morphostructural features) elaborated by GIS, which constitutes the basis of numerical modelling. The
3D models included the main joints and coastal notches, whose geometry and distribution resulted
from the geomorphologic–structural surveys. This allowed for a better modelling response and better
adherence to observed and potential phenomena. Numerical modelling using FLAC3D [19] allowed
to define the role of the morpho-stratigraphic setting, main joints and notches in cliffs’ evolutionary
processes [20–22], highlighting the landslide mechanisms and the most critical and failure areas
affecting the cliffs. Analyzing each case study, it was possible to outline the expected landslides and
the mechanism, in terms of the recent evolution and controlling factors on the soft clastic rock cliffs of
the Abruzzo coast.
     Finally, this work wants to provide a contribution to the identification, comprehension and
prediction of the variable mechanisms of the fast retreat processes and the factors controlling these
processes on specific soft rock cliff types (i.e., on sandstone and conglomerate). This can support the
assessment of geomorphological hazards in these areas of high tourism, natural, and cultural landscape
value, where coastal landslides are largely widespread and studied because of the risk connected to
possible reactivations, damage to people and/or infrastructures.

2. Study Area

2.1. Regional Setting
     The studied areas are located along the mid-western Adriatic Sea between the piedmont reliefs of
the Apennines chain (NE-verging) and the Adriatic continental shelf (Figure 1a). The piedmont-coastal
The Adriatic area includes main islands recording, together with the coastal sector, the recent
   evolution of the landscape [7,27,28].
         The landscape features a plateau and mesa relief, shaped by fluvial, slope and coastal processes.
   These sectors were affected by uplift since the Middle Pleistocene, up to 200 m above the present sea
   level, at a rate of ca. 0.2–0.4 mm/yr [29–35], and Middle Pleistocene-Holocene sea-level fluctuations
Geosciences
   (up to +72019, 9, 309MIS 5e, and down to −120 m b.s.l., MIS 2), which led to a strong NE-shifting of the
               a.s.l.,                                                                                   3 of 26
   coastline during the sea-level low-stands [36,37].
         The coastal climate is mostly Mediterranean with maritime influences (in agreement with the
domain includes the external fronts of the central Apennine fold-and-thrust-belt buried under clastic
   classification of the Italy Ecoregions [38]). The average annual precipitation amounts are 600–800
marine-transitional-continental sedimentary sequences (Late Miocene-Pleistocene) [23–26]. The
   mm/yr, with occasional heavy rainfall (> 100 mm/d and 30–40 mm/h) [39,40]. The coastal climate is
Adriatic area includes main islands recording, together with the coastal sector, the recent evolution of
   characterized by a microtidal regime, with NW–NE significant waves, from 0.5 to 3.5–6 m in height
the[41,42].
     landscape [7,27,28].

         Figure
      Figure       1. The
               1. (a) (a) main
                           The physiographic
                                  main physiographicdomainsdomains     of the region
                                                              of the Abruzzo     Abruzzo      region to
                                                                                         (according   (according     to the
                                                                                                         the morphotectonic
         morphotectonic     landscape    classification, D’Alessandro   et al. 2003  [29]). The  black  polygon
      landscape classification, D’Alessandro et al. 2003 [29]). The black polygon indicates the study area.        indicates
      (b)the
          Thestudy   area. (b)scheme
               lithological     The lithological   scheme
                                        of the study       of the
                                                      area and    study area
                                                                location of theand  location
                                                                                 cliff         of the cliff
                                                                                       sites (modified      sitesMiccadei
                                                                                                         from     (modified
                                                                                                                          et al.
         from  Miccadei
      2019 [7]).          et al. 2019  [7]).

   2.2.The
        Geological  and Geomorphological
            landscape     features a plateau   Features
                                                  and mesa relief, shaped by fluvial, slope and coastal processes.
These sectors     were    affected  by   uplift  since
         The studied sites are on the eastern seaward  the MiddlesidePleistocene,   up to 200
                                                                      of mesas-plateaux        m above the present
                                                                                            morphostructures      [23,29]sea
level,  at a rate
   shaped    on aofPleistocene
                       ca. 0.2–0.4marine
                                     mm/yr sequence,
                                               [29–35], and    Middle
                                                           which       Pleistocene-Holocene
                                                                   includes                         sea-level fluctuations
                                                                              different poorly consolidated        clastic
(up  to +7 a.s.l.,
   sediment     andMIS weak5e, clastic
                                and down          −120 m b.s.l.,
                                         rockstooutcropping       MIS the
                                                                along  2), which    led [24,43–47].
                                                                            coastline   to a strong Different
                                                                                                       NE-shifting     of the
                                                                                                                   retreat
   mechanisms
coastline   during arethe
                        strongly   controlled
                           sea-level            by gravity-induced
                                       low-stands     [36,37].        processes due to coastal erosion cycles at the
   foot
      Theof the cliffs,climate
            coastal     lithological   features
                                 is mostly        and the geometry
                                             Mediterranean       withand   distribution
                                                                       maritime          of joint(in
                                                                                   influences      systems  [7]. with the
                                                                                                      agreement
         This coastal
classification           sectorEcoregions
                 of the Italy    has a large[38]).
                                                morphological
                                                     The average variability, with ca. 22 km
                                                                   annual precipitation         of coastal
                                                                                           amounts          cliffs, ca.
                                                                                                       are 600–800      28
                                                                                                                      mm/yr,
   kmoccasional
with    of coastal heavy
                    slopes,rainfall
                              and ca.(> 16100
                                           kmmm/d
                                                of alluvial plainsmm/h)
                                                      and 30–40    [7,11,48]. The rock
                                                                          [39,40].       coast develops
                                                                                    The coastal            oncharacterized
                                                                                                  climate is  the Early-
by a microtidal regime, with NW–NE significant waves, from 0.5 to 3.5–6 m in height [41,42].

2.2. Geological and Geomorphological Features
    The studied sites are on the eastern seaward side of mesas-plateaux morphostructures [23,29]
shaped on a Pleistocene marine sequence, which includes different poorly consolidated clastic sediment
and weak clastic rocks outcropping along the coastline [24,43–47]. Different retreat mechanisms are
Geosciences 2019, 9, 309                                                                                 4 of 26

strongly controlled by gravity-induced processes due to coastal erosion cycles at the foot of the cliffs,
lithological features and the geometry and distribution of joint systems [7].
     This coastal sector has a large morphological variability, with ca. 22 km of coastal cliffs, ca. 28 km
of coastal slopes, and ca. 16 km of alluvial plains [7,11,48]. The rock coast develops on the Early-Middle
Pleistocene marine to transitional clastic sediments covered by Late Pleistocene-Holocene continental
deposits (Figure 1b). The Pleistocene marine succession is made of several hundreds of meters of
consolidated and stratified blue-grey clay in the lower part passing to stratified yellow sands, with
a gradual transition, in the upper part. Sands include thin clay to clayey sand layers at the base,
and moderately cemented sandstone (10–30 cm strata), with sand and conglomerate lenses upward.
Moderate to well-cemented conglomerates (> 10 m in thickness), with a sand–sandstone and clay layer
and lenses, lie on an erosive contact over the sandstone layers and close the Early-Middle Pleistocene
marine sequence, passing to a transitional environment [24,43–47,49,50]. Another erosional contact
defines the passage to the Late Pleistocene-Holocene continental sequence, which includes landslides,
slope and eluvium-colluvium deposits on the cliffs and coastal slopes and beach-dune systems along
the shoreline (Figure 2).
     The bedrock sequence features a sub-horizontal or very gently (< 5◦ ) seaward dipping strata
arrangement, induced by the Pleistocene regional uplift with a gentle NE tilting [1,7,49,50]. Two main
structural discontinuity systems affected the bedrock with NE–SW to NNE–SSW (first system) and
NW–SE to WNW–ESE (second system) orientations. They are again the result of the Pleistocene uplift
and NE-tilting of the clay-sand-sandstone-conglomerate sequence, which defined different structural
elevations of the bedrock sequence along the coast, with the top conglomerate level ranging from
the sea level to more than 100 meters a.s.l. [43–46]. The first system, pertaining to the Pliocene-Early
Pleistocene, does not affect the Quaternary continental deposits, and the second, which occurred
during the Middle-Late Pleistocene, affects the inner hillslope fluvial deposits, but it is mostly sealed
by Holocene colluvial and slope deposits along the coast [7].
     The coastal sector is characterized by active, inactive and paleo cliffs, as well as coastal slopes [7,11].
Their geomorphological features result from a close combination of the litho-structural arrangement
and of marine and gravity-induced slope processes [7,51]. This work, however, is specifically focused
on the active cliffs of Torre Mucchia, Punta Lunga, Punta Ferruccio (Ortona, CH) and Punta Aderci
(Vasto; CH), which are characterized by cliffs on sandstone and cliffs on conglomerate, generally
affected by a rapid retreat.
     From a geomorphological point of view, along the studied cliffs, the main landforms are generated
by coastal processes (notches, shore platforms, and beach systems) and gravity-induced slope processes
(rockfalls, topples, and translational slides) [7].
     Deep notches develop in poorly cemented clayey sandstone or clay sands-interbedded layers
outcropping at the bases of cliffs. Due to the different hardness levels of outcropping lithotypes,
notches may have variable dimensions, up to a considerable 7 m depth and 4 m height. Where a
sub-horizontal shore platform is present, they are smaller (depths of few decimeters) and discontinuous,
and mainly occurring on weak sandstone lenses within the conglomerates. Gravelly to sandy beaches,
locally connected to dune systems, are scattered all along the bases of the cliffs. They characterize the
submerged parts of the cliffs, representing the continuation of small pocket beaches below the sea
level [7].
     Gravity-induced processes affect the cliff bases and are mainly related to rockfalls, topples and
translational landslides. The landslide and slope deposits are composed of chaotic sands, calcareous
pebbles and heterometric blocks (up to 5 m on conglomerate and 3 m on sandstone). Waves may
quickly remove landslide deposits or cover them with beach deposits. The main joints pervasively
affect the cliffs and coastal slopes (transversal and roughly parallel to the coast, vertical or seaward
dipping); the joint aperture ranges from < 1 cm to 3 cm; the persistence is of several meters, but locally
they can affect the whole cliff, and the spacing is from a few decimetres to 3–5 m, generally with larger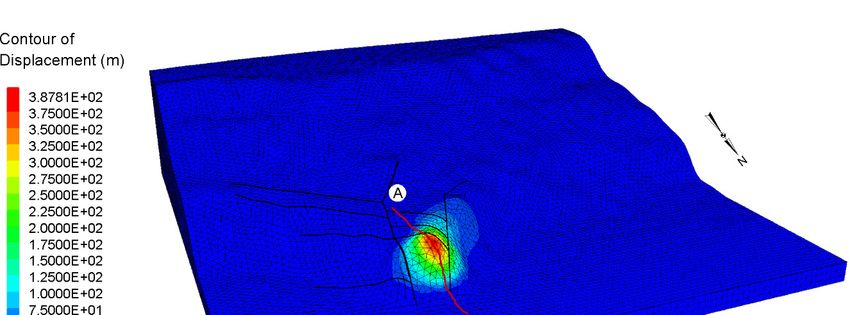
Geosciences 2019, 9, 309                                                                                      5 of 26

values in conglomerate than in sandstone bedrock. They are enlarged by tensile stresses and strongly
control  the
Geosciences   development
            2018, 8, x FOR PEERof landslides on these coastal sectors [7].
                                REVIEW                                                         5 of 26

      Figure 2. (a) Location of the studied areas; (b) schematic geomorphological map of the Ortona coastal
      Figure(c)
      sector; 2. (a) Location
                 schematic    of the studied areas;
                            geomorphological   map (b)  schematic
                                                    of the         geomorphological
                                                           Vasto coastal               map
                                                                         sector (modified    of the
                                                                                          from      Ortona
                                                                                                Miccadei etcoastal
                                                                                                           al. [7]).
      Legend: TM: Torre Mucchia cliff; PF: Punta Ferruccio cliff; PL: Punta Lunga cliff; PA: Punta Aderci et
      sector; (c) schematic  geomorphological   map   of the Vasto coastal  sector (modified  from  Miccadei     al.
                                                                                                              cliff.
      [7]). Legend: TM: Torre Mucchia cliff; PF: Punta Ferruccio cliff; PL: Punta Lunga cliff; PA: Punta
      Aderci cliff.
      Anthropogenic      landforms are present all along the investigated coastal area (villages, tourist
facilities, roads, railroads, ports, and defense works) due to suggestive seaside resorts and the peculiar
3. Material
nature   of theand  Methods
                cliffs and beaches.
     The investigation of the coastal cliffs of Torre Mucchia, Punta Ferruccio, Punta Lunga and Punta
Aderci is based on an integrated analysis incorporating topographic data and a DEM analysis (LIDAR
2 × 2 m data), aerial photos and an orthoimages interpretation, detailed geologic–geomorphologic
and structural-geomechanical surveys, and numerical modelling. The analysis of each cliff site is the
result of a general topographic analysis (Figure 3a), and of previous geomorphological and
morphodynamic characterizations (Figure 3b,c). Detailed topographic (LIDAR) data, and geological,
geomorphological and structural field surveys allowed us to define the local litho-stratigraphic and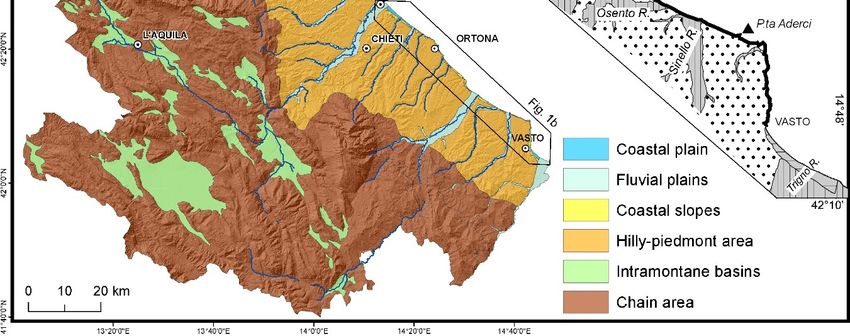
Geosciences 2019, 9, 309                                                                                    6 of 26

3. Material and Methods
      The investigation of the coastal cliffs of Torre Mucchia, Punta Ferruccio, Punta Lunga and Punta
Aderci is based on an integrated analysis incorporating topographic data and a DEM analysis (LIDAR
2 × 2 m data), aerial photos and an orthoimages interpretation, detailed geologic–geomorphologic and
structural-geomechanical surveys, and numerical modelling. The analysis of each cliff site is the result
of a general topographic analysis (Figure 3a), and of previous geomorphological and morphodynamic
characterizations (Figure 3b,c). Detailed topographic (LIDAR) data, and geological, geomorphological
and structural field surveys allowed us to define the local litho-stratigraphic and geotechnical features
of the cliffs, as well as map joints, notches and sea caves, as well as allowing us to define a 3D model of
the cliffs (Figures 3d and 4a). Finally, minor elements not affecting the cliff dynamics were removed
from the model, defining a final simplified model used for the numerical modelling (Figures 3e and 4b).
      A LIDAR-derived 2 m-cell DEM (raster coverage derived from a point cloud, acquired in 2011,
provided by the National Geoportal of the Italian Ministry of Environment [52]) allowed the realization
of the topographic models of the cliff sites. At the base of the cliffs, the models were then manually
modified in order to introduce the morphology of main notches and sea caves, resulting from field
data and measurements, as well as topographic profiles.
      Through GIS processing, aerial photos (Flight Abruzzo Region 2009) and LIDAR data supported
the field investigations of the geomorphological features of the cliffs, with a particular regard to
landslide distribution and geometry and the orientation of the main joints affecting the cliffs.
      Detailed field surveys were carried out at a scale of 1:1000 and provided the litho-stratigraphic
characterization of the clastic marine bedrock and the overlaying continental deposits, focusing
on the morpho-stratigraphic relationship between bedrock, slope and landslide deposits, and
eluvium-colluvium covers [7]. The structural-geomechanical analysis of rock masses was carried out
at seven locations along the main cliff areas in order to characterize the joints affecting the rock masses.
Combining the field data and photogeological interpretation, the main joints (orientation, length and
geometry) were defined as those affecting the geometry and morphology of the cliffs. The geotechnical
parameters of the different lithotypes, required for the numerical modelling (Table 1), were derived
from previous studies made available by a large national and regional project focused on the seismic
microzonation of the Italian territory. The uniaxial compression strength of the materials is usually
< 5 Mpa (the value considered for soft materials [2]). The parameters are average values resulting from
numerous surveys carried out in the analyzed coastal sector [53–55]. They are assumed to be constant,
and the variability due to local lithological changes and to cliff weathering is not considered at this
stage. The joint parameters were obtained from the geotechnical parameters of the lithology on which
they are set (Table 1).

      Table 1. Physical mechanical parameters of the lithotypes. Legend: γ volume weight (kg/m3 ); ϕ’
      internal friction angle (◦ ); c’ apparent cohesion (Pa); K bulk modulus (Pa); G shear modulus (Pa); and
      bt max tension strength (c’/ tan ϕ’) (Pa).

                     Lithotype       Conglomerate        Sandstone         Sand            Clay
                     γ (kg/m3)            2100              2100            2080           2050
                        ϕ’ (◦ )            45                38              34             24
                        K (Pa)         2.00 × 10⁸        4.94 × 10⁷      5.56 × 10⁶     1.60 × 10⁷
                        G (Pa)         1.20 × 10⁸        3.25 × 10⁷      1.85 × 10⁶     9.60 × 10⁶
                        c’ (Pa)        3.80 × 10⁵        2.00 × 10⁵      1.67 × 10⁴     3.68 × 10⁴
                     bt max (Pa)       3.80 × 10⁵        2.56 × 10⁵      2.48 × 10⁴     8.27 × 10⁴
                  jkn = jks (Pa/m)     1.20 × 10⁸        3.09 × 10⁷      2.67 × 10⁶
                       jc’ (Pa)        1.00 × 10⁴        1.00 × 10⁴      1.00 × 10⁴
                        Jϕ’ (◦ )           30                30              30
Geosciences 2019, 9, 309                                                                                                   7 of 26
      Geosciences 2018, 8, x FOR PEER REVIEW                                                                     7 of 26

           Figure
      Figure       3. Methodologicalworkflow
               3. Methodological       workflow for for the
                                                        the reconstruction
                                                             reconstruction ofofthe  geological–geomorphological
                                                                                   the geological–geomorphological   3D 3D
           models. (a) topographic map; (b) CNR atlas of beaches; (c) geomorphological map; (d) 3D real model;
      models. (a) topographic map; (b) CNR atlas of beaches; (c) geomorphological map; (d) 3D real model;
           (e) 3D simplified model. Legend: 1. Colluvial, eluvial deposits; 2. Beach deposits; 3. Conglomerate
      (e) 3D simplified model. Legend: 1. Colluvial, eluvial deposits; 2. Beach deposits; 3. Conglomerate
           with sandstone lenses; 4. Joint; 5. Active cliff; 6. Inactive cliff; 7. Notch; 8. Sea cave; 9. Landslide and
      with sandstone lenses; 4. Joint; 5. Active cliff; 6. Inactive cliff; 7. Notch; 8. Sea cave; 9. Landslide and
           slope deposits; 10. U-shaped valley; 11. Geomechanical station; 12. Geomechanical analysis (blue line
      slope= deposits;  10. U-shaped valley; 11. Geomechanical station; 12. Geomechanical analysis (blue line
             coastline; black line = main joints); 13. Sea; and 14. Section.
      = coastline; black line = main joints); 13. Sea; and 14. Section.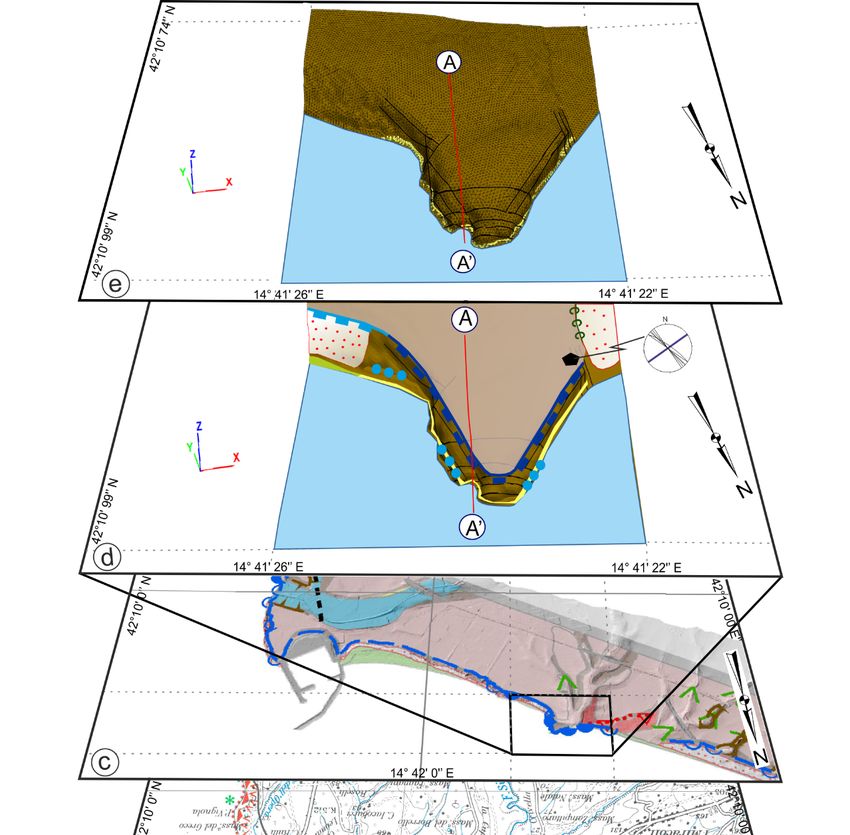
Geosciences 2019, 9, 309 8 of 26
Geosciences 2018, 8, x FOR PEER REVIEW 8 of 26
Figure
Figure 4. (a)
4. (a) Geological–geomorphological section
Geological–geomorphological section and
and (b)(b) interpolated-simplified
interpolated-simplified section
sectionfor forthe
the
numerical
numerical modelling.
modelling. Legend:1.1.Colluvial,
Legend: Colluvial,eluvial
eluvialdeposits;
deposits; 2. 2. Conglomerate;
Conglomerate; 3.3.Sandstone;
Sandstone;4.4.Joint
Joint
(discontinuous
(discontinuous lineline = probable
= probable prosecution);4.4.Active
prosecution); Activecliff;
cliff;5.5. Sea
Sea cave;
cave; 6.
6. U-shaped
U-shapedvalley;
valley;7.7.Sea;
Sea;and
and
8. FLAC3D
8. FLAC3D mesh. mesh.
TheTable 1. Physical mechanical parameters of theoflithotypes. Legend: γ volume weight (kg/m to );theφ’ recent
3
geomorphological field surveys (scale 1:1000) were carried out according
internal friction angle (°); c’ apparent cohesion (Pa); K bulk modulus (Pa); G
Geological Survey of Italy guidelines [56], identifying present and ancient landforms, as well as the shear modulus (Pa); and
Ϭtmax tension strength (c’/ tan φ') (Pa).
morphogenetic processes affecting the cliffs focusing mainly on marine and coastal processes, as well
as gravity-induced
Lithotypeprocesses [57]. Moreover, periodic field
Conglomerate observations (from
Sandstone Sand2004 to 2018), Claycombined
with aerialγphoto
(kg/m3) interpretation, allowed 2100 a multitemporal2100 analysis of the active
2080 ongoing evolution
2050 in
φ’ (°) sites.
the studied coastal 45 38 34 24
K (Pa)of topographic, geological-structural,
The overlay 2.00 × 10⁸ 4.94 × 10⁷
geotechnical and 5.56 × 10⁶
geomorphological 1.60data× 107made
it possible to G characterize
(Pa) 1.20 × 10of the analysed
the geometry 8 3.25 × 10 focusing1.85
cliffs, 7 × 10relationship
on the 6 9.60 ×between
106
the lithology c’ (conglomerate,
(Pa) sand, 3.80 × 10 5
sandstone, and clay) 2.00
and× 10 5 1.67 × 10 discontinuities
the main structural 4 3.68 × 10⁴ and
Ϭtmax (Pa)elements (e.g., 3.80
geomorphological × 10
joints,
5
notches, sea caves, 2.56 ×and
105 landslide) 2.48(Table
× 104 2). The 8.27 × 10⁴
distribution
jkn = jks (Pa/m) 1.20 × 10 8 3.09 × 10 7 2.67
and variability of the meteo-climatic factors were neglected at this stage of the study because their × 10 6
jc’ (Pa) in the geomorphological
effects are included 1.00 × 10⁴ features of1.00 the ×cliffs.
104 All these 1.00elements
× 104 were analyzed in
Jφ’ (°) 30 30 30
order to reproduce reliable geologic–geomorphologic 3D models of the cliffs, as well as to characterize
the geotechnical
All FLAC3D parameters
analysesofwere
the lithotypes
carried out and joints request
selecting for the numerical
the Mohr–Coulomb modelling.
constitutive model. TheThe final
local 3D models
numerical (Figureprovided
modelling 3d) and the related cross-sections
an estimate of the stress–strain (Figure 4a) were
response simplified
of the by removing
cliffs, identifying the
mostelements
minor critical areas
(e.g., and deformable deposit
the superficial volumes, allowing
covers 3 m apart) and the
large[19].
studies coastal notches.applied for continuum models, FLAC3D allows for the introduction, like in the
Generally
The analyses were performed in static conditions to specifically investigate the role of joints and
present study, of a limited number of interfaces in order to represent a physical discontinuity, as well
notches in the different lithological features of the cliffs (Figure 6). The critical areas, the possible
as bedding planes, fault and joints.
kinematics of the landslide and the retreat mechanism of all the cliff sites were evaluated for
All FLAC3D analyses were carried out selecting the Mohr–Coulomb constitutive model. The
simulation cases where failure conditions are reached (system not convergence), showing the failure
numerical modelling provided an estimate of the stress–strain response of the cliffs, identifying the most
pattern and the expected landslide mechanisms. When the static analysis featured no failure
critical areas and deformable volumes, allowing the estimation of landslide mechanisms, triggering
conditions (system convergence), a second analysis was carried out through the strength reduction
conditions
method and the possible
in FLAC3D, which evolution
outlinedof thelandslide phenomena
displacement patternalong
and thethepossible
cliffs [20–22].
failure mechanism.
This technique was executed automatically by the software, which progressively reduced the shear
strength parameters (cohesion and internal friction angle) of the material and the joints to bring the
Geosciences 2019, 9, 309                                                                                            9 of 26

      Table 2. The lithological, structural and geomorphological features of the four surveyed cliffs (locations
      in Figure 1) (modified from Miccadei et al. [7]). Features: Hc: cliff height; Hs: coastal slope height;
      Sty: slope type; Lf: lithotypes at the cliff foot; Le: lithotypes at the cliff upper edge; G: structural strata
      setting; Fr: joint orientation; L: landforms; SP: shore platform, following Sunamura’s classification [1];
      N: notch; and R: average retreat rate.

                                                                         Punta Ferruccio            Punta Aderci
     Feature         Torre Mucchia (TM)          Punta Lunga (PL)
                                                                               (PF)                     (PA)
                                                Morphological Features
        Hc                     > 25 m                  < 25 m                  > 25 m                  > 25m
        Hs                      60 m                    60 m                    60 m                     —
                                                                            Vertical and             Undulated
        Sty                   Vertical                 Vertical          Vertical + concave        concave–convex
                                                                               convex                  Vertical
                                                 Lithological Features
                                                                            Conglomerate
        Lf                      Sand                 Silty sands                                    Conglomerate
                                                                             Silty sands
        Le                   Sandstone               Silty sands            Conglomerate            Conglomerate
                                                   Structural features
         G                 Sub-horizontal          Sub-horizontal          Sub-horizontal           Sub-horizontal
                                                                          N20◦ E, 80◦ WNW
                           N60◦ E,   75◦
                                       NW
                                                                           N60◦ E, 80◦ NW
                            N90◦ E, 75◦ N           N60◦ E, 90◦                                      N60◦ W, 90◦
                                                                             N90◦ E, 90◦
        Fr                 N40◦ W, 80◦ NE         N70◦ W, 70◦ NNE                                   N50◦ W, 80◦ NE
                                                                           N60◦ W, 85◦ SW
                           N50◦ W, 50◦ NE           N20◦ W, 90◦                                      N20◦ W, 90◦
                                                                           N60◦ W, 85◦ NE
                           N10◦ E, 80◦ ESE
                                                                          N20◦ W, 80◦ ENE
                                               Geomorphological features
                                                       Rockfalls,              Rockfalls,
                                                                                                       Rockfalls,
                    Rockfalls, translational        translational            translational
         L                                                                                         rainwash, notch,
                     sliding, wave erosion          sliding, wave           sliding, wave
                                                                                                    shore platform
                                                        erosion             erosion, notch
        SP                        –                        –                       –                Horizontal
        N                         –                        –                On silty sand         On conglomerate
        R                     0.63 m/yr                0.76 m/yr               0.85 m/yr             0.15 m/yr

      The three-dimensional models were discretized with a mesh of tetrahedric elements of 3 m in
size (Figure 5). This enabled us to include the main lithological layers and not the minor lenses in the
models, as well as the major joints (some tens of meters in length and spaced > 3 m apart) and the
large coastal notches.
      The analyses were performed in static conditions to specifically investigate the role of joints and
notches in the different lithological features of the cliffs (Figure 6). The critical areas, the possible
kinematics of the landslide and the retreat mechanism of all the cliff sites were evaluated for simulation
cases where failure conditions are reached (system not convergence), showing the failure pattern and
the expected landslide mechanisms. When the static analysis featured no failure conditions (system
convergence), a second analysis was carried out through the strength reduction method in FLAC3D,
which outlined the displacement pattern and the possible failure mechanism. This technique was
executed automatically by the software, which progressively reduced the shear strength parameters
(cohesion and internal friction angle) of the material and the joints to bring the slope to a state of limiting
equilibrium [58–60]. The role of the lithology, morphology (notch, sea cave) and morphostructure
(joints) was investigated for each cliff site, through the analysis of the displacement contours and
vectors on the modelling results and the related sections pertaining to each cliff.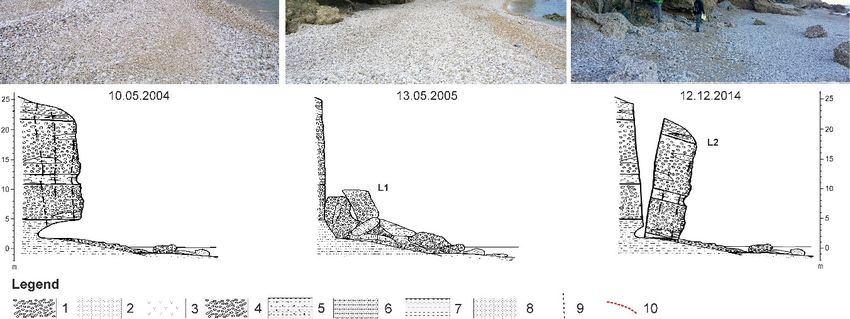
Geosciences 2019, 9, 309                                                                                              10 of 26
  Geosciences 2018, 8, x FOR PEER REVIEW                                                                         10 of 26

         Figure 5. (a) Discretization mesh used for the numerical modelling; and (b) detail of the grid next to
         a notch. The red lines indicate the main joints.

         For each modelling result, the main critical areas in terms of stability were defined. The
   displacement pattern suggested different types of failure such as translational slide, rockfall, topple
   and the possible combination of these mechanisms. Through the interpretation of these results, the
   role of the main joints and notches, and their geometry in controlling the landslides’ mechanism and
   kinematics,    is discussed  for the different
                                               fortypes  of cliffs (on sandstone  or(b)conglomerate),      outlining    the
       Figure5.5.(a)
     Figure       (a)Discretization
                      Discretization mesh
                                     mesh used
                                          used for the numerical
                                                   the  numerical   modelling;
                                                                   modelling;  and(b)
                                                                              and       detailofofthe
                                                                                       detail       thegrid
                                                                                                         grid  next
                                                                                                            next  toto a
   overall
     notch. cliff
             The   evolution.
                   red lines    This
                             indicate contributed
                                      the main      to
                                               joints.
       a notch. The red lines indicate the main joints.
                                                        understanding    the  recession   of   the   cliffs,  the  related
   landslide mechanisms and the controlling/triggering factors.
       For each modelling result, the main critical areas in terms of stability were defined. The
  displacement pattern suggested different types of failure such as translational slide, rockfall, topple
  and the possible combination of these mechanisms. Through the interpretation of these results, the
  role of the main joints and notches, and their geometry in controlling the landslides’ mechanism and
  kinematics, is discussed for the different types of cliffs (on sandstone or conglomerate), outlining the
  overall cliff evolution. This contributed to understanding the recession of the cliffs, the related
  landslide mechanisms and the controlling/triggering factors.

                                Figure6.6.Workflow
                               Figure     Workflowfor
                                                   for the
                                                        the numerical
                                                            numerical modelling
                                                                      modellingsteps.
                                                                                steps.

     For each modelling result, the main critical areas in terms of stability were defined. The
displacement pattern suggested different types of failure such as translational slide, rockfall, topple
and the possible combination of these mechanisms. Through the interpretation of these results, the
role of the main joints and notches, and their geometry in controlling the landslides’ mechanism and
kinematics, is discussed for the different types of cliffs (on sandstone or conglomerate), outlining
                               Figure 6. Workflow for the numerical modelling steps.
Geosciences 2019, 9, 309 11 of 26
the overall cliff evolution. This contributed to understanding the recession of the cliffs, the related
landslide mechanisms and the controlling/triggering factors.
4. Results
Geosciences 2018, 8, x FOR PEER REVIEW 11 of 26
The analyzed active cliffs are developed on different soft clastic bedrock units of the
4. Results
clay-sand-sandstone-conglomerate Pleistocene sequence, with lithological variations between toes and
The analyzed active cliffs are developed on different soft clastic bedrock units of the clay-sand-
tops. They are grouped into (1) cliffs on sandstone, Torre Mucchia and Punta Lunga (Figure 7a,b), and
sandstone-conglomerate Pleistocene sequence, with lithological variations between toes and tops.
(2) cliffsThey
on conglomerate, Punta Ferruccio and Punta Aderci (Figure 7c,d). The cliffs on sandstone are
are grouped into (1) cliffs on sandstone, Torre Mucchia and Punta Lunga (Figure 7a,b), and (2)
formed cliffs
when onthe bedrock clay-sand-sandstone-conglomerate
conglomerate, Punta Ferruccio and Punta Aderci (Figure sequence
7c,d). Theshows
cliffs ona sandstone
clay/sandare interface
that is just below
formed whenthethe
present seaclay-sand-sandstone-conglomerate
bedrock level, whereas the cliffs on conglomerate
sequence shows are formed
a clay/sandwhen the bedrock
interface
clay/sand thatinterface
is just below the present
is well below thesea level, whereas
present the cliffs
sea level [7]. on conglomerate
Their differentare formed when
lithologic, the
structural and
bedrock clay/sand interface is well below the present sea level [7]. Their different
geomorphological features, which result from field surveys, are summarized in Table 2 and describedlithologic, structural
and geomorphological features, which result from field surveys, are summarized in Table 2 and
in the following subsections.
described in the following subsections.
Figure 7. The landscape and topographic profile of: (a) Torre Mucchia; (b) Punta Lunga; (c) Punta
Figure 7. The landscape and topographic profile of: (a) Torre Mucchia; (b) Punta Lunga; (c) Punta
Ferruccio; and (d) Punta Aderci.
Ferruccio; and (d) Punta Aderci.Geosciences 2019, 9, 309 12 of 26
4.1. Cliffs on Sandstones:
Geosciences The Cases
2018, 8, x FOR PEER of Torre Mucchia and Punta Lunga
REVIEW 12 of 26
4.1.1.4.1. Cliffs
Torre on Sandstones: The Cases of Torre Mucchia and Punta Lunga
Mucchia
The
4.1.1.Torre
Torre Mucchia
Mucchia cliff features a double-step morphology. The lower one is the main active
cliff, 25 mThe in height, with very steep or vertical walls; above the cliff, a gentle slope is present up to
Torre Mucchia cliff features a double-step morphology. The lower one is the main active
the top scarp of the entire
cliff, 25 m in height, with slope.
very The
steepgeological
or vertical bedrock
walls; aboveof the
the Torre
cliff, aMucchia cliffisconsists
gentle slope present upof tens
to of
meters theoftop
consolidated
scarp of the sand
entireand cemented
slope. sandstone,
The geological bedrock with a weakly
of the cemented
Torre Mucchia cliffconglomerate
consists of tenslevel
of on
top; this sequence
meters lays over
of consolidated theand
sand claycemented
unit justsandstone,
above thewith sea level (Figure
a weakly 8a). The
cemented bedrock islevel
conglomerate covered
by < on3 mtop; this sequence
superficial lays consisting
deposits over the clayof unit justand
eluvial above the sea covers,
colluvial level (Figure
which 8a).
wereTheremoved
bedrock isin the
covered by < 3 m superficial deposits consisting of eluvial and colluvial
simplified model (Figure 8b), as well as for all the other 3D models, because of their limitedcovers, which were removed
thickness
in the simplified model (Figure 8b), as well as for all the other 3D models,
for modelling purposes. Lithotypes are largely affected by joints that are some tens of meters because of their limited
in length
thickness for modelling purposes. Lithotypes are largely affected by joints that are some tens of
and are spaced < 1 m to 5 m apart. Their main orientations are N90 E, 75 N; N50 W, 50 NE; ◦ ◦ ◦ ◦ and
meters in length and are spaced < 1 m to 5 m apart. Their main orientations are N90°E, 75°N; N50°W,
N10◦ E, 80◦ ESE (Figure 8a).
50°NE; and N10°E, 80°ESE (Figure 8a).
FigureFigure
8. (a)8.The
(a) The geological
geological andand geomorphological features
geomorphological featuresofofTorre
TorreMucchia;
Mucchia;(b)(b)
the the
simplified model
simplified model
for the numerical modelling (removing superficial deposits < 3 m in thickness). Legend:
for the numerical modelling (removing superficial deposits < 3 m in thickness). Legend: 1. Colluvial, 1. Colluvial,
eluvial deposits; 2. Conglomerate; 3. Cemented sandstone; 4. Consistent sand; 5. Clay; 6. Joint; 7.
eluvial deposits; 2. Conglomerate; 3. Cemented sandstone; 4. Consistent sand; 5. Clay; 6. Joint; 7.
Active cliff; 8. Inactive cliff; 9. Notch; 10. Sea cave; 11. Dormant landslide scarp; 12. Active landslide
Active cliff; 8. Inactive cliff; 9. Notch; 10. Sea cave; 11. Dormant landslide scarp; 12. Active landslide
scarp; 13. Landslide; 14. Landslide and slope deposits; 15. U-shaped valley; 16. Geomechanical station;
scarp;17.
13.Sea;
Landslide; 14. Landslide and slope deposits; 15. U-shaped valley; 16. Geomechanical station;
and 18. Geomechanical analysis stereonet diagrams (blue line = cliff; black line = main joints).
17. Sea; and 18. Geomechanical analysis stereonet diagrams (blue line = cliff; black line = main joints).Geosciences 2018, 8, x FOR PEER REVIEW 13 of 26
The numerical analysis performed on the simplified model highlighted some critical areas next
to the main joints. In particular, the most critical area, in the eastern part of the cliff (Figure 9a), is
Geosciences
located2019, 9, 309
at the intersection of the N–S and E–W joint systems. The displacement contours originate 13 of 26
from the joints, which control the mechanisms outlining a possible topple landslide or a combination
of translational slide and topple-fall (Figure 9b).
The numerical analysis performed on the simplified model highlighted some critical areas next
The central-western part of the cliff (Figure 9c) shows a minor control related to the joints. The
to the main joints. In particular, the most critical area, in the eastern part of the cliff (Figure 9a), is
3D model outlines a moderate displacement along the joints, while the section view outlines
located at the intersection of the N–S and E–W joint systems. The displacement contours originate
displacement vectors with a pseudo-circular deformation from the inner part of the cliff and not from
from the joints,
specific joints.which control the mechanisms
The displacement outlining
contours outline a possible
a possible topple landslide
roto-translational slide. or a combination
of translational slide and topple-fall (Figure 9b).
Figure
Figure 9. 9.
(a)(a) Displacementcontours
Displacement contoursand
andvectors
vectorsofofthe
theTorre
TorreMucchia
Mucchiacliff;
cliff;(b)
(b)the
theA-A’
A-A’section;
section; and
and (c)
(c) the B-B’ section.
the B-B’ section.
4.1.2.
ThePunta Lunga
central-western part of the cliff (Figure 9c) shows a minor control related to the joints. The 3D
model outlines a moderate displacement
The Punta Lunga cliff shows verticalalong the< joints,
walls 25 m inwhile theThe
height. section view outlines
geological displacement
model (Figure 10a)
vectors
of thewith a pseudo-circular
bedrock deformation
is characterized, fromMucchia,
as in Torre the inner by
parttens
of the
of cliff andof
meters notconsolidated
from specificsand
joints.
The displacement
alternating with contours
cementedoutline a possible
sandstone, with a roto-translational slide.
weakly cemented conglomerate unit in the upper part
of the slope above the cliff scarp; furthermore, it is covered by thin layers of eluvial and colluvial
4.1.2. PuntaDue
deposits. Lungato the lithological complexity of the area, the alternation of the different outcropping
lithologies has been cliff
The Punta Lunga simplified
shows (Figure
vertical10b). < 25main
wallsThe m injoints,
height.which affect the bedrock,
The geological are spaced
model (Figure 10a) of
from < 1 m to 5 m apart, and they show N60°E, 90°; N70°W, 70°NNE; and N20°W, 90° directions.
the bedrock is characterized, as in Torre Mucchia, by tens of meters of consolidated sand alternating
The numerical
with cemented modelling
sandstone, with performed on the simplified
a weakly cemented model shows
conglomerate unit inathe
single critical
upper partarea at the
of the slope
intersection of the main joint systems (Figure 11a), which affects the cliff wall (SW–NE and
above the cliff scarp; furthermore, it is covered by thin layers of eluvial and colluvial deposits. Due toNNW–
SSE orientation). However, in this area, the joints show a minor control on the landslide mechanism:
the lithological complexity of the area, the alternation of the different outcropping lithologies has been
the displacement vectors originate from the innermost portions of the cliff, describing planar sliding
simplified (Figure 10b). The main joints, which affect the bedrock, are spaced from < 1 m to 5 m apart,
surfaces (Figure 11b) connected to the translational slide, probably associated with rockfall.
and they show N60◦ E, 90◦ ; N70◦ W, 70◦ NNE; and N20◦ W, 90◦ directions.Geosciences 2019, 9, 309 14 of 26
Geosciences 2018, 8, x FOR PEER REVIEW 14 of 26
Figure
Figure 10.10.(a)(a)The
Thegeological
geologicaland and geomorphological
geomorphological modelmodel of ofthe
thePunta
PuntaLunga
Lungacliff;
cliff;and
and(b)(b)
thethe
simplified model for the numerical modelling (removing superficial deposits
simplified model for the numerical modelling (removing superficial deposits < 3m in thickness).< 3m in thickness).
Legend:
Legend: 1. 1.Colluvial,
Colluvial,eluvial
eluvialdeposits;
deposits; 2.
2. Conglomerate;
Conglomerate;3.3.Cemented
Cemented sandstone; 4. Consistent
sandstone; sand;sand;
4. Consistent 5.
Clay; 6. Joint; 7. Active cliff; 8. Inactive cliff; 9. Notch; 10. Sea cave; 11. Dormant landslide
5. Clay; 6. Joint; 7. Active cliff; 8. Inactive cliff; 9. Notch; 10. Sea cave; 11. Dormant landslide scarp; scarp; 12.
Active landslide scarp; 13. Landslide; 14. Landslide and slope deposits; 15. U-shaped valley; 16.
12. Active landslide scarp; 13. Landslide; 14. Landslide and slope deposits; 15. U-shaped valley; 16.
Geomechanical station; 17. Sea; and 18. Geomechanical analysis stereonet diagrams (blue line = cliff;
Geomechanical station; 17. Sea; and 18. Geomechanical analysis stereonet diagrams (blue line = cliff;
black line = main joints).
black line = main joints).
The numerical modelling performed on the simplified model shows a single critical area at the
intersection of the main joint systems (Figure 11a), which affects the cliff wall (SW–NE and NNW–SSE
orientation). However, in this area, the joints show a minor control on the landslide mechanism:
the displacement vectors originate from the innermost portions of the cliff, describing planar sliding
surfaces (Figure 11b) connected to the translational slide, probably associated with rockfall.Geosciences
Geosciences 2018,
2019, 8, x FOR PEER REVIEW
9, 309 15 of
15 26
of 26
Figure
Figure 11.11.
(a)(a)
TheThe displacement
displacement contours
contours and
and vectorsofof
vectors the
the Punta
Punta Lunga
Lunga cliff;
cliff; (b)(b) the
the A-A’
A-A’ section;
section; and
(c) and (c) the
the B-B’ B-B’ section.
section.
4.2.4.2.
Cliffs onon
Cliffs Conglomerates:
Conglomerates:The
TheCase
Caseof
of Punta
Punta Ferruccio and Punta
Ferruccio and PuntaAderci
Aderci
4.2.1. Punta
4.2.1. Ferruccio
Punta Ferruccio
Punta
PuntaFerruccio
Ferruccioshows
showsvertical cliffs
vertical andand
cliffs an alternation
an alternation of concave–convex
of concave–convex slopes of >of
slopes 25>m25inmheight.
in
Some notches
height. Someare present
notches areat present
the footatofthethefoot
cliff,ofinthe
poorly
cliff,cemented
in poorly clayey
cementedsandstone-interbedded
clayey sandstone-
interbedded
layers layers within conglomerates.
within conglomerates. They reach up to They
7 mreach up to
in depth and7m4 minindepth and
height. The4m in height.bedrock
geological The
geological
of Punta bedrock
Ferruccio of Punta
(Figure 12a)Ferruccio
is made of (Figure
tens of12a) is made
meters of tens of meters
of conglomerate of over
laying conglomerate
sandy-clay laying
layers.
over sandy-clay layers. The bedrock is widely affected by some tens of meters
The bedrock is widely affected by some tens of meters in length and joints spaced from 3 m to 10 m in length and joints
spaced
apart, withfrom
N203◦ E,
m 80
to◦10 m apart,
WNW; N60with
◦ E, 80N20°E, 80°WNW;
◦ NW; N90 ◦ E, 90◦ N60°E,
; N60◦ W,80°NW;
85◦ SW;N90°E, 90°;
N60◦ W, 85N60°W,
◦ NE; and85°SW;
N20◦ W,
N60°W,
◦ 85°NE; and N20°W, 80°NNE orientations. The covers, excluded in the simplified
80 NNE orientations. The covers, excluded in the simplified model used for the numerical modelling model used
for the12b),
(Figure numerical
includemodelling (Figure
eluvial and 12b), include
colluvial deposits, eluvial and colluvial
as well as activedeposits, as welllandslides.
and dormant as active andThe
dormant landslides. The model is defined on the base of the LIDAR data acquired in 2011; after that,
model is defined on the base of the LIDAR data acquired in 2011; after that, in 2014, the eastern part of
in 2014, the eastern part of the cliff above a notch was affected by a topple landslide.
the cliff above a notch was affected by a topple landslide.
The analysis carried out on the Punta Ferruccio model revealed that the cliff reaches the failure
The analysis carried out on the Punta Ferruccio model revealed that the cliff reaches the failure
conditions in two critical areas along the main joints, with an E–W trend parallel to the cliff (eastern
conditions in two critical areas along the main joints, with an E–W trend parallel to the cliff (eastern
area) or at the intersection of two joint sets (western area) with an N–S and NE–SW orientation,
area) or at the intersection of two joint sets (western area) with an N–S and NE–SW orientation,
specifically defining wedges over the notches bordering the foot of the cliff (Figure 13a).
specifically defining wedges over the notches bordering the foot of the cliff (Figure 13a).Geosciences 2019, 9, 309 16 of 26
Geosciences 2018, 8, x FOR PEER REVIEW 16 of 26
12. (a) The geological and geomorphological
Figure 12. geomorphological modelmodel of the Punta Ferruccio cliff; and (b) the
simplified model for the numerical modelling (removing superficial depositsGeosciences 2019, 9, 309 17 of 26
Geosciences 2018, 8, x FOR PEER REVIEW 17 of 26
Figure 13. (a) The displacement contours and vectors of the Punta Ferruccio cliff; (b) the A-A’ section;
Figure 13. (a) The displacement contours and vectors of the Punta Ferruccio cliff; (b) the A-A’ section;
and (c) the B-B’ section.
and (c) the B-B’ section.
The Punta Ferruccio
Two-dimensional cliff (Figure
sections (Figure 13b,c),
14) wascutting
affectedthebymodel
repeated large landslideswith
in correspondence in 2004–2005 (L1
the two failure
in Figure 14b,e) and 2014 (L2 in Figure 14c,f). The geological model used for the numerical modelling
areas, clearly outline a topple movement that involves the cliff above the notches. The major joints
was defined on the LIDAR data acquired in 2011. Thus, the model simulates the pre-landslide
largely influence the failure geometry and the landslide mechanisms on the cliff: the displacement
condition for the 2014 event. The field surveys revealed a large topple landslide affecting a large rock
vectors originate from the more external joint (Figure 13b) or at the intersection of the two main joint
wedge along the cliff edge (L2 in Figure 14c,f). The failure involved one of the critical areas defined
systems affecting the cliff (Figure 13c). The combination of notches as deep as 7 m and major joints
in the modelling. Specifically, it occurred with the same (topple) mechanism, and with the same
parallel to the cliff, along with joints intersecting and forming rock wedges, is revealed to extensively
geomorphological (above a notch) and structural (along a main joint parallel to the cliff) control
control
resulting landslide
the from the phenomena
modelling. Inon2004–2005,
the cliff and
theits retreat.
cliff edge These results,affected
was already obtained
byon
a the 3Devent
large model
reproduced
occurring with
withinthe LIDAR
the data and acquiredconditions
same morphostructural in 2011, areas aconfirmed by repeated
fall landslide followedgeomorphological
by a collapse of
surveys carried out from 2004 to 2017.
the cliff, confirming the failure mechanisms outlined by the modelling for cliffs on conglomerate with
The Punta
a notch (L1 inFerruccio cliff (Figure 14) was affected by repeated large landslides in 2004–2005 (L1 in
Figure 14b,e,f).
Figure 14b,e) and 2014 (L2 in Figure 14c,f). The geological model used for the numerical modelling was
defined on the LIDAR data acquired in 2011. Thus, the model simulates the pre-landslide condition for
the 2014 event. The field surveys revealed a large topple landslide affecting a large rock wedge along
the cliff edge (L2 in Figure 14c,f). The failure involved one of the critical areas defined in the modelling.
Specifically, it occurred with the same (topple) mechanism, and with the same geomorphological
(above a notch) and structural (along a main joint parallel to the cliff) control resulting from the
modelling. In 2004–2005, the cliff edge was already affected by a large event occurring within the same
morphostructural conditions as a fall landslide followed by a collapse of the cliff, confirming the failure
mechanisms outlined by the modelling for cliffs on conglomerate with a notch (L1 in Figure 14b,e,f).Geosciences 2019, 9, 309 18 of 26
Geosciences 2018, 8, x FOR PEER REVIEW 18 of 26
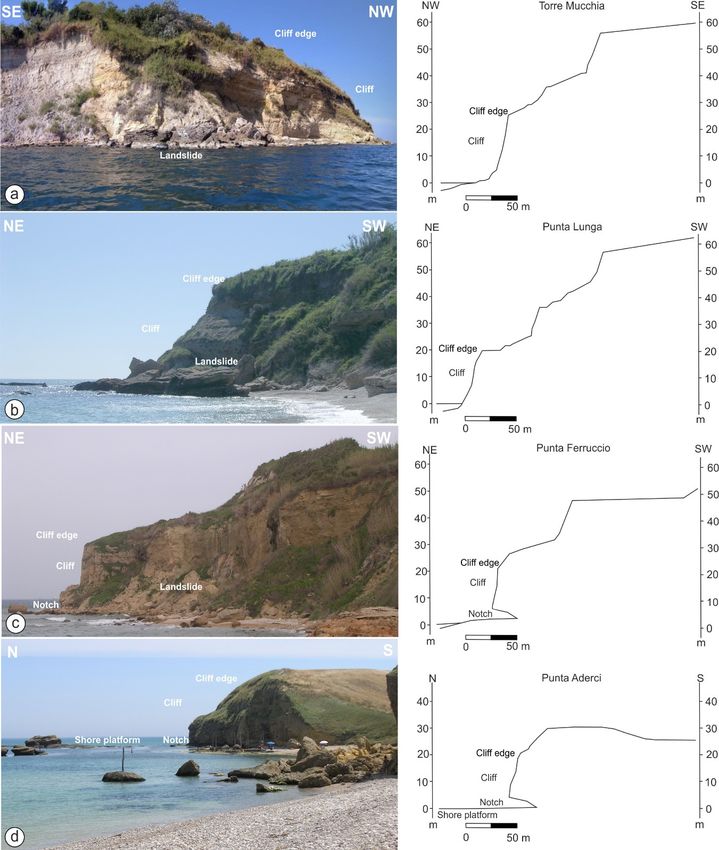
Figure
Figure 14.14.The
ThePunta
PuntaFerruccio
Ferrucciocliff.
cliff. Aerial
Aerial images
images from
from(a)
(a)2004,
2004,(b)
(b)2006,
2006,and
and(c)(c)
2014 (source
2014 (sourceGoogle
Google
Earth); cliff image and geomorphological sections from (d) 2004, (e) 2005, and
Earth); cliff image and geomorphological sections from (d) 2004, (e) 2005, and (f) 2014 outlining(f) 2014 outlining thethe
rockfall that occurred in 2004–2005 (L1) and the topple that occurred in 2014 (L2),
rockfall that occurred in 2004–2005 (L1) and the topple that occurred in 2014 (L2), controlled by the controlled by the
main
main joints
joints and
and notch.Legend:
notch. Legend:1.1. Gravel,
Gravel, 2.
2. Sand,
Sand, 3.3. Landslide
Landslidedeposits,
deposits,4.4.Conglomerate,
Conglomerate, 5. 5.
Sandy
Sandy
clay,
clay, 6. 6. Sandstone,7.7.Clay,
Sandstone, Clay,8.8.Sand,
Sand,9.9. Main
Main joint,
joint, and
and 10.
10. Landslide
Landslidescarp.
scarp.L1, 2004–2005
L1, 2004–2005 rockfall; and
rockfall; and
L2, 2014 topple.
L2, 2014 topple.
4.2.2.
4.2.2. PuntaAderci
Punta Aderci
The
The Punta
Punta Aderci cliffisis>>25
Adercicliff 25 m in height
heightand
andhashasan anundulated
undulatedconcave–convex
concave–convex or or
vertical slope.
vertical slope.
It has a horizontal shore platform, from 70 to 100 m in width, with rocks rising up
It has a horizontal shore platform, from 70 to 100 m in width, with rocks rising up to 1.5 m a.s.l. to 1.5 m a.s.l. TheThe
cliff
cliff develops
develops onon
a aconglomerate
conglomeratebedrockbedrockwith
with thin
thin sand-sandstone
sand-sandstonelenses.
lenses.The
Thebedrock
bedrock is covered
is covered by by
eluvial,
eluvial, colluvialand
colluvial andslope
slopedeposits
deposits (Figure
(Figure 15a)
15a) ItIt is
is widely
widelyaffected
affectedby
byjoints
joints(spaced
(spaced 3–73–7
mm apart)
apart)
with N60°W,
◦ 90°;
◦ N50°W,
◦ 80°NE;
◦ and N20°W,
◦ 90 orientations. Different
with N60 W, 90 ; N50 W, 80 NE; and N20 W, 90 orientations. Different from Punta Ferruccio, from Punta Ferruccio, thethe
notches are smaller and discontinuous, but a large sea cave is present. Both the notches and the cave,
notches are smaller and discontinuous, but a large sea cave is present. Both the notches and the cave,
as well as the main joints and lenses, are included in the 3D simplified volume (Figure 15b).
as well as the main joints and lenses, are included in the 3D simplified volume (Figure 15b).
In the 3D numerical modelling, the analysis showed a single and small area in failure conditions
In the 3D numerical modelling, the analysis showed a single and small area in failure conditions
(Figure 16a). It is controlled by a major joint cutting the cliff model above one of the notches in a very
(Figure 16a). It is controlled by a major joint cutting the cliff model above one of the notches in a
limited area. The cross-section of the most critical area (Figure 16b) shows displacement vectors,
very limited area. The cross-section of the most critical area (Figure 16b) shows displacement vectors,
suggesting a rockfall mechanism for the landslides affecting this coastal sector, as is largely confirmed
suggesting a rockfallalong
by small rockfalls mechanism
the cliff.for the landslides affecting this coastal sector, as is largely confirmed
by small rockfalls along the cliff.
A second stage of modelling was performed in order to investigate the residual stability of the
cliff after removing the small outermost wedge above the notch in failure conditions at the first stage.
This approach made the further evaluation of the stability of the Punta Aderci cliff possible, analyzing
the influence of notches and joints on the cliff retreat processes and mechanism. In this case, the
convergence of the numerical algorithm was obtained, meaning that the cliff did not reach the failure
conditions. However, two critical areas were identified in the model (Figure 17a). The first one is in theGeosciences 2019, 9, 309 19 of 26
same area highlighted in the first stage (Figures 16a and 17a,c), and it is located at the intersection of
the two main joint systems (the N–S and E–W orientations). The displacement vectors in the cross
section suggest a topple mechanism for the further landslides expected in this part of the cliff. The
second critical area is in the eastern portion of the model (Figure 17a,b), bordered by a notch and along
two major joints parallel to the coastline. According to the displacement vectors, the outermost wedge
is supposed to be involved in a rockfall mechanism, while the inner wedge is supposed to follow with
a topple movement (Figure 17b).
Geosciences 2018, 8, x FOR PEER REVIEW 19 of 26
Figure
Figure 15.15.(a)(a)The
Thegeological
geologicaland andgeomorphological
geomorphological features
featuresofofthe
thePunta
PuntaAderci
Adercicliff;
cliff;and
and(b)(b)
thethe
simplified
simplified modelfor
model forthe
thenumerical
numericalmodelling
modelling (removing
(removing superficial
superficialdeposits
deposits<You can also read