Real-time prediction of intradialytic relative blood volume: a proof-of-concept for integrated cloud computing infrastructure
←
→
Page content transcription
If your browser does not render page correctly, please read the page content below
Chaudhuri et al. BMC Nephrology      (2021) 22:274
https://doi.org/10.1186/s12882-021-02481-0

 TECHNICAL ADVANCE                                                                                                                                  Open Access

Real-time prediction of intradialytic relative
blood volume: a proof-of-concept for
integrated cloud computing infrastructure
Sheetal Chaudhuri1,2* , Hao Han1, Caitlin Monaghan1, John Larkin1, Peter Waguespack3, Brian Shulman3,
Zuwen Kuang3, Srikanth Bellamkonda3, Jane Brzozowski1, Jeffrey Hymes3, Mike Black3, Peter Kotanko4,5,
Jeroen P. Kooman2, Franklin W. Maddux1 and Len Usvyat1

  Abstract
  Background: Inadequate refilling from extravascular compartments during hemodialysis can lead to intradialytic
  symptoms, such as hypotension, nausea, vomiting, and cramping/myalgia. Relative blood volume (RBV) plays an
  important role in adapting the ultrafiltration rate which in turn has a positive effect on intradialytic symptoms. It has
  been clinically challenging to identify changes RBV in real time to proactively intervene and reduce potential
  negative consequences of volume depletion. Leveraging advanced technologies to process large volumes of
  dialysis and machine data in real time and developing prediction models using machine learning (ML) is critical in
  identifying these signals.
  Method: We conducted a proof-of-concept analysis to retrospectively assess near real-time dialysis treatment data
  from in-center patients in six clinics using Optical Sensing Device (OSD), during December 2018 to August 2019.
  The goal of this analysis was to use real-time OSD data to predict if a patient’s relative blood volume (RBV)
  decreases at a rate of at least − 6.5 % per hour within the next 15 min during a dialysis treatment, based on 10-
  second windows of data in the previous 15 min. A dashboard application was constructed to demonstrate how
  reporting structures may be developed to alert clinicians in real time of at-risk cases. Data was derived from three
  sources: (1) OSDs, (2) hemodialysis machines, and (3) patient electronic health records.
  Results: Treatment data from 616 in-center dialysis patients in the six clinics was curated into a big data store and
  fed into a Machine Learning (ML) model developed and deployed within the cloud. The threshold for classifying
  observations as positive or negative was set at 0.08. Precision for the model at this threshold was 0.33 and recall
  was 0.94. The area under the receiver operating curve (AUROC) for the ML model was 0.89 using test data.
  Conclusions: The findings from our proof-of concept analysis demonstrate the design of a cloud-based framework
  that can be used for making real-time predictions of events during dialysis treatments. Making real-time predictions
  has the potential to assist clinicians at the point of care during hemodialysis.
  Keywords: End Stage Kidney Disease, Real-Time Prediction, Machine Learning

* Correspondence: sheetal.chaudhuri@fmc-na.com
1
 Fresenius Medical Care, Global Medical Office, 920 Winter Street, Waltham,
MA 02451, USA
2
 Maastricht University Medical Center, Maastricht, The Netherlands
Full list of author information is available at the end of the article

                                        © The Author(s). 2021 Open Access This article is licensed under a Creative Commons Attribution 4.0 International License,
                                        which permits use, sharing, adaptation, distribution and reproduction in any medium or format, as long as you give
                                        appropriate credit to the original author(s) and the source, provide a link to the Creative Commons licence, and indicate if
                                        changes were made. The images or other third party material in this article are included in the article's Creative Commons
                                        licence, unless indicated otherwise in a credit line to the material. If material is not included in the article's Creative Commons
                                        licence and your intended use is not permitted by statutory regulation or exceeds the permitted use, you will need to obtain
                                        permission directly from the copyright holder. To view a copy of this licence, visit http://creativecommons.org/licenses/by/4.0/.
                                        The Creative Commons Public Domain Dedication waiver (http://creativecommons.org/publicdomain/zero/1.0/) applies to the
                                        data made available in this article, unless otherwise stated in a credit line to the data.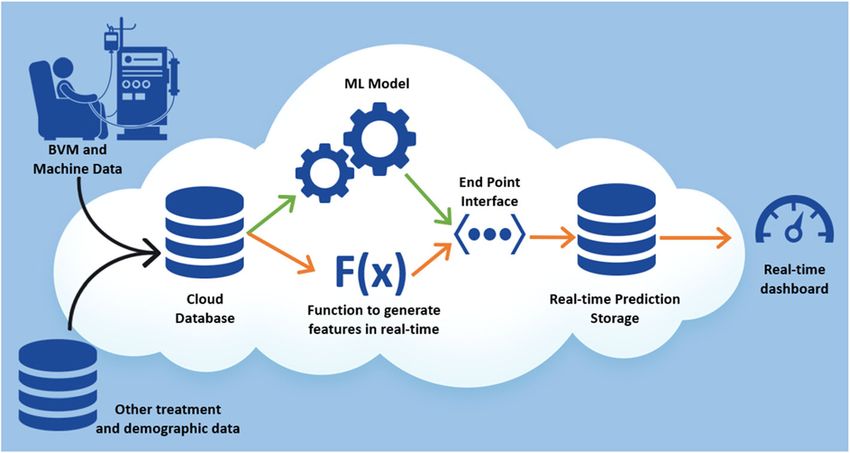
Chaudhuri et al. BMC Nephrology   (2021) 22:274                                                                Page 2 of 10

Background                                                    − 6.5 % per hour anytime during HD. A dashboard
Hemodialysis (HD) involves removal of fluid from the          application was constructed demonstrate how reporting
circulating blood by ultrafiltration and refilling from the   structures may be developed to alert clinicians in real time
extravascular compartments [1]. This process helps pre-       of at-risk cases.
serve blood pressure and tissue perfusion [2]. However,
inadequate refilling could lead to a variety of intradialy-   Methods/design
tic symptoms, such as intradialytic hypotension (IDH),        General design
fatigue, and cramping [3, 4]. IDH can lead to cardiac          For this proof-of-concept analysis, we used data from
complications and an increased risk of death [5–8].           adult patients treated at six clinics (Fresenius Kidney
   Studies have shown the role of relative blood volume       Care, Waltham, MA, United States) that universally
(RBV) and how adapting the ultrafiltration rate has a         used OSD during HD as a standard of care between
positive effect on intradialytic symptoms [9, 10]. How-       December 2018 through August 2019. In these six
ever, it has been clinically challenging to identify          clinics, there was hardware previously setup to trans-
changes in RBV in real time to proactively intervene and      fer data from the OSD device to a secure Internet of
reduce potential negative consequences of volume deple-       Things (IoT) private server on Amazon Web Services
tion. Hence leveraging advanced technologies to process       (AWS; Amazon Web Services, Inc., Seattle, WA,
large volumes of dialysis and machine data in real time       United States) using IoT software [15, 16]. The AWS
and developing prediction models using machine learn-         server was compliant with the Health Insurance Port-
ing (ML) is critical in identifying these signals.            ability and Accountability Act (HIPAA) [15]. Amazon
   A network of dialysis clinics routinely captured           Web Services (AWS), Microsoft Azure, and Google’s
hematocrit, oxygen saturation, and intravascular blood        cloud platforms are the most broadly adopted web
volume during dialysis using Optical Sensing Device           services platform in the world [17–19].
(OSD) device [11–13]. The OSD provides clinicians with           The goal of this analysis was to use historic OSD data
the ability to have near real-time monitoring of the pa-      to build a prediction model that can actively classify pa-
tient’s clinical status during HD. During dialysis treat-     tients at risk of having their RBV decrease at a rate of at
ments, data is collected every ten seconds, which is          least − 6.5 % per hour within the next 15 min of HD
required to be stored, curated, and analyzed timely inter-    throughout the entire treatment. Also, we aimed to con-
ventions. There is a dearth of knowledge about utilizing      struct a dashboard to that could be considered for deliv-
this machine data for monitoring treatment level param-       ery of alerts for patients predicted at risk.
eters and personalizing care for HD patients. This may           This analysis was performed under a protocol that was
be secondary to traditional storage and computing re-         approved by New England Institutional Review Board
sources being unable to handle the processing of such         under a waiver of informed consent per title 45 of the
large data stores.                                            United States Code of Federal Regulations part 46.116(f)
   Big data technologies and cloud-based services are         (Needham Heights, MA, United States; NEIRB# 17-
novel tools that can provide the necessary infrastructure     1311567-1). The analysis was conducted in adherence
to support such near real-time applications. Big data is a    with the Declaration of Helsinki.
field that incorporates ways to analyze, systematically ex-
tract information from, or otherwise deal with data sets      Patient population
that are too large or complex to be dealt with by trad-       We included data from patients who were greater than
itional software [14]. Cloud technology moves big data        or equal to 18 years of age and females were not known
processing off local computers and onto shared web ser-       to be pregnant.
vices, allowing for greater optimization of resources and
faster processing as a result. Cloud platforms provides a     Optical sensing device
secure, efficient, and reliable way to process and analyze    The OSD (Crit-Line®, Bad Homburg, Germany) profiles
data.                                                         patient’s intradialytic status to assist clinicians monitor
   We conducted a retrospective analysis to assess dialy-     the treatment assessment and intervention during
sis treatment data from 2019. This analysis was used to       hemodialysis [20]. By monitoring blood volume percent
develop a proof-of-concept that cloud infrastructure can      changes, caregivers can adjust treatment as necessary to
be used in clinical care and provide necessary data to        maximize fluid removal and prevent common intradialy-
consider if implementation in the future is warranted.        tic symptoms, such as IDH, nausea, vomiting, and
The model developed in this proof-of-concept was not          cramping [9, 21–24], as well as minimize the risk of
utilized in clinical practice.                                worse outcomes [12, 25].
   We created a ML application to identify patients at           Per the manufacture’s specifications for RBV thresh-
risk of having their RBV decrease at a rate of at least       olds [20], when the rate of change in RBV, based on the
Chaudhuri et al. BMC Nephrology      (2021) 22:274                                                              Page 3 of 10

latest 15 min of data, is decreasing less than − 3 % per       ultrafiltration volume removed, and remaining time on
hour, the ultrafiltration rate might be increased without      dialysis in minutes (RTD).
immediate risk of intradialytic symptoms. In this case           Patient demographic information such as age, height,
the patient’s plasma refill rate is occurring at the same      access type, and clinic ID were referenced from the on-
or a greater rate than the ultrafiltration rate. When the      premises clinical data warehouse. Patient measures in
rate of change in RBV, based on the latest 15 min of data,     the clinic on the day of treatment included pre-dialysis/
is decreasing between − 3 and − 6.5 % per hour, it indi-       post-dialysis weight and the type of dialyzer used in
cates a suitable compromise between a high ultrafiltration     treatment.
rate and the prevention of intradialytic symptoms. When          OSD and 2008T® dialysis machine data from five sep-
the rate of change in RBV, based on the latest 15 min of       arate time windows: 1, 5, 10, 15 min, and since-start-of-
data, is greater than − 6.5 % per hour, there is a rapid de-   treatment windows were used to derive additional intra-
crease in RBV and bears a higher risk for intradialytic        treatment features using average, minimum, maximum
symptoms, such as lightheadedness, nausea, vomiting,           and standard deviation for each time window. The final
cramping, or hypotension. Prior studies have shown re-         dataset spanned 751,354 treatment records and 493 in-
ductions in intradialytic complications with ultrafiltration   put variables including features for average, minimum,
based on RBV targets in relatively consistent ranges [9,       maximum, and standard deviation for the continuous
21–24], and that ultrafiltration performed targeting RBV       variables at each time point.
deceases between − 3 and − 6.5 % per hour associates with
better patient outcomes [12, 25].                              Predictive model
                                                               The model was built using the AWS Sagemaker [26] de-
Model data and features                                        velopment platform. The curated final dataset of 751,354
The ML model was trained and tested on a static set of         treatment records was randomly split into training data
historical observations from our system. Data was de-          (80 %), validation data (10 %) and test data (10 %). The
rived from three sources: (1) OSDs, (2) HD machines,           target variable was a binary indicator of patients who ex-
and (3) patient electronic health records.                     perienced a decrease in RBV at a rate of at least − 6.5 %
  OSD data and treatment data from the 2008 T® dialysis        per hour during a dialysis treatment within the next
machines were collected every 10 s during dialysis treat-      15 min. Figure 1 shows the ascertainment period and
ments. OSD data included variables like blood volume           the prediction period for the model.
alert level, RBV, changes in hematocrit, hemoglobin,             The data showed a 22 % prevalence within observa-
oxygen saturation, minimum oxygen saturation, and              tions in which RBV decreased at rate of at least 6.5 %
oxygen alert level.                                            per hour during a dialysis treatment. Given the imbal-
  Dialysis machine data included variables such as sys-        anced nature of our data, we limited our ML model se-
tolic blood pressure, diastolic blood pressure, mean ar-       lection to algorithms that deal well with such data,
terial blood pressure, pulse, delivered equilibrated (e)Kt     including support vector and random forest families [27,
V, average small molecular clearance [Kecn], projected         28]. The final model was trained using a ML tool known
single pool (sp) Kt V, first plasma Na, body volume,           as an extreme gradient boosting (XGboost) algorithm
blood flow rate, conductivity, dialysate flow rate, inter-     [29]. Hyperparameters are model-specific internal pa-
vention performed on the machine, arterial pressure,           rameters that are initially set to certain default values to
dialysate temperature, venous pressure, ultrafiltration        cover general use cases. These parameters must be
rate, blood volume processed, ultrafiltration goal,            tuned for the problem at hand to get optimal model

 Fig. 1 Ascertainment Period and Prediction Period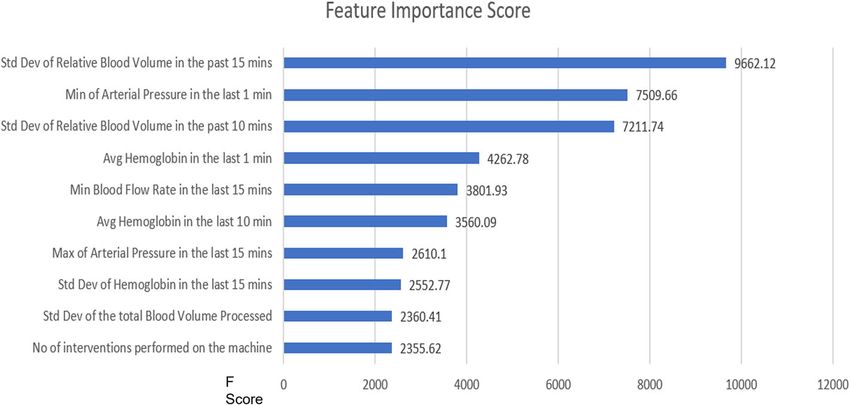
Chaudhuri et al. BMC Nephrology (2021) 22:274 Page 4 of 10
performance [30]. After model selection, the Bayesian In the cloud, IoT software processed incoming data
optimization strategy implemented by Amazon Sage- from the clinic. The data was then curated into a big
Maker was used to tune the model hyperparameters to data store within the cloud. The big data store refer-
maximize the AUROC [31]. In the Bayesian tuning strat- enced on-premises data warehouse to securely extract
egy ML algorithms performance is modeled as a sample patient-protected information and other clinical data
of a Gaussian process [32, 33]. This allows information and then to securely feed into the ML model. These
from prior iterations to inform the next parameters to multiple sources of data were made available to the Ma-
try to optimize model performance, balancing both ex- chine Learning Engine (MLE) which was also hosted in
ploration of values not yet used with exploitation of the the cloud. The MLE would then make a prediction
best-known results. based on the data and generate an alert to the clinicians
The predicted probability output by the model was and nurses for identified at-risk cases. The entire ana-
converted to a binary prediction to predict positive and lysis pipeline had to be optimized to ensure low latency
negative cases of RBV decreasing at rate of at least − (i.e. ensure timeliness of near real-time prediction). This
6.5 % per hour during a dialysis treatment. The cutoff optimization process is beyond the scope of the current
threshold for the binary prediction was set to 0.08, so if discussion.
the prediction score was above 0.08, then the patient
was flagged to be at risk of decreasing RBV. The thresh- Cloud computing infrastructure flow for generating real
old was set by evaluating the results of the training and time dashboard
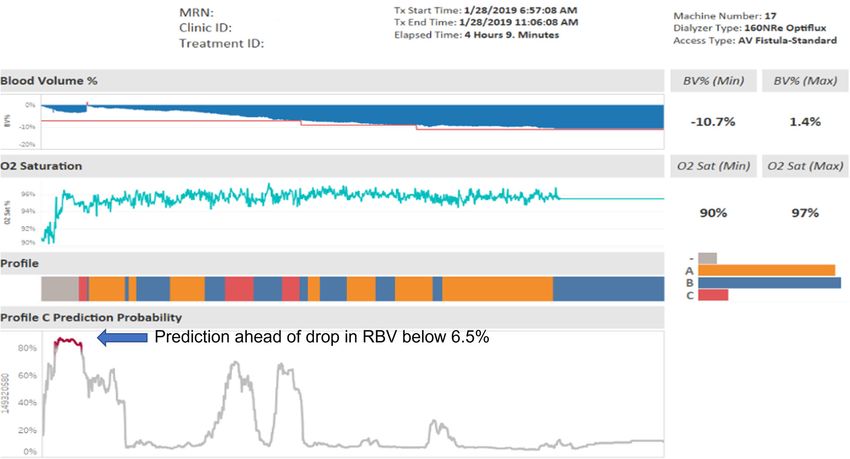
validation data. The data flow for the entire modeling pipeline within
Feature importance from the gradient boosting algo- AWS is shown in Fig. 3. Green arrows in Fig. 3 show
rithm was used to derive top features (variables) that how the data flows from the clinics using OSD, the
were considered highly predictive of the outcome. dialysis machines, and the warehouse into the cloud
The feature importance is calculated using the gain to train a model and provide data to the endpoint
method, or the relative contribution of the corre- interface. The orange arrows show how the data flows
sponding feature for each tree in the model. The in real time from the clinic using OSD and the data
method works by averaging the training loss reduc- warehouse. Each new message in the cloud data store
tion caused by feature utilization for each split in the triggers a function, which creates 493 different fea-
decision tree [34]. tures used in the trained model. These features are
then provided as an input data parameter to the end-
Conceptional analysis design point interface to generate a prediction and store the
Figure 2 shows a general design of the analysis setup. results in another data store. The prediction results
Conceptually, the analysis consisted of three main com- are then used in a dashboard to generate a proof-of-
ponents: (1) Hardware and devices needed to monitor concept clinical user interface.
patients, (2) Cloud-based Service for real-time data ana-
lysis and communication, and (3) On-premises secure Analysis of ML model performance
Data Warehouse to reference patient-protected informa- Performance of ML model was measured by the area
tion needed for data analysis. under the receiver operating curve (AUROC) in the
Fig. 2 Analysis Design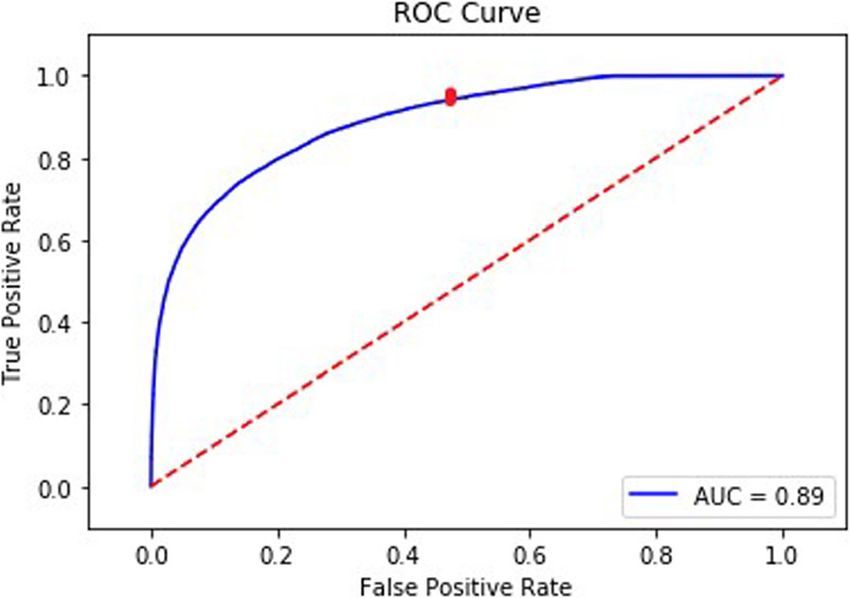
Chaudhuri et al. BMC Nephrology (2021) 22:274 Page 5 of 10
Fig. 3 Data Flow for Real-time prediction using the AWS Cloud Environment
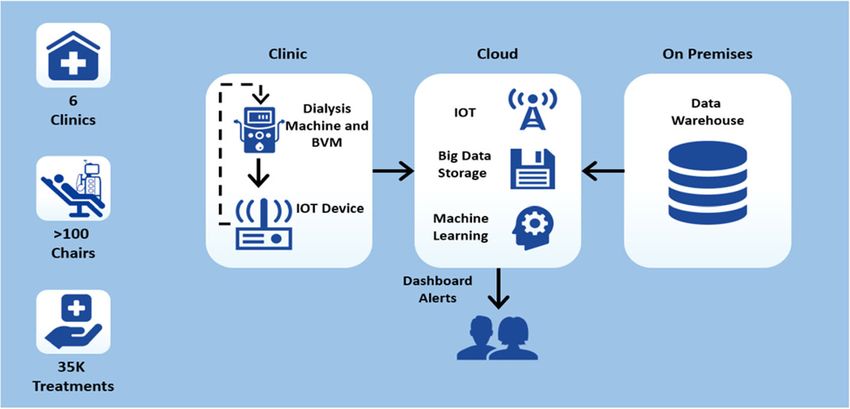
training, validation, and testing datasets, as well as the number of true negatives
Specificity ¼
recall and precision in the testing datasets. AUROC ðnumber of true negatives þ number of false positivesÞ
measures the rate of true and false positives classified by
the prediction model across probability thresholds. And the Negative Predictive Value (NPV) is defined
Table 1 shows the definition of true/false positive and as:
negative predictions classified by the model in the number of true negatives
assessment of performance in the testing dataset. NPV ¼
ðnumber of true negatives þ number of false negativesÞ
Recall (sensitivity) measures the rate of true positives
classified by the model at a specified threshold and is AUROC, recall, precision, specificity and NPV metrics
calculated as follows: yield scores on a scale of 0 (lowest) to 1 (highest). A
model performing at chance would yield an AUROC of
number of true positives 0.5. The cutoff threshold for classifying predictions was
Recall ¼ selected to optimize recall and precision according to
ðnumber of true positives þ number of false negativesÞ
the use case.
Precision measures the positive predictive value for the
Results
model at a specified threshold and is calculated as follows:
Patient characteristics
We obtained data from 616 adult in-center HD patients
number of true positives that were treated in six clinics to build the prediction
Precision ¼
ðnumber of true positives þ number of false positivesÞ
model. Patient demographics are shown in Table 2. The
descriptive statistics of numeric input variables used to
Similarly, Specificity for the model is defined as: train the model are shown in Table 3.
Table 1 Definition of true/false positive and negative predictions classified by the model in the assessment of performance in the
testing dataset
True Patients correctly classified as having a risk of their relative blood volume (RBV) decrease at a rate of at least − 6.5 % per hour within
positives the next 15 min by the model.
False Patients incorrectly classified as having a risk of their RBV decrease at a rate of at least − 6.5 % per hour within the next 15 min by the
positives model.
True Patients correctly classified as not having a risk of their RBV decrease at a rate of at least − 6.5 % per hour within the next 15 min by
negatives the model.
False Patients incorrectly classified as not having a risk of their RBV decrease at a rate of at least − 6.5 % per hour within the next 15 min by
negatives the model.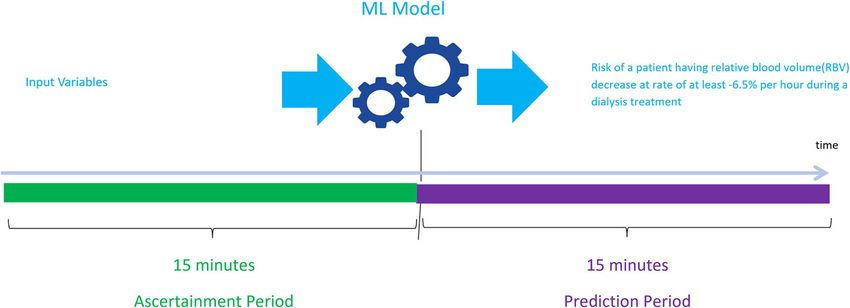
Chaudhuri et al. BMC Nephrology   (2021) 22:274                                                                                Page 6 of 10

Table 2 Demographics of patients at the start of the study           Table 3 Descriptive Statistics of Numeric Input Variables
period (entire cohort)                                               (Training Data)
Patient Characteristics                           Value              Variable                                    N         Mean ± SD
Number of Patients                                616                Diastolic Blood Pressure [mmHg]             562,012   70.13 ± 14.42
Average Age                                       64.5(SD: ±14.83)   Mean Arterial Blood Pressure [mmHg]         562,012   96.72 ± 18.13
Male                                              57.8 %             Mean Pulse [bpm]                            562,012   71.83 ± 11.08
Black                                             27.5 %             Systolic Blood Pressure [mmHg]              562,012   133.75 ± 24.27
White                                             68.6 %             Delivered equilibrated (E)Kt V              415,498   0.62 ± 0.24
Hispanic                                          22.1 %             Mean Kecn                                   539,626   252.38 ± 33.25
Congestive Heart Failure                          24.7 %             Projected single pool (sp)Kt V              533,226   0.78 ± 0.54
Diabetes                                          39.1 %             First Plasma Na [mEq/L]                     537,453   140.24 ± 3.78
Hypertension                                      77.5 %             Body Volume [L]                             533,226   34.84 ± 8.46
Ischemic Heart Disease                            24.5 %             Critline Relative Blood Volume Alert [%]    601,210   -12.42 ± 3.95
Average Albumin [g/dL]                            3.8(SD: ±0.38)     Relative blood volume (RBV) [%]             601,210   -4.16 ± 6.87
                                                                     Changes in hematocrit [%]                   601,210   26.83 ± 15.42
ML Model performance and feature importance                          Hemoglobin [g/dL]                           601,210   8.96 ± 5.33
The resulting predictive model was tested on 10 %                    Oxygen saturation [%]                       601,210   69.39 ± 39.25
(75,072 records) of the treatment data from all 616
                                                                     Minimum Oxygen Saturation [%]               601,210   88.37 ± 16.84
patients, which was withheld during training.
                                                                     Oxygen Alert Level [%]                      601,210   68.29 ± 34.64
   Using a low threshold of 0.08, the model had a re-
call rate of 0.94, meaning the model was able to cap-                Blood Flow Rate [mL/min.]                   601,210   348.99 ± 142.23
ture 94 % of the observations that had a decrease in                 Conductivity [mS/cm]                        601,210   13.7 ± 1.09
RBV at a rate of at least − 6.5 % per hour within the                Dialysate Flow Rate [mL/min.]               601,210   643.03 ± 182.94
next 15 min. The precision of the model was 0.33.                    Monitor Temp [°C]                           601,210   36.49 ± 0.88
The specificity for the model was 0.52 and the NPV
                                                                     Arterial Pressure [mmHg]                    601,210   -162.43 ± 77.12
was 0.97. The AUROC (Fig. 4) for the final hyper-
                                                                     Dialysate Temperature [°C]                  601,210   32.86 ± 52.96
parameter tuned model was 0.89. The red dot on the
figure shows the true positive rate and the false posi-              Venous Pressure [mmHg]                      601,210   156.84 ± 71.85
tive rate at a threshold of 0.08.                                    Ultrafiltration Rate [mL/Hr]                601,210   550.6 ± 350.28
   Figure 5 shows a list of the top 10 features from the             Blood Volume Processed [L]                  601,210   420.41 ± 271.47
tuned model that were most predictive of a patient ex-               Remaining Time on Dialysis [Min]            601,210   95.46 ± 71.16
periencing their RBV decrease at a rate of at least −
                                                                     Ultrafiltration Goal [mL]                   601,210   2506.46 ± 1042.49
6.5 % per hour during a dialysis treatment in the next
                                                                     Ultrafiltration Volume Removed [mL]         601,210   1280.32 ± 999.72
15 min. It shows how valuable each feature was to the
model in predicting the outcome. Higher value of the                 Age [Years]                                 560,899   66.57 ± 14.35
feature implies it is more important in calculating the              Height [cm]                                 535,433   168.1 ± 11
outcome of the model.                                                Most Recent Post-Dialysis Weight [Kg]       552,865   80.12 ± 24.05
                                                                     Most Recent Pre-Dialysis Weight [Kg]        552,865   82.08 ± 24.55
Proof-of-concept dashboard
                                                                     Average 30 days post dialysis weight [Kg]   552,865   80.06 ± 24.08
Figure 6 shows the proof-of-concept dashboard for
                                                                     Average 30 days pre dialysis weight [Kg]    552,865   82.03+/-24.59
a patient during dialysis treatment. The patient goes
                                                                     SD Standard Deviation
through various stages of having a risk of RBV de-
creasing at rate of at least − 6.5 % per hour (that is
entering Profile C as shown in the figure). The
probability of the prediction of profile C generated                 Discussion
from the model is above 80 % before the actual oc-                   The findings from our proof-of-concept analysis suggest
currence of the event denoted in red under the Pro-                  the potential for real-time reporting and prediction of
file header. The RBV % at this point drops below −                   treatment blood volume profiles that are associated with
6.5 % as shown under the Blood Volume % header.                      an increased risk of intra-dialytic symptoms and would
This dashboard illustrates that the model was able                   subsequently be amenable to intervention. Furthermore,
to predict the occurrence of the event before it                     the architectural framework demonstrated in this paper
happened.                                                            can be used for making real-time predictions of other
Chaudhuri et al. BMC Nephrology (2021) 22:274 Page 7 of 10
the variability in RBV in the prior 10 and 15 min, mini-
mum arterial pressure in the prior 1 min, mean
hemoglobin in the prior 1 and 10 min(s), and minimum
blood flow rate in the prior 15 min, as well as other met-
rics related to atrial pressure, hemoglobin, and total
blood volume processed (Fig. 5). The feature importance
of these parameters appears to be identifying combina-
tions of minor signals providing early signs of issues
with ultrafiltration (e.g. peristaltic pump being starved of
flow due to higher resistance in the access circuit). Ul-
timately, this model may have the potential to support
the clinicians by classifying risk levels in near real-time.
This analysis also adds onto the proof-of-concept ana-
lysis from Barbieri et al., where they developed an artifi-
Fig. 4 Area Under the Receiver Operating Curve for the
Prediction Model
cial neural network model predicting session-specific Kt/
V, fluid volume removal, heart rate, and BP based on pa-
tient characteristics, historic hemodynamic responses,
events during dialysis treatments; and as such this ana- and dialysis-related prescriptions [36, 37].
lysis serves as a proof-of-concept. Making real-time pre- Cloud Computing Resources provide seamless tools to
dictions can help clinicians and nurses to provide build, analyze, and integrate real-time predictive models
proactive support at the point of care during dialysis without investing in many hardware and software re-
treatment. A practical implication for the present would sources on premise. This allows for a secure and cost-
be that, if nurses and clinicians are alerted to the risk of effective way of building predictive models when re-
a drop in the blood volume 15 min prior to the RBV de- sources are limited. These applications can also be
creasing at rate of at least − 6.5 % per hour during a dia- scaled on-demand, where support can be expanded from
lysis treatment, they would have ample time to intervene tens to hundreds of clinics seamlessly.
and adjust the ultrafiltration rate in order to prevent that Along with the disease burden, inadequate dialysis
patient from entering the risk zone for intradialytic process may play a role in the pathophysiology of car-
symptoms like IDH [20]. diac injury, cognitive impairment, and brain injury in
Prior studies have been attempted to monitor HD patients [38–40]. Large amounts of data collected
hematocrit and reduce intradialytic symptoms, however, from the dialysis machines to build and deploy ML
they were not used in standard practice because of the models can be used in personalizing dialysis treatments
difficulty in interpreting the OSD outputs updated every for HD patients. Optimizing dialysate temperature, mon-
10 s [9, 35]. The ML model presented in this analysis en- itoring access flows, modeling retention solute clearance
hances the findings and delivers them in a comprehend- and electrolyte profiling, and predicting IDH are other
ible way. The top predictors of a RBV decreasing at a examples of how machine data can be utilized to
rate of at least − 6.5 % per hour were shown to include personalize treatments for patients. Successful
Fig. 5 Top 10 features from Prediction Model and the Feature importance ScoreChaudhuri et al. BMC Nephrology (2021) 22:274 Page 8 of 10 Fig. 6 Proof-of-Concept Dashboard for Monitoring Risk during Dialysis Treatment applications of analyzing and modeling large amounts of of its relationship with fluid overload [25]. Therefore, clinical data from the machines will require technology the results of the model should always be interpreted and a framework like what has been presented in this in the context of the patient. paper. The goal of this proof- of-concept project was to dem- This paper provides an important proof-of-concept onstrate the architecture of how machine data can be for the application of a ML-based model in the pre- utilized in real time. The goal of the dashboard if imple- vention of intradialytic complications. However, it mented is to capture as many patients as possible who should be stressed that while the decline in RBV dur- would have an adverse intradialytic event or have the ing dialysis is an important risk factor for IDH, the risk of dropping RBV at the rate of at least − 6.5 % per critical decline in RBV and the level at which the pa- hour. Hence, the focus was on sensitivity rather than tient experiences IDH also differs significantly be- specificity or precision when determining the threshold tween patients [7, 21]. IDH is an important risk used to evaluate model performance. However, in a real- factor for mortality, as well as for ischemia of vital world implementation, the optimal threshold can be se- organs, such as heart and brain, which may lead to lected to minimize either false positives or false nega- long-term organ damage. Therefore, methods to re- tives, which will depend on the intervention and duce the risk for this complication are of vital im- reporting demands. portance [25, 40–42]. Other factors, such as an This architecture also demonstrates the capabilities of impairment in vascular reactivity or the cardiovascular a cloud-based framework in handling the large amounts status of the patient play an important role in the of patient and treatment data collected from dialysis ma- sensitivity of the patient to a decline in RBV. More- chines. ML models can be utilized for personalizing care over, there is a possibility of misclassification of pa- in dialysis patients in real time. However, there will be tients at risk, where the model predicts that the RBV instances when the ML model will predict incorrectly, so will decrease at a rate of at least − 6.5 % per hour teams developing interventions using ML models need during a dialysis treatment whereas it does not; hence to be aware of this limitation. This proof-of-concept the clinical intervention should be designed in such a could also be used for predicting low or differing ranges way that it does not have an adverse impact on the of RBV. The clinical team responsible for designing in- treatment or the patient. In this respect, it is also im- terventions will need to interpret RBV targets and adjust portant that profiles with a small decline in RBV may ultrafiltration rate in a personalized manner considering carry the risk of adverse outcomes, possibly because each patient’s unique history of intradialytic
Chaudhuri et al. BMC Nephrology            (2021) 22:274                                                                                             Page 9 of 10

complications. Also, the true performance of the ML                               Competing interests
model can only be demonstrated after conducting ran-                              SC is a student at Maastricht University Medical Center. SC, HH, LU, CM, JL,
                                                                                  PW, BS, ZK, SB, JB, JH, MB and FWM are employees of Fresenius Medical
domized clinical trials. The cloud-based framework                                Care. PK is an employee of Renal Research Institute, a wholly owned
should allow scaling of this proof-of-concept analysis;                           subsidiary of Fresenius Medical Care. LU, SC, JH, PK, FWM have share
however, this has not been tested in real world applica-                          options/ownership in Fresenius Medical Care. PK is an inventor on multiple
                                                                                  patents in the field of dialysis and is on the Editorial Board of Blood
tion. Models deployed at point of care could also be                              Purification and Kidney and Blood Pressure Research. FWM has directorships
used to receive feedback from the nurses and clinicians                           in the Fresenius Medical Care Management Board, Goldfinch Bio, and Vifor
to serve as refined input to retrain the model.                                   Fresenius Medical Care Renal Pharma. JPK has no relevant conflicts of
                                                                                  interest to disclose.

Conclusions                                                                       Author details
                                                                                  1
                                                                                   Fresenius Medical Care, Global Medical Office, 920 Winter Street, Waltham,
This proof-of-concept analysis demonstrated the poten-                            MA 02451, USA. 2Maastricht University Medical Center, Maastricht, The
tial of the creation and deployment of a real-time pre-                           Netherlands. 3Fresenius Medical Care North America, Waltham, MA, USA.
                                                                                  4
dictive model based on patient and dialysis treatment                              Renal Research Institute, New York, NY, USA. 5Icahn School of Medicine at
                                                                                  Mount Sinai, New York, NY, USA.
data. The mechanics for triggering a model endpoint
based on real-time message capture and to produce real-                           Received: 14 March 2021 Accepted: 26 July 2021
time reporting that includes treatment metrics coupled
with model inferences were successfully implemented.
The challenge will be to scale for large amounts of data                          References
                                                                                  1. Schneditz D, Roob J, Oswald M, Pogglitsch H, Moser M, Kenner T, et al.
and to design appropriate interventions.                                              Nature and rate of vascular refilling during hemodialysis and ultrafiltration.
                                                                                      Kidney Int. 1992;42(6):1425–33.
                                                                                  2. Daugirdas JT. Dialysis hypotension: a hemodynamic analysis. Kidney Int.
Abbreviations                                                                         1991;39(2):233–46.
OSD: Optical Sensing Device; ML: Machine Learning; AUROC: Area Under the          3. Alvarez L, Brown D, Hu D, Chertow GM, Vassalotti JA, Prichard S. Intradialytic
Receiver Operating Curve; HD: Hemodialysis; IDH: Intradialytic Hypotension;           Symptoms and Recovery Time in Patients on Thrice-Weekly In-Center
AWS: Amazon Web Services; RBV: Relative Blood Volume; IoT: Internet of                Hemodialysis: A Cross-sectional Online Survey. Kidney Med. 2020;2(2):125–
Things; HIPAA: Health Insurance Portability and Accountability Act;                   30.
RTD: Remaining Time on Dialysis; MLE: Machine Learning Engine                     4. Kuipers J, Verboom LM, Ipema KJR, Paans W, Krijnen WP, Gaillard C, et al.
                                                                                      The Prevalence of Intradialytic Hypotension in Patients on Conventional
Acknowledgements                                                                      Hemodialysis: A Systematic Review with Meta-Analysis. Am J Nephrol. 2019;
We would like to acknowledge Jerry Yu and Andrew Long for assistance in               49(6):497–506.
developing the machine learning model. We would also like to acknowledge          5. Morfin JA, Fluck RJ, Weinhandl ED, Kansal S, McCullough PA, Komenda P.
Vladimir M Rigodon for assistance with the composition of the regulatory              Intensive Hemodialysis and Treatment Complications and Tolerability. Am J
protocol for this analysis.                                                           Kidney Dis. 2016;68(5S1):43–50.
                                                                                  6. Gul A, Miskulin D, Harford A, Zager P. Intradialytic hypotension. Curr Opin
Authors' contributions                                                                Nephrol Hypertens. 2016;25(6):545–50.
Design was performed by SC, HH, CM, PW, BS, SB, ZK, LU, FWM. Data                 7. Sars B, van der Sande FM, Kooman JP. Intradialytic Hypotension:
Extraction and analysis was performed by SC, HH, BS, SB, CM and PW. The               Mechanisms and Outcome. Blood Purif. 2020;49(1–2):158–67.
interpretation, drafting and revision of this manuscript was conducted by SC,     8. Keane DF, Raimann JG, Zhang H, Willetts J, Thijssen S, Kotanko P. The time
HH, CM, PW, BS, SB, ZK, LU, JL, JB, JH, MB, PK, JPK and FWM. The decision to          of onset of intradialytic hypotension during a hemodialysis session
submit this manuscript for publication was jointly made by all authors SC,            associates with clinical parameters and mortality. Kidney Int. 2021;99(6):
HH, CM, PW, BS, SB, ZK, LU, JL, JB, JH, MB, PK, JPK and FWM and the                   1408–17.
manuscript was confirmed to be accurate and approved by all authors.              9. Steuer RR, Leypoldt JK, Cheung AK, Senekjian HO, Conis JM. Reducing
                                                                                      symptoms during hemodialysis by continuously monitoring the hematocrit.
                                                                                      Am J Kidney Dis. 1996;27(4):525–32.
Funding
                                                                                  10. Dasselaar JJ, Huisman RM, de Jong PE, Franssen CF. Measurement of relative
Analysis was supported by Fresenius Medical Care.
                                                                                      blood volume changes during haemodialysis: merits and limitations.
                                                                                      Nephrol Dial Transplant. 2005;20(10):2043–9.
Availability of data and materials                                                11. Balter P, Artemyev M, Zabetakis P. Methods and challenges for the practical
The datasets and coding utilized for this study are not publicly available. The       application of Crit-Line monitor utilization in patients on hemodialysis.
datasets were obtained from the Fresenius Medical Care North America                  Blood Purif. 2015;39(1–3):21–4.
Knowledge Center Data Warehouse, which is restricted to use by only               12. Sibbel SP, Ficociello LH, Black M, Thakuria M, Mullon C, Diaz-Buxo J, et al.
authorized employees and is not publicly available.                                   Effects of Crit-Line(R) monitor use on patient outcomes and epoetin alfa
                                                                                      dosing following onset of hemodialysis: a propensity score-matched study.
Declarations                                                                          Blood Purif. 2014;37(3):249–57.
                                                                                  13. Yoshida I, Ando K, Ando Y, Ookawara S, Suzuki M, Furuya H, et al. A new
Ethics approval and consent to participate                                            device to monitor blood volume in hemodialysis patients. Ther Apher Dial.
 This analysis was performed under a protocol that was approved by New                2010;14(6):560–5.
England Institutional Review Board (Needham Heights, MA, United States;           14. Ristevski B, Chen M. Big data analytics in medicine and healthcare. J Integr
NEIRB# 17-1311567-1). The Institutional Review Board waived the need for in-          Bioinform. 2018;15(3):20170030. https://doi.org/10.1515/jib-2017-0030.
formed consent under per title 45 of the United States Code of Federal Reg-       15. Amazon AWSHIPAA, Eligible Services A. 2020. (Accessed March 2020):
ulations part 46.116(f) [43]. The analysis was conducted in adherence with            https://aws.amazon.com/compliance/hipaa-eligible-services-reference/.
the Declaration of Helsinki.                                                      16. Enterprise HP. Edge Device. Hewlett Packard Enterprise. 2020. (Accessed
                                                                                      March 2020):https://www.hpe.com/us/en/servers/edgeline-systems.html.
Consent for publication                                                           17. Amazon. What is AWS. Amazon. 2020. (Accessed March 2020):https://aws.a
Not Applicable.                                                                       mazon.com/what-is-aws/.
Chaudhuri et al. BMC Nephrology (2021) 22:274 Page 10 of 10
18. Microsoft. Microsoft Azure. Microsoft. 2020. (Accessed March 2020):https://a 42. Assimon MM, Wang L, Flythe JE. Cumulative Exposure to Frequent
zure.microsoft.com/en-us/. Intradialytic Hypotension Associates With New-Onset Dementia Among
19. Google. Google Cloud. Google. 2020. (Accessed June 2020):https://cloud. Elderly Hemodialysis Patients. Kidney Int Rep. 2019;4(4):603–6.
google.com/. 43. 2018 Rule C. Title 45, Code of Federal Regulations, Part 46, Protection of
20. America FMCN. Crit-Line IV Monitor. 2020. (Accessed May 2020):https:// Human Subjects. Department of Health and Human Services. 2018. https://
fmcna.com/products/fluid-management/crit-line-iv-monitor/. www.hhs.gov/ohrp/regulations-and-policy/regulations/45-cfr-46/revised-
21. Barth C, Boer W, Garzoni D, Kuenzi T, Ries W, Schaefer R, et al. common-rule-regulatory-text/index.html#46.116(f).(Accessed 13 Jul 2021)
Characteristics of hypotension-prone haemodialysis patients: is there a
critical relative blood volume? Nephrol Dial Transplant. 2003;18(7):1353–
60.
Publisher’s Note
Springer Nature remains neutral with regard to jurisdictional claims in
22. Rodriguez HJ, Domenici R, Diroll A, Goykhman I. Assessment of dry weight
published maps and institutional affiliations.
by monitoring changes in blood volume during hemodialysis using Crit-
Line. Kidney Int. 2005;68(2):854–61.
23. Santoro A, Mancini E, Paolini F, Cavicchioli G, Bosetto A, Zucchelli P.
Blood volume regulation during hemodialysis. Am J Kidney Dis. 1998;
32(5):739–48.
24. Santoro A, Mancini E, Basile C, Amoroso L, Di Giulio S, Usberti M,
et al. Blood volume controlled hemodialysis in hypotension-prone
patients: a randomized, multicenter controlled trial. Kidney Int. 2002;
62(3):1034–45.
25. Preciado P, Zhang H, Thijssen S, Kooman JP, van der Sande FM, Kotanko P.
All-cause mortality in relation to changes in relative blood volume during
hemodialysis. Nephrol Dial Transplant. 2019;34(8):1401–8.
26. Amazon. SageMaker. Amazon. 2020. (Accessed March 2020):https://aws.ama
zon.com/sagemaker/.
27. Sarica A, Cerasa A, Quattrone A. Random Forest Algorithm for the
Classification of Neuroimaging Data in Alzheimer’s Disease: A Systematic
Review. Front Aging Neurosci. 2017;9:329.
28. Noble WS. What is a support vector machine? Nat Biotechnol. 2006;24(12):
1565–7.
29. Chen TGC. XGBoost: A Scalable Tree Boosting System. Proceedings of the
22nd ACM SIGKDD International Conference on Knowledge Discovery and
Data Mining. San Francisco: Association for Computing Machinery; 2016. p.
785–94.
30. Dernoncourt F, Nemati S, Kassis EB, Ghassemi MM. Hyperparameter Selection.
Secondary Analysis of Electronic Health Records. Cham (CH). 2016:419 – 27.
31. Amazon. How Hyperparameter Tuning Works. Amazon. 2021. (Accessed
June 2021):https://docs.aws.amazon.com/sagemaker/latest/dg/automatic-
model-tuning-how-it-works.html.
32. Chao Qin YZ, Bao F, Zhang C, Liu P, Liu P. XGBoost Optimized by Adaptive
Particle Swarm Optimization for Credit Scoring”. Mathematical Problems in
Engineering. 2021;2021, Article ID 6655510 (Accessed May 2021):https://doi.
org/10.1155/2021/6655510.
33. Snoek J HL, and R. P. Adams. Practical bayesian optimization of
machine learning algorithms. Advances in Neural Information
Processing Systems, vol 4. 2012;4 (Accessed May 2021):https://arxiv.org/a
bs/1206.2944.
34. Tjeng Wawan, Cenggoro B, Arif Budiarto, James Baurley,Teddy Suparyanto,
BensPardamean. Features Importance in Classification Models for Colorectal
Cancer Cases Phenotype in Indonesia. Proc Comput Sci. 2019;157:313 – 20
https://www.sciencedirect.com/science/article/pii/S1877050919310907.
(Accessed May 2021)
35. Al-Hilali N, Al-Humoud HM, Ninan VT, Nampoory MR, Ali JH, Johny KV. Profiled
hemodialysis reduces intradialytic symptoms. Transplant Proc. 2004;36(6):1827–8.
36. Barbieri C, Cattinelli I, Neri L, Mari F, Ramos R, Brancaccio D, et al.
Development of an Artificial Intelligence Model to Guide the Management
of Blood Pressure, Fluid Volume, and Dialysis Dose in End-Stage Kidney
Disease Patients: Proof of Concept and First Clinical Assessment. Kidney Dis
(Basel). 2019;5(1):28–33.
37. Kriegeskorte N, Golan T. Neural network models and deep learning. Curr
Biol. 2019;29(7):R231-R6.
38. McIntyre CW. Effects of hemodialysis on cardiac function. Kidney Int. 2009;
76(4):371–5.
39. Eldehni MT, Odudu A, McIntyre CW. Brain white matter microstructure in
end-stage kidney disease, cognitive impairment, and circulatory stress.
Hemodial Int. 2019;23(3):356–65.
40. McIntyre C, Crowley L. Dying to Feel Better: The Central Role of Dialysis-
Induced Tissue Hypoxia. Clin J Am Soc Nephrol. 2016;11(4):549–51.
41. Flythe JE, Xue H, Lynch KE, Curhan GC, Brunelli SM. Association of mortality
risk with various definitions of intradialytic hypotension. J Am Soc Nephrol.
2015;26(3):724–34.You can also read