Q4 FY20 Supplemental Deck - December 22, 2020 1 - Mohegan Sun

Page created by Juan Francis
 
CONTINUE READING
Q4 FY20 Supplemental Deck - December 22, 2020 1 - Mohegan Sun
Q4 FY20 Supplemental Deck
      December 22, 2020

                            1
Q4 FY20 Supplemental Deck - December 22, 2020 1 - Mohegan Sun
Disclosures
This presentation contains “forward-looking statements” within the meaning of the Private Securities Litigation Reform Act of 1995, Section 27A of the Securities Act of 1933, as
amended, and Section 21E of the Securities Exchange Act of 1934, as amended. Certain statements contained in this presentation, including those that express a belief, expectation or
intention, as well as those that are not statements of historical fact, are forward-looking statements within the meaning of the federal securities laws and as such are based upon the
current beliefs of Mohegan Gaming & Entertainment (“MGE”, “we”, “us”, “our”, or the “Company”) as to the outcome and timing of future events. There can be no assurance that the
expectations, conclusions or beliefs expressed in any forward-looking statements will in fact occur. Examples of forward looking statements in this presentation include, but are not
limited to, statements regarding: (i) the earnings impact of our investments; (ii) improvements in our new business production; (iii) future M&A activity; (iv) global brand recognition;
(v) the leveraging of internal resources across divisions; (vi) our ability to stay in front of improvements in technology; (vii) growth drivers and expected levels of our organic growth;
(viii) our management team; (ix) our balance sheet; and (x) our return to shareholders.

 Forward-looking statements are generally identifiable by use of forward-looking terminology such as “may,” “will,” “should,” “potential,” “intend” “expect,” “seek,” “anticipate,”
“estimate,” “believe,” “could,” “project,” “predict,” “hypothetical,” “continue,” “future” or other similar words or expressions. All forward-looking statements included in this
presentation are based upon information available to the Company on the date hereof and the Company is under no duty to update any of the forward-looking statements after the date of
this presentation to conform these statements to actual results. The forward-looking statements involve a number of significant risks and uncertainties. Factors that could have a material
adverse effect on the Company’s operations and future prospects are set forth in the Company’s Annual Report on Form 10-K for the fiscal year ended September 30, 2019 including the
sections entitled “Risk Factors” contained therein. The factors set forth in the Risk Factors section and otherwise described in the Company’s filings with SEC could cause the
Company’s actual results to differ significantly from those contained in any forward-looking statement contained in this presentation. The Company does not guarantee that the
assumptions underlying such forward-looking statements are free from errors.

Should one or more of these risks or uncertainties occur, or should underlying assumptions prove incorrect, the Company’s business, financial condition, liquidity, cash flows and results
could differ materially from those expressed in any forward-looking statement. While forward-looking statements reflect our good faith beliefs, they are not guarantees of future
performance. Any forward-looking statement speaks only as of the date on which it is made. New risks and uncertainties arise over time, and it is not possible for us to predict the
occurrence of those matters or the manner in which they may affect us. We disclaim any obligation to publicly update or revise any forward-looking statement to reflect changes in
underlying assumptions or factors, of new information, data or methods, future events or other changes. Use caution in relying on past forward-looking statements, which were based on
results and trends at the time they were made, to anticipate future results or trends.

This presentation includes Adjusted EBITDA and other non-GAAP financial measures. The non-GAAP measures provided herein may not be directly comparable to similar measures
used by other companies in MGE's industry, as other companies may define such measures differently. The non-GAAP measures presented herein are not measurements of financial
performance under GAAP, and should not be considered as alternatives to, and should only be considered together with, MGE's financial results in accordance with GAAP. The
Authority does not consider these non-GAAP financial measures to be a substitute for, or superior to, the information provided by GAAP financial results.

                                                                                                                                                                                              2
Q4 FY20 Supplemental Deck - December 22, 2020 1 - Mohegan Sun
Quarterly Highlights

                       3
Q4 FY20 Supplemental Deck - December 22, 2020 1 - Mohegan Sun
MGE Q4 FY20 Financial Performance
                                                                                                                      Q4 Financial Performance
Mohegan Sun                                                                                                                    Quarter Ended          Quarter Ended
• YOY results reflect cost adjustments related to the COVID pandemic including                ($ in thousands)                  9/30/2020              9/30/2019         Year/Year Change
  significant changes to labor and marketing expenses much of which will be permanent         Mohegan Sun
                                                                                              Net Revenues                 $           211,814    $           249,928              (15.2%)
Mohegan Sun Pocono                                                                            Adjusted EBITDA                           80,113                 64,811               23.6%
• iGaming and Unibet Sportsbook continue to perform well, benefitting gaming revenues         EBITDA Margin                             37.8%                  25.9%                11.9%
  affected by COVID restrictions
• Additional marketing and labor reductions were instituted much of which will be             Mohegan Sun Pocono
  permanent                                                                                   Net Revenues                 $            55,592    $            63,629              (12.6%)
                                                                                              Adjusted EBITDA                           10,804                 11,759               (8.1%)
                                                                                              EBITDA Margin                             19.4%                  18.5%                 1.0%
MGE Niagara Resorts
• Property still closed due to providential COVID restrictions
                                                                                              MGE Niagara Resorts
• OLG paying service providers fixed service provider and capital fees during the             Net Revenues                 $            12,423    $            91,237                N.M.
  closure; and has deferred Fallsview rent during closure period to the end of the contract   Adjusted EBITDA                           (9,071)                10,191                N.M.
                                                                                              EBITDA Margin                             -73.0%                 11.2%                 N.M.
Management, Development and Other
• Continued growth in management fees at ilani despite wild fires, protests, and COVID        Management, Development and Other
  restrictions                                                                                Net Revenues                 $            13,177    $             9,961               32.3%
                                                                                              Adjusted EBITDA                            6,028                  4,806               25.4%
Corporate                                                                                     EBITDA Margin                             45.7%                  48.2%                (2.5%)
• The decline in Adjusted EBITDA was principally due to the impact of certain non-
  recurring payroll and consulting credits in the prior year                                  Corporate
                                                                                              Net Revenues                 $              303     $               20                 N.M.
                                                                                              Adjusted EBITDA                           (5,057)                (1,450)               N.M.
Total MGE
                                                                                              EBITDA Margin                              N.M.                    N.M                 N.M.
• Adjusted EBITDA increases attributed to reduced expenses at each property and as
  restrictions ease                                                                                       1
                                                                                              Total MGE
                                                                                              Net Revenues                 $           294,010    $           414,006              (29.0%)
                                                                                              Adjusted EBITDA                           82,785                 89,412               (7.4%)
                            1   Includes inter-segment results                                EBITDA Margin                             28.2%                  21.6%                 6.6%
                                                                                                                                                                                             5
Q4 FY20 Supplemental Deck - December 22, 2020 1 - Mohegan Sun
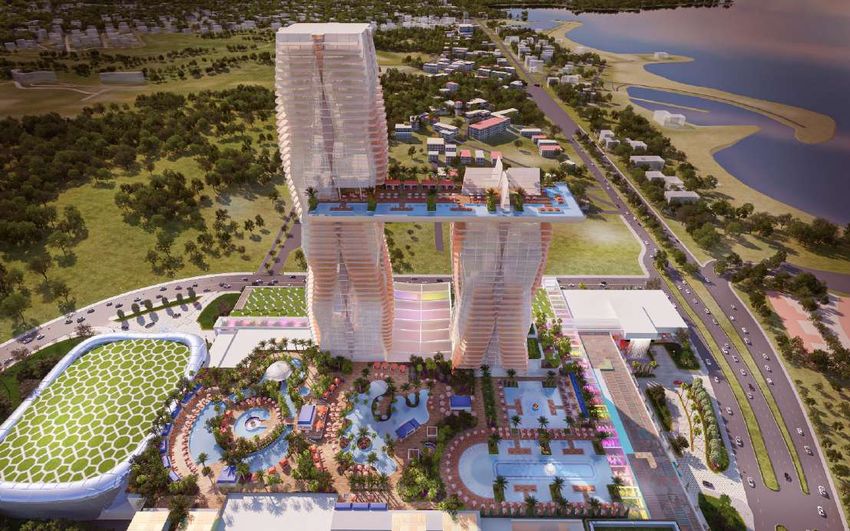
Quarterly Highlights – Management, Development and Other
Higher management fees from ilani and higher expenses due to ongoing development efforts

                                          For the Three Months Ended
 (in thousands)           September 30, 2020      September 30, 2019        Variance        Percentage Variance
 Net Revenues             $           13,177     $              9,961   $          3,216                 32.3%
 Income from Operations   $              (286) $                  820   $         (1,106)                 N.M.
 Adjusted EBITDA          $             6,028    $              4,806   $          1,222                 25.4%

  Net Revenues for the quarter ended September 30, 2020 reflects:
  • The increase is primarily driven by higher management fees from ilani, as a result of continued revenue
    and EBITDA growth at the property

  Adjusted EBITDA for the quarter ended September 30, 2020 reflects:
  • EBITDA performance also reflects higher expenses associated with ongoing domestic and international
    development efforts.

                                                                                                                  6
Q4 FY20 Supplemental Deck - December 22, 2020 1 - Mohegan Sun
Quarterly Highlights – MGE Corporate

                                         For the Three Months Ended
(in thousands)           September 30, 2020     September 30, 2019      Variance        Percentage Variance
Net Revenues             $              303     $               20  $            283                  N.M.
Loss from Operations     $           (5,079) $              (1,468) $         (3,611)                 N.M.
Adjusted EBITDA          $           (5,057) $              (1,450) $         (3,607)                 N.M.

Net Revenues for the quarter ended September 30, 2020 reflects:
• Increase in revenue attributable to IPro Play revenue

Adjusted EBITDA for the quarter ended September 30, 2020 reflects:
• The decline in Adjusted EBITDA was principally due to the impact of certain non-recurring payroll and
  consulting credits in the prior year

                                                                                                              7
Q4 FY20 Supplemental Deck - December 22, 2020 1 - Mohegan Sun
Bridge Summary for Normalized EBITDA
                                                                                 Adj for Normalized
($ in thousands)                                         Reported Results                              Normalized Results
                                                                                     Table Hold
                                                              4Q20
Net Revenues       Mohegan Sun                       $                211,814    $           13,114    $           224,928
                   Mohegan Sun Pocono                                  55,592                  (202)                55,390
                   MGE Niagara Casinos                                 12,423                   -                   12,423
                   Management, Development & Other                     13,177                   -                   13,177
                   Corporate                                              303                   -                      303
                   Inter-segment                                          701                   -                      701
                   Total                             $               294,010     $          12,912     $          306,922
EBITDA             Mohegan Sun                       $                 80,113    $           13,114    $            93,227
                   Mohegan Sun Pocono                                  10,804                  (123)                10,681
                   MGE Niagara Casinos                                 (9,071)                  -                   (9,071)
                   Management, Development & Other                      6,028                   -                    6,028
                   Corporate                                           (5,057)                  -                   (5,057)
                   Inter-segment                                          (32)                  -                      (32)
                   Total                             $                82,785     $          12,991     $           95,776
                   Margin %                                            28.2%                                        31.2%
                                                              4Q19
Net Revenues       Mohegan Sun                       $                249,928    $            8,606    $           258,534
                   Mohegan Sun Pocono                                  63,629                   473                 64,102
                   MGE Niagara Casinos                                 91,237                   -                   91,237
                   Management, Development & Other                      9,961                   -                    9,961
                   Corporate                                               20                   -                       20
                   Inter-segment                                         (769)                  -                     (769)
                   Total                             $               414,006     $           9,079     $          423,085
EBITDA             Mohegan Sun                       $                 64,811    $            8,606    $            73,417
                   Mohegan Sun Pocono                                  11,759                   359                 12,118
                   MGE Niagara Casinos                                 10,191                   -                   10,191
                   Management, Development & Other                      4,806                   -                    4,806
                   Corporate                                           (1,450)                  -                   (1,450)
                   Inter-segment                                         (705)                  -                     (705)
                   Total                             $                89,412     $           8,965     $           98,377
                   Margin %                                            21.6%                                        23.3%
                                                                                                                              8
Q4 FY20 Supplemental Deck - December 22, 2020 1 - Mohegan Sun
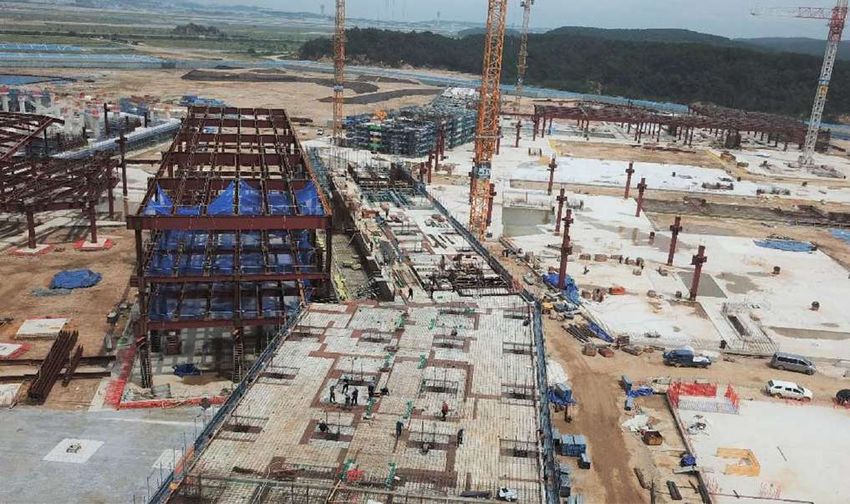
Quarterly Highlights – MGE Consolidated
                  Strong reopening despite COVID-19 restrictions and Niagara closure

                                                         Historical Net Revenues

($ in millions)

$500

                                                                                                   $91
$400                                                                                                     $85
                          $346     $357                  $343     $343                      $21
           $322   $330                    $328   $329                    $320
                                                                                $308                            $71
$300                                                                                                                               $12
                                                                                        $326      $323   $314
                                                                                                                                   $282
                                                                                                                                          MGE Niagara
$200                                                                                                            $243

                                                                                                                             $11
$100
                                                                                                                             $96

   $0
            Q1    Q2          Q3   Q4     Q1     Q2          Q3   Q4      Q1    Q2          Q3     Q4    Q1     Q2           Q3    Q4
                       FY17                           FY18                           FY19                             FY20

                                                                                                                                                    9
Q4 FY20 Supplemental Deck - December 22, 2020 1 - Mohegan Sun
MGE Total Leverage Ratio
                    MGE’s Debt to EBITDA ratio is inline with the US regional industry
                          operators average following the addition of Niagara
                                                       Total Restricted Debt / Covenant Adjusted EBITDA
6.50x
                                                                                                                                                               2Q-3Q Omitted due to
                                                                                                                                                               adjustments made in
                                                                                                                                                               response to COVID impact
6.00x
                                                                                                                                                           5.77x                          Calculation conforms
                                                                                                                                                                                5.56x     with Amendment No.
                                                                                                                                                                                          4 – allowing for the
5.50x                                                                                                                                                                                     substitution of months
                                                                                                                                             5.27x 5.32x
                                                    5.20x
                5.11x                                        5.02x
5.00x   4.93x                                                                                              4.95x
                        4.80x 4.78x
                                          4.75x                       4.77x                                         4.80x            4.73x
                                                                              4.65x      4.59x 4.63x                         4.61x
4.50x

4.00x

3.50x

           1 Restricted group leverage based on 2016 credit facility definition of total recourse debt/covenant adjusted EBITDA

                                                                                                                                                                                                             10
Quarterly
                            Quarterly Highlights
                                      Highlights –– Mohegan
                                                    Mohegan Sun
                                                            Sun
Gross Revenue declines from capacity restrictions and outlet closures minimized through expense controls
    Gaming
    • Gaming Revenue (Net) increased by $7.7M or 4.8% to prior year, driven by reduction in patron reinvestment
    • MSCT slot handle market share increased during the quarter from 54.3% to 60.2%
    • Table games gross hold was 16.9% compared to 18.0% last year
    • Table games revenue increased $8.3M, 20.5% compared to prior year, driven by reduced marketing expenses
    • Table Games were at 50% capacity and Slot machines at 61% capacity while the Poker Room was closed

    Non-Gaming
    • Food Revenue was down $10.6M, 69.8% compared to prior year, driven by outlet closures
    • Beverage Revenue was down $7.4M, 52.6% compared to prior year, driven by outlet closures
    • Non-Gaming revenues had an unfavorable variance of $45.8M or 49.8% YOY
    • The following F&B Outlets were closed: Seasons Buffet, Arrowhead Lounge, Feather Lounge, Aspire 33, and Imus.

                                                                                                                      12
Quarterly Highlights – Mohegan Sun
                                          Strategic expense control

Expense Control
• Total operating expenses of $149.3M compared to $206.4M in the prior year, representing a favorable variance
 of $57.1M or 27.7%
• Labor and Benefits had a favorable variance of $16.8M compared to prior year
• FTEs decreased by 1,990 or 38.8% compared to prior year, driving a $11.7M reduction to S&W
• Marketing expense impact to EBITDA of $7.8M with savings in expenses in all marketing areas

                                                                                                                 13
Quarterly Highlights – Mohegan Sun
                           Q4 below historical trend due to concentrated player wins in August
                                                                                      Historical Table Hold %

21%
                                                                                                                                                                                 June only2

20%

19%                                                                                                                                                                                       Historical Hold Trend 1

18%

17%

16%

15%

14%
      4Q14   1Q15   2Q15       3Q15   4Q15    1Q16    2Q16   3Q16       4Q16   1Q17   2Q17   3Q17   4Q17   1Q18   2Q18   3Q18   4Q18   1Q19   2Q19   3Q19   4Q19   1Q20   2Q20    3Q20    4Q20
                    1   Represents trend based on actual hold results
                    2   Represents June 2020 period only due to April and May 2020 closures                                                                                                                     14
Quarterly
                                  Quarterly Highlights
                                            Highlights –– Mohegan
                                                          Mohegan Sun
                                                                  Sun
                                                     For the Three Months Ended
(in thousands)                            September 30, 2020    September 30, 2019        Variance           Percentage Variance
Revenues:
Gaming                                    $           165,653   $           157,992   $              7,661                   4.8%
Food and beverage                                      11,278                29,290             (18,012)                  (61.5%)
Hotel                                                  17,728                22,449              (4,721)                  (21.0%)
Retail, entertainment and other                        17,155                40,197             (23,042)                  (57.3%)
 Net revenues                             $           211,814   $           249,928   $         (38,114)                  (15.2%)
Expenses:
Gaming                                    $            74,549   $            88,917   $         (14,368)                   (16.2%)
Food and beverage                                      10,257                22,754             (12,497)                   (54.9%)
Hotel                                                   8,258                 9,549              (1,291)                   (13.5%)
Retail, entertainment and other                         8,681                24,785             (16,104)                   (65.0%)
Advertising, general and administrative                29,956                39,112              (9,156)                   (23.4%)
Depreciation and amortization                          17,563                21,065              (3,502)                   (16.6%)
Other, net                                                 52                   258                (206)                   (79.8%)
 Total expenses                           $           149,316   $           206,440   $         (57,124)                   (27.7%)

Income from operations                    $            62,498   $            43,488   $          19,010                     43.7%

Adjusted EBITDA                           $            80,113   $            64,811   $          15,302                     23.6%

                                                                                                                                     15
Quarterly
                                     Quarterly Highlights
                                               Highlights –– Mohegan
                                                             Mohegan Sun
                                                                     Sun
                                                                      For the Three Months Ended
(in thousands)                                             September 30, 2020     September 30, 2019                                         Variance               Percentage Variance
Slots:
 Handle                                                    $                   1,537,960        $                  1,703,402        $               (165,442)                      (9.7%)
 Gross revenues                                            $                     133,346        $                    141,249        $                 (7,903)                      (5.6%)
 Net revenues                                              $                     115,801        $                    116,125        $                   (324)                      (0.3%)
 Free promotional slot plays ¹                             $                      10,957        $                     13,672        $                 (2,715)                     (19.9%)
 Weighted average number of machines (in units)                                    2,524                               4,102                          (1,578)                     (38.5%)
 Hold percentage (gross)                                                            9.4%                               9.1%                             0.3%                         3.3%
 Hold percentage (net)                                                              7.5%                               6.8%                             0.7%                        10.3%
 Win per unit per day (gross) (in dollars)                 $                         574        $                        374        $                     200                       53.4%
 Win per unit per day (net) (in dollars)                   $                         499        $                        308        $                     191                       62.1%
Table Games:
 Drop                                                      $                    440,030         $                    462,347        $                   (22,317)                   (4.8%)
 Gross revenues                                            $                     74,232         $                     83,170        $                    (8,938)                  (10.7%)
 Net revenues                                              $                     49,087         $                     40,745        $                      8,342                    20.5%
 Weighted average number of games (in units)                                        270                                   287                                (17)                  (6.0%)
 Hold percentage (gross) ²                                                        16.9%                                18.0%                              (1.1%)                   (6.2%)
 Hold percentage (net) ²                                                          11.2%                                 8.8%                                2.3%                    26.6%
 Win per unit per day (gross) (in dollars)                 $                      2,991         $                      3,149        $                       (158)                  (5.0%)
 Win per unit per day (net) (in dollars)                   $                      1,978         $                      1,542        $                        435                    28.2%
Poker:
 Net revenues                                              $                          -         $                        681        $                      (681)                 (100.0%)
 Weighted average number of tables (in units)                                         -                                   33                                (33)                 (100.0%)
 Win per unit per day (gross) (in dollars)                 $                          -         $                        671        $                      (671)                 (100.0%)
 Win per unit per day (net) (in dollars)                   $                          -         $                        224        $                      (224)                 (100.0%)
         1 Free promotional slot plays are included in slot handle but not reflected in slot revenues.
         2 Table game hold percentage is relatively predictable over longer periods of time but can significantly fluctuate over shorter periods.
                                                                                                                                                                                            16
Quarterly Highlights – Mohegan Sun

                                                    For the Three Months Ended
(in thousands)                              September 30, 2020    September 30, 2019        Variance              Percentage Variance
Food and beverage:
 Revenues                                   $            11,278   $            29,290   $          (18,012)                    (61.5%)
 Meals served                                               238                   980                 (742)                    (75.7%)
 Average price per meal served (in dollars) $             19.22   $             15.48   $             3.74                       24.2%

Hotel:
 Revenues                                   $            17,728   $            22,449   $               (4,721)                (21.0%)
 Rooms occupied                                             132                   141                       (9)                 (6.4%)
 Occupancy rate                                          91.9%                 98.1%                    (6.2%)                  (6.4%)
 Average daily room rate (in dollars)       $               115   $               141   $                  (26)                (18.3%)
 Revenue per available room (in dollars)    $               106   $               138   $                  (32)                (23.5%)

Retail, entertainment and other:
 Revenues                                    $           17,155   $            40,197   $              (23,042)                (57.3%)
 Arena events (in events)                                   -                      64                      (64)               (100.0%)
 Arena tickets                                              -                     409                     (409)               (100.0%)
 Average price per arena ticket (in dollars) $              -     $             64.57   $               (64.57)               (100.0%)
•    Segments have been impacted by capacity limitations relating to continued covid‐19 restrictions

                                                                                                                                         17
•   11 days of NCAA basketball featuring
    over 30 Division I college basketball
    teams and 40 games all at Mohegan Sun
    Arena

•   Provides a controlled environment with
    teams and event staff adhering to tribal,
    government, and NCAA health and safety
    protocols and testing requirements

                                                18
Bellator MMA returned to Mohegan Sun
Arena during the quarter with Bellator 242 –
246 all successfully hosted

Residency announced with SHOWTIME
Sports and Bellator MMA for Mohegan Sun
Arena to serve as a broadcasting center for
events

Mohegan Sun Arena will continue to host a
series of Premiere Boxing Champions and
Bellator MMA events under strict safety
protocols and no fans in attendance
Michael Jordan's 23 Sports Bar & Grille
renovations have been completed and the
restaurant has had a successful reopening
while following COVID safety
requirements

Tao Restaurant at Mohegan Sun planned
to open in Spring 2021

                                            20
Strategic Initiatives
                                    Responses to the Covid-19 Pandemic
Gaming:
   • Table Games remain at 50% capacity. Slot machines at 61% capacity. Poker Room remains closed
Non-gaming:
    • The following F&B Outlets remain closed: Seasons Buffet, Arrowhead Lounge, Feather Lounge, Aspire 33
      and Imus Coffee
    • All restaurants are capped at 50% capacity with a maximum of 8 people per table
Strategic Partnerships:
    • Residency with SHOWTIME Sports and Bellator MMA
Labor & Marketing:
    • Reduced labor expenses
    • Reduced marketing expenses driven by lack of entertainment and bus program spend
Keeping Property Fresh:
    • Remodel MJ 23 Sport bar
    • Tao Mohegan Sun, expected to open in early 2021

                                                                                                             21
FTEs by Fiscal Year – Since FY 2007
                        FTE reductions in response to covid-19 impact

8,000

7,000

6,000

5,000

4,000

3,000
        2007   2008    2009   2010   2011   2012   2013   2014   2015   2016   2017   2018   2019   2020
                                                                                                           22
Mohegan Gaming & Entertainment Properties
24
Quarterly Highlights – Mohegan Sun Pocono
   Marketing reductions; Online and Sportsbook performance offset revenue declines

• Net revenue declined $8.0M with gaming revenues down less than $1.0M due to reduced
  marketing expenses, helping minimize impact to net revenue

• Combined increases of $5.0M from iGaming and Sportsbook helped offset decline in slot and
  table revenues

• EBITDA decreased $955K or -8.1% compared to prior year due to decreases in both gaming
  and non gaming revenues while expense savings of $7.1M helped offset revenue losses

• Non-gaming revenues were down $7.0M compared to prior year with food and beverage
  accounting for a $4.5M decrease due to limited capacity of 50%

• There were 1,462 active slot machines, 60 table games, 5 poker tables, and 180 hotel rooms
  operating, representing a state mandated 50% of capacity

                                                                                               25
Quarterly Highlights – Mohegan Sun Pocono
                                                     For the Three Months Ended
(in thousands)                            September 30, 2020     September 30, 2019          Variance             Percentage Variance
Revenues:
Gaming                                    $            52,162    $            53,160     $               (998)                   (1.9%)
Food and beverage                                       1,309                  5,860                    (4,551)                 (77.7%)
Hotel                                                   1,093                  2,308                    (1,215)                 (52.6%)
Retail, entertainment and other                         1,028                  2,301                    (1,273)                 (55.3%)
 Net revenues                             $            55,592    $            63,629     $              (8,037)                 (12.6%)
Expenses:
Gaming                                    $            36,571    $            39,685     $              (3,114)                  (7.8%)
Food and beverage                                       1,390                  3,784                    (2,394)                 (63.3%)
Hotel                                                    495                     691                     (196)                  (28.4%)
Retail, entertainment and other                           69                     444                     (375)                  (84.5%)
Advertising, general and administrative                 6,263                  7,266                    (1,003)                 (13.8%)
Depreciation and amortization                           3,269                  3,473                     (204)                   (5.9%)
Other, net                                                (27)                39,549                (39,576)                   (100.0%)
 Total expenses                           $            48,030    $            94,892     $          (46,862)                    (49.4%)

Income from operations                    $             7,562    $            (31,263)   $              38,825                 (124.2%)

Adjusted EBITDA                           $            10,804    $            11,759     $               (955)                   (8.1%)

                                                                                                                                          26
Quarterly Highlights – Mohegan Sun Pocono
                                                                        For the Three Months Ended
(in thousands)                                             September 30, 2020                 September 30, 2019                        Variance                  Percentage Variance
Slots:
 Handle                                                    $                    455,340       $                   608,157       $                  (152,817)                   (25.1%)
 Gross revenues                                            $                     45,834       $                    61,652       $                   (15,818)                   (25.7%)
 Net revenues                                              $                     38,752       $                    45,077       $                    (6,325)                   (14.0%)
 Free promotional slot play ¹                              $                      6,181       $                    12,642       $                    (6,461)                   (51.1%)
 Weighted average number of machines (in units)                                   1,837                             2,277                              (440)                   (19.3%)
 Hold percentage (gross)                                                          10.1%                             10.1%                            (0.1%)                     (0.7%)
 Hold percentage (net)                                                             8.5%                              7.4%                              1.1%                      14.8%
 Win per unit per day (gross) (in dollars)                 $                        235       $                       234       $                         1                       0.4%
 Win per unit per day (net) (in dollars)                   $                        229       $                       215       $                        14                       6.5%
Table Games:
 Drop                                                      $                     37,776       $                    42,387       $                     (4,611)                  (10.9%)
 Gross revenues                                            $                      7,599       $                     8,310       $                       (711)                   (8.6%)
 Net revenues                                              $                      6,858       $                     5,451       $                      1,407                     25.8%
 Weighted average number of games (in units)                                         40                                57                                (17)                  (29.5%)
 Hold percentage (gross) ²                                                        20.1%                             19.6%                               0.5%                      2.6%
 Hold percentage (net) ²                                                          18.2%                             12.9%                               5.3%                     41.2%
 Win per unit per day (gross) (in dollars)                 $                      2,043       $                     1,593       $                        450                     28.2%
 Win per unit per day (net) (in dollars)                   $                      1,843       $                     1,044       $                        800                     76.6%
Poker:
 Net revenues                                              $                         -        $                        457      $                         (457)               (100.0%)
 Weighted average number of tables (in units)                                        -                                  18                                 (18)               (100.0%)
 Win per unit per day (gross) (in dollars)                 $                         -        $                        299      $                         (299)               (100.0%)
 Win per unit per day (net) (in dollars)                   $                         -        $                        276      $                         (276)               (100.0%)
               1 Free promotional slot plays are included in slot handle but not reflected in slot revenues.
               2 Table game hold percentage is relatively predictable over longer periods of time but can significantly fluctuate over shorter periods.
                                                                                                                                                                                         27
Quarterly Highlights – Mohegan Sun Pocono

                                                             For the Three Months Ended
(in thousands)                                 September 30, 2020            September 30, 2019               Variance         Percentage Variance
Food and beverage:
 Revenues                                      $                   1,309     $                    5,860   $          (4,551)                (77.7%)
 Meals served                                                         56                            152                 (96)                (63.2%)
 Average price per meal served (in dollars)    $                   12.95     $                    17.67   $           (4.72)                (26.7%)

Hotel:
 Revenues                                      $                   1,093     $                    2,308   $          (1,215)                (52.6%)
 Rooms occupied                                                       11                             19                  (8)                (40.9%)
 Occupancy rate                                                   69.1%                          85.8%              (16.7%)                 (19.5%)
 Average daily room rate (in dollars)          $                      89     $                      110   $             (21)                (19.0%)
 Revenue per available room (in dollars)       $                      61     $                       94   $             (33)                (35.0%)

Retail, entertainment and other:
 Revenues                                      $                   1,028     $                    2,301   $          (1,273)                (55.3%)
•   Segments have been impacted by capacity limitations relating to continued COVID‐19 restrictions

                                                                                                                                                      28
Quarterly
  Quarterly       Highlights
            Highlights           – Niagara
                       – Casino Niagara       Properties
                                        & Fallsview Casino Resort
                                    Property still closed due to COVID-19

• OLG continues to pay both the Fixed Service Provider Fee as                          For the Three Months Ended
                                                                   (in thousands)                             September 30, 2020
  well as Permitted Capital Expenditures while closed              Revenues:
                                                                   Gaming                                    $              12,190
• Fallsview rent payments have been deferred to the end of the
                                                                   Food and beverage                                           -
  initial lease term while closed                                  Hotel                                                       -
                                                                   Retail, entertainment and other                             233
• Negotiations with the OLG regarding a reopening plan are           Net revenues                            $              12,423
  under way and contemplate a novel approach in dealing with
  the fixed threshold payment structure while in a post-COVID      Expenses:
  environment.                                                     Gaming                                    $               3,555
                                                                   Food and beverage                                           855
• MGE receives pandemic-related governmental financial             Hotel                                                       214
  assistance in the forms of the ‘Canada Emergency Commercial      Retail, entertainment and other                              92
  Rent Assistance’ and the ‘Canada Emergency Wage Subsidy          Advertising, general and administrative                  16,778
                                                                   Depreciation and amortization                             5,356
• OLG will compensate MGE for NFEC lease expenses allowing         Other, net                                                   86
  the parties to continue to collaborate to manage the impact of    Total                                    $              26,936
  disputes, delays, and claims related to the NFEC project         Income from Operations                    $              (14,513)

                                                                   Adjusted EBITDA                           $               (9,071)

                                                                                                                                       30
31
Quarterly
                     Quarterly Highlights Highlights
                                          – ilani Casino Resort
                      ilani continues to perform well despite Covid-19 restrictions

• The property achieved record for net revenues and
                                                         Rendering of Recently Opened Garage and Planned Hotel Tower
  EBITDAM
• Net revenue and EBITDAM increased by 19.4% and
  35.8%, respectively, compared to prior year
• Management fees of $12.7 million for the quarter
  increased by $8.0 million, or 58.7%
• 1,832 or 70% of slot units active; and 61, or 81% of
  tables are active
• 2,700 space parking garage complete, subsequent to
  end of quarter.
• 14-story hotel expansion announced

                                                                                                                       32
33
Quarterly Highlights – Resorts Casino
            State mandated limitations and low consumer confidence impacted the region

• EBITDAM was $7.8M, down $1.6M compared to the prior year
  quarter. Decline attributed to state issued operating restrictions as well
  as reduced consumer confidence
• Gross gaming revenues were down $11.7M due to a slow return of
  players to the property as well as reduced incentive due to non gaming
  restrictions
• Marketing expenses declined $2.1M from prior year, mainly targeting
  loyal customers
• Operating costs and expenses totaled $30.8M, saving $9.5M compared
  to prior year’s total of $40.2M

                                                                                         34
35
Quarterly Highlights – Paragon Casino Resort
           Positive performance due to minimal impact from storms and consumer confidence

• The property experienced gaming revenue (net) growth of 5.9%
  compared to prior year
• Positive shifts within gaming visits as competition closed for
  extended periods of time due to the effects of Hurricane Laura
• High hotel revenue as a result of housing hurricane responders
  and evacuees during multiple storms throughout September
• Entire slot floor remains open and table games are limited to 3
  seats per table
• Amount of trips has remained stable since reopening and despite
  the reduction of stimulus funds

                                                                                            36
Property Status
COVID related capacity restrictions remain in effect, with two properties closed, until the new year
                                                                         GAMING
                              Closed          Reopened         Initial restrictions                       Restrictions as of 9/30
     Mohegan Sun CT           3/17/2020       6/1/2020         50% Capacity                               TG 50%. Slots 61%
     Mohegan Sun Pocono       3/16/2020       6/22/2020        50% Capacity                               50% of fire code
     Resorts                  3/16/2020       7/2/2020         25% Occupancy. 50% Slots. 3-8 ppl/table    25% Occupancy
     Paragon                  3/17/2020       5/20/2020        50% Occupancy. 75% Capacity                100% Slots. 3 ppl/table
     ilani                    3/16/2020       5/28/2020                                                   70% slots, 81% tables
     Niagara Casinos          3/16/2020       -

                                                                       Non-Gaming
                              Closed              Reopened     Initial restrictions        Restrictions as of 9/30
     Mohegan Sun CT           3/17/2020           6/1/2020     Carry out only then 50%     50% Capacity. 8 ppl/table. Closed at 10 PM

     Mohegan Sun Pocono       3/16/2020       6/22/2020        50% of fire code            50% Capacity and 50% of restaurants open. Closed at 10 PM
     Resorts                  3/16/2020           7/2/2020     Outdoor only                25% Capacity
     Paragon                  3/17/2020           5/20/2020    50% Capacity                50% Capacity
     ilani                    3/16/2020           5/28/2020    Seating slightly reduced    Seating slightly reduced
     Niagara Casinos          3/16/2020           -

               1.      Mohegan Pocono closed again on December 12th, with reopening subject to state mandate
               2.      MGE Niagara Casinos have been closed since 3/16/20 and will likely remain closed until early Spring
                                                                                                                                                       37
Fiscal 1Q21 Update

                     38
Fiscal 1Q21 Update
  Second wave of covid-19 infections is impacting near-term performance and development timeline
Gaming:
    • Recent steep increases in COVID-19 infections in all of our markets globally has resulted in temporary weakness in
      business volumes at our operations
Non-gaming:
    • With the moderation in gaming demand, have experienced a commensurate decline in non-gaming demand, including
      lower hotel occupancy. On November 4th State of CT mandated reduced operating hours for restaurant and bars
Labor & Marketing:
    • MGE has reinstituted payroll reductions, with an across the board 20% reduction in compensation, via mandatory
      hour reduction
    • Continue to benefit from reduced marketing expenses, though lower revenue reduce overall margin impact
Development Impact:
    • Increased in infection rate globally, has slowed progress in both the construction of Inspire Korea and in the re-
      opening of the MGE Niagara Resorts and the Mohegan Sun Casino in Las Vegas.

  Looking beyond the virus, we remain positive as our business has been optimized to benefit from what we
  foresee to be significant pent-up demand for leisure consumption in the months and years ahead.

                                                                                                                           39
Development Updates
Hotel                                        MICE                    Casino                 Arena          Retail . F&B .
5-star hotel towers   Meeting & conference facilities    150 tables, 700 slots          15,000+ seat      Entertainment
with 1,248 rooms       with Seoul’s largest ballroom    and electronic games     entertainment arena   Luxury shopping mall
Market Highlights
• INSPIRE to be Korea and Northeast Asia’s first
  true Integrated Entertainment Resort
• Ideally positioned within Korea and Northeast
  Asia to capture growing tourism flows
• Broad appeal to both domestic and foreign visitors

• Partnership with Incheon Airport provides unique
  support and competitiveness with 70M annual
  visitors

                               Project Timeline

• Close Financing Early 2021
• Early 2023 Integrated Resort slated to open

                                                       443
ARENA

                                                                                               POOL
                                                                                               DOME
                                                                                   RETAIL                 RETAIL

                                                                                       HOTEL           HOTEL                         HOTEL

                                                                                                                CASINO       CONF.

                                                                                                      PARKING

                                                                              LAYOUT PLAN

                                                                     ARENA
              RETAIL   POOL DOME
BOUT. HOTEL                                  CASINO HOTEL                    CONF. HOTEL

                                                            CASINO                          CONFERENCE
                                   PARKING
POOL DOME                                 ARENA
                 PHASE 1 (COMPLETION IN 2022)
                 PHASE 2 (COMPLETION IN 2025)
                 PHASE 3 (PLANNING IN PROGRESS)
                 PHASE 4 (PLANNING IN PROGRESS)

BOUTIQUE HOTEL                            CASINO/RETAIL PODIUM
     TP1
   704,915㎡

                                                                 45
PHASE 1A 2022
                                              PHASE 1 (COMPLETION IN 2022)
                                                          PHASE 1B 2025
                                              PHASE 2 (COMPLETION IN 2025)
                                                          PHASE 2
                                              PHASE 3 (PLANNING IN PROGRESS)   A Multi-Phased Project
                                                          PHASE 3
PHASE 2          PHASE
                   1B
                                              PHASE 4 (PLANNING IN PROGRESS)   with Vast Site Area for Scalability
                                                          PHASE 4

                                                                               • Phase 1A includes a foreigner-only casino, 5-
                                                                                 star resort with over 1,248 rooms, suites, and
                                 PHASE
                                   1A                                            villas, large-scale and unique F&B, retail and
    PHASE 2                                              PHASE 2
                                                                                 entertainment offerings, a 15,000-seat indoor
                                                                                 arena, and large meeting/convention facility

        TP1               PHASE 2                                              • A true destination resort, with a comprehensive
      704,915㎡                                                                   set of family-based entertainment offerings to
                                                           PHASE 3
                                         PHASE 4
                                                                                 attract and offer an unparalleled experience to
                                                                                 both foreign and domestic Korean visitors
                            PHASE 4       PHASE 4

                         PHASE 3 PHASE     PHASE 3
                                   3
                                                                   PHASE 3
                                                                                                                                   46
Covid-related precautions currently in effect; opening
anticipated in early 2021:

• Casino construction and pre-opening investment remain
  on-time and on-budget
• Highly strategic fit for Mohegan’s enterprise-wide
  Momentum loyalty platform
• Native America’s first brand presence in the Las Vegas
  Strip Corridor
• More than 300 veteran resort team members readying for
  recall to join Mohegan Sun Casino Las Vegas

Reimagined and repositioned resort includes:

• Branding by Virgin Hotels and Hilton’s Curio Collection
• Casino offering up to 650 slots and 60 table games
• Newly introduced Aspire private gaming salon
• Sportsbook to be operated by Betfred Sports USA
• Extensive line-up of world-class restaurants, lounges and
  bars
• Showroom and entertainment managed by AEG Presents
•   MGE has partnered with GEK TERNA, 35% equity
    partner, to form Inspire Athens S.A.
•   In October 2020, Inspire Athens was awarded the
    conditional gaming license for Hellinikon Athens
    project.
•   Inspire Athens expects to formally received the
    concession in Spring of 2021.
•   Construction to begin in 2022 with opening in 2025

                                                     50
Capitalization Summary

                         51
Q4 FY20 Current Debt Summary
MGE and Mohegan Tribe remain committed to deleveraging while strategically diversifying
      (in thousands)                           9/30/2020        Coupon/Spread      Maturity     Rating
                                                                                                         1

      Credit Facility - Revolving            $       197,000   L(0.75%) + 3.75%    10/13/21        -
      Credit Facility - Term Loan A                  231,909   L(1.00%) + 6.125%   10/13/21    Caa1/CCC+
      Credit Facility - Term Loan B                  813,638   L(1.00%) + 6.375%   10/13/23    Caa1/CCC+
      Mohegan Expo Credit Facility                    28,408      L + 4.50%         4/1/22         -
      Other                                            4,152           -               -           -
      Total Restricted Senior Secured Debt         1,275,107

      2016 7 7/8% Senior Unsecured Notes             500,000        7.875%         10/15/24     Ca/CCC
      BIA Loans                                       30,406      L + 2.75%         10/1/23        -
      Line of Credit                         -                    L + 3.25%        10/13/21        -
      Other                                            7,520
      Total Restricted Debt                        1,813,033

      Redemption Note Payable                         84,800           -           4/1/2024        -
      Niagara Credit Facility                         96,331      BA +2.75%        6/10/2024       -
      Niagara Convertible Debenture                   29,928        3.50%          4/30/2040       -
      Niagara Capital Leases                          27,872           -               -           -
      Other                                              325
      Total Debt                             $     2,052,289
         1
             Corporate Rating: Caa2
                                                                                                             52
You can also read