Q1 FY22 Earnings Presentation - Advancing the world of health TM - BD
←
→
Page content transcription
If your browser does not render page correctly, please read the page content below

Q1 FY22
Earnings Presentation
February 3, 2022

                        Advancing the
                                       TM
                        world of health
Caution Concerning Forward-Looking Statements
This presentation contains certain estimates and other forward-looking statements (as defined under Federal securities laws) regarding BD’s future prospects and performance, including, but not limited to,
future revenues, margins, and earnings per share, leverage targets, capital deployment, and the proposed spinoff of the diabetes care business. All such statements are based upon current expectations of BD
and involve a number of business risks and uncertainties. Actual results could vary materially from anticipated results described, implied or projected in any forward-looking statement. For a discussion of
certain factors that could cause our actual results to differ from our expectations in any forward-looking statements see our latest Annual Report on Form 10-K and other filings with the Securities and
Exchange Commission. BD expressly disclaims any undertaking to update or revise any forward-looking statements set forth herein to reflect events or circumstances after the date hereof, except as required
by applicable laws or regulations. The guidance in this presentation is only effective as of the date given, February 3, 2022, and will not be updated or affirmed unless and until we publicly announce updated
or affirmed guidance.

Caution Concerning Non-GAAP Financial Measures
To supplement financial measures prepared in accordance with generally accepted accounting principles in the United States. ("GAAP"), we use financial measures not prepared in accordance with GAAP,
including base business margins, base revenue, adjusted earnings per share, adjusted gross margin, adjusted operating margin, free cash flow, free cash flow conversion and net leverage. BD management
believes that the use of non-GAAP measures to adjust for items that are considered by management to be outside of BD’s underlying operational results or that affect period to period comparability helps
investors to gain a better understanding of our performance year-over-year, to analyze underlying trends in our businesses, to analyze our base operating results, and understand future prospects.
Management uses these non-GAAP financial measures to measure and forecast the company’s performance, especially when comparing such results to previous periods or forecasts. We believe presenting
such adjusted metrics provides investors with greater transparency to the information used by BD management for its operational decision-making and for comparison for other companies within the
medical technology industry. Although BD’s management believes non-GAAP results are useful in evaluating the performance of its business, its reliance on these measures is limited since items excluded
from such measures may have a material impact on BD’s net income, earnings per share or cash flows calculated in accordance with GAAP. Therefore, management typically uses non-GAAP results in
conjunction with GAAP results to address these limitations. BD strongly encourages investors to review its consolidated financial statements and publicly filed reports in their entirety and cautions investors
that the non-GAAP measures used by BD may differ from similar measures used by other companies, even when similar terms are used to identify such measures. Non-GAAP measures should not be
considered replacements for, and should be read together with, the most comparable GAAP financial measures.

Reconciliations of these and other non-GAAP measures to the comparable GAAP measures are included in the financial tables at the end of this presentation and in our February 3, 2022, earnings press
release. Within these financial tables, certain columns and rows may not add due to the use of rounded numbers. Percentages and earnings per share amounts presented are calculated from the underlying
amounts. Current and prior-year adjusted earnings per share results exclude, among other things, the impact of purchase accounting adjustments, integration and restructuring costs, spin-off related charges,
certain transaction gains and losses, certain legal defense and product remediation costs, certain regulatory costs, certain investment gains, the impact of the extinguishment of debt and the dilutive impact
of outstanding preferred stock.

We also provide these measures, as well as revenues, on a currency-neutral basis after eliminating the effect of foreign currency translation, where applicable. We calculate foreign currency-neutral
percentages by converting our current-period local currency financial results using the prior period foreign currency exchange rates and comparing these adjusted amounts to our current-period results.
Reconciliations of these amounts to the most directly comparable GAAP measures are included in the financial tables at the end of this presentation and in our February 3, 2022 earnings press release.

                      Q1 FY’22 EARNINGS PRESENTATION   FEBRUARY 3, 2022                                                                                                                                            2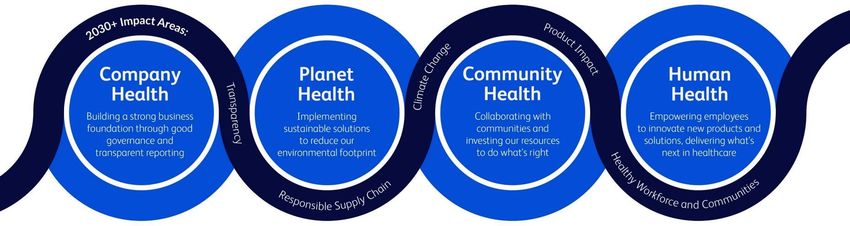
Executive Summary
Table of                                              Financial Highlights

Contents                                              Guidance
                                                      Appendix

  Q1 FY’22 EARNINGS PRESENTATION   FEBRUARY 3, 2022                          3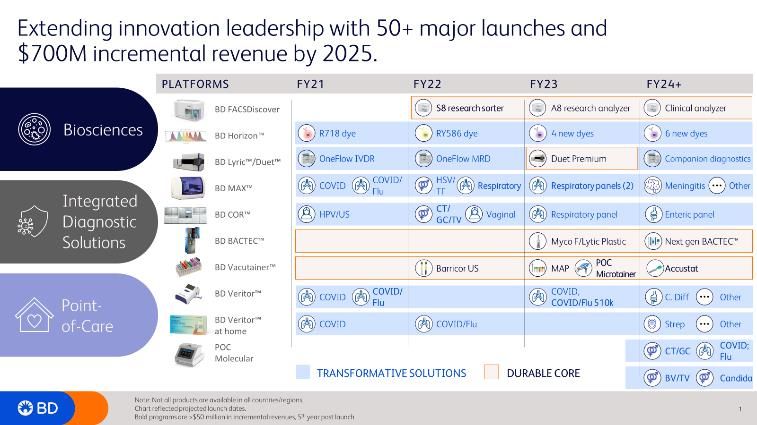
“Our first quarter results reflect
                                                      continued execution of our BD2025

Executive                                               strategy and strong base business
                                                               performance from all three

Summary                                                                           segments”

                                                                                     Tom Polen
                                                                  BD Chairman, CEO and President

  Q1 FY’22 EARNINGS PRESENTATION   FEBRUARY 3, 2022                                                4
Key highlights
✓ Uniquely positioned to deliver value during
  uncertain times
✓ Solid demand for broad portfolio and new
  products
✓ Strong execution delivering enhanced margin
  profile despite inflationary environment
✓ Cash flow fueling investments in R&D and tuck-
  in M&A strategy
✓ Increasing revenue and EPS guidance on strong
  results despite continued market uncertainty

         Q1 FY’22 EARNINGS PRESENTATION   FEBRUARY 3, 2022   5
Q1 FY22 financial summary

                Revenue                                                        Adjusted EPS                         Operating cash flow
                $5.0B                                                                  $3.64                             $0.7B
                    (5.9%) FXN                                          compared to $4.55 in Q1 FY21

                   +8.3% FXN growth
Base revenue:(1)
                   +7.8% Organic FXN growth(1)

        Covid Dx revenue of ~$185M
      ✓ Strong base business growth of 8.3% driven by performance across all three segments
      ✓ Experienced higher demand than expected for professional and at-home COVID testing
           ✓ COVID-only testing revenues of $185 million compared to $866 million in Q1 FY21
      ✓ Adjusted EPS ahead of expectations driven by profitable growth and good progress in strategic margin
        improvement initiatives
      ✓ Continued strong cash flow generation with a tough comparison to the prior year due to the year-over-
        year decline in COVID-only testing revenues
                                                                 (1)See Basis of Presentation on Slide 27
             Q1 FY’22 EARNINGS PRESENTATION   FEBRUARY 3, 2022                                                                            6
                                                                 Please see appendix for non-GAAP reconciliation.
Continue to progress our innovation-driven growth strategy

                                                                                                                                      BD COR™ MX: Received CE Mark for infectious disease
                                                                       BD Kiestra™ IdentifA: Received 510(k) clearance from
                                                                                                                                      testing and is the final module introduced onto the BD
                                                                       the U.S. FDA. Designed to fully automate and
                                                                                                                                      COR™ System, expanding fully-automated high-
                                                                       integrate the preparation of microbiology bacterial
                                                                                                                                      throughput molecular testing for core labs
                                                                       identification testing using smart connected robotics

New BD innovation in flow cytometry: Profiled in cover
story of January issue of Science magazine,
                                                                                                                               BD Veritor™ At-Home COVID-19 Test: New distribution
demonstrating landmark advancement in flow cytometry
                                                                                                                               and retail partners announced
technology with potential to transform a wide range of
disciplines from immunology and genomics research to
cell-based therapeutics

                   Q1 FY’22 EARNINGS PRESENTATION   FEBRUARY 3, 2022                                                                                                                           7
Robust innovation pipeline fueling >100 product launches through FY25

                                                           Note: Products not authorized for marketing in all countries/regions. Chart reflected projected launch dates.
       Q1 FY’22 EARNINGS PRESENTATION   FEBRUARY 3, 2022   Bold programs for the Medical Segment are >$75 million in incremental revenues, 5th year post launch.                             8
                                                           Bold programs for the Life Sciences and Interventional Segments are >$50 million in incremental revenues, 5th year post launch.
                                                           Full slides can be found on pages 32, 52 and 70 of the November 2021 Investor Day presentation.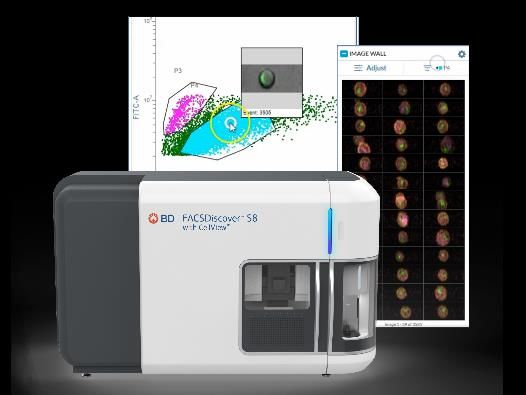
Progressing pipeline and key launches in support of BD2025 strategy
                  BD Medical                                                     BD Life Sciences                                  BD Interventional

    Pyxis ES version 1.7 software:                                          BD FACSDiscover S8:                             Trek Bone Biopsy Device:
    adds enhanced automation and controlled                          a landmark advancement in flow cytometry            provides interventional radiologists with an
substance management via improved connectivity                    technology that has the potential to transform a     easier and faster way to perform bone biopsies
  with our CIISafe offering and enables deeper                     wide range of disciplines from immunology and        without the need to use multiple devices, thus
   integration of pharmacy and nursing areas.                     genomics research to cell-based therapeutics. For     reducing cost per procedure, inventory needs
                                                                    the first time, we can sort cells at high speed,                 and procedure time.
                                                                        while separating cells not only on which
                                                                   antibodies or other markers we can see, but also
                                                                         based on new imaging parameters.

              Q1 FY’22 EARNINGS PRESENTATION   FEBRUARY 3, 2022                                                                                                      9
Together We Advance: driving outcomes across all four pillars of health

        Q1 FY’22 EARNINGS PRESENTATION   FEBRUARY 3, 2022                 10
“Our Q1 results demonstrate the
strength of our business and the
Financial momentum of our strategy. We are
systematically enhancing our growth
profile through portfolio and
Highlights investment actions while also
executing on margin improvement
and inflationary mitigation programs.”
Chris DelOrefice
CFO
Q1 FY’22 EARNINGS PRESENTATION FEBRUARY 3, 2022 11Q1 FY22 revenue summary – by segment and geography
Revenue by segment Revenue by geography
United States
57%
Total BD
BD Medical
$2,397M
+6.0% FXN
$4,995M
(5.9%) FXN
Base revenues BD Life Sciences
$1,483M
$4,811M (24.8%) FXN
+8.3% FXN Base revenues
+7.8% Organic FXN $1,299M International
+17.2% FXN 43%
BD Interventional
$1,115M COVID-19 Dx revenue
+3.8% FXN ~$185M
Q1 FY’22 EARNINGS PRESENTATION FEBRUARY 3, 2022 Please see Basis of Presentation on slide 27 and Appendix for non-GAAP reconciliations 12Q1 FY22 revenue summary – by business unit
BD Medical BD Life Sciences BD Interventional
BDB
$338M Surgery
MMS PI
+9.0% FXN $361M
MDS $627M $413M
+8.9% FXN
$1,084M (0.5%) FXN (3.1%) FXN
+7.3% FXN
$1,483M
$2,397M (24.8%) FXN
Base revenues
$1,115M
+6.0% FXN +3.8% FXN
+5.5% Organic FXN $1,299M +2.9% Organic FXN
+17.2% FXN,
all organic
DC IDS
$289M $1,145M
(31.1%) FXN UCC
PS +1.6% FXN $340M
COVID-19 Dx revenue Base revenues
$397M +7.7% FXN
~$185M $960M
+17.9% FXN
+20.3% FXN
Q1 FY’22 EARNINGS PRESENTATION FEBRUARY 3, 2022 Please see Basis of Presentation on slide 27 and Appendix for non-GAAP reconciliations 13BD Medical: Continued strength in Pharmaceutical Systems and
Medication Delivery Solutions
Business Unit Q1 FY22 BD Management Q1 Commentary
Medication $1,084M • Competitive gains in catheters and vascular care reflecting momentum in our
Delivery Solutions +7.3% FXN comprehensive vascular access management strategy and early traction of our
one-stick hospital stay strategy
• Appropriate price management during a heightened inflationary cost
environment
Medication $627M • As expected, modest decline due to higher COVID-related demand for infusion
Management (0.5%) FXN pumps in prior year, especially in the U.S. and Europe
Solutions • Continued customer adoption of our Connected Medication Management
strategy evidenced by momentum in Dispensing worldwide
Diabetes Care $289M • Growth reflects continued category leadership, aided by some timing of orders
+1.6% FXN
Pharmaceutical $397M • Demand strength supported by ongoing capacity expansion and supply
Systems +17.9% FXN reliability, powering double-digit growth in pre-fillable syringes
• Expansion of services through recent acquisition of ZebraSci
BD Medical $2,397M
+6.0% FXN
+5.5% Organic FXN
Q1 FY’22 EARNINGS PRESENTATION FEBRUARY 3, 2022 Please see Basis of Presentation on slide 27 and Appendix for non-GAAP reconciliations 14BD Life Sciences: Strong base business performance with tough comparison
from COVID diagnostic testing
Business Unit Q1 FY22 BD Management Q1 Commentary
Integrated $1,145M • Strong base business growth driven by improved lab utilization, price related
Diagnostic (31.1%) FXN initiatives, and new products including a new to market flu/COVID combination test
Solutions for BD Veritor™ and BD Max™.
+20.3% FXN • One-time licensing revenue contributed ~600 bps to base revenue growth
(ex-COVID only testing)
• COVID-19 diagnostic revenues of ~$185 million
Biosciences $338M • Strong demand for research reagents and instruments as a result of lab utilization
+9.0% FXN returning to normal levels, continued research on COVID variant and increasing
traction from recently launched e-commerce channel
• Strong momentum from new products, including our first spectral analyzer
BD Life Sciences $1,483M
(24.8%) FXN
+17.2% FXN
(ex-COVID only testing)
Q1 FY’22 EARNINGS PRESENTATION FEBRUARY 3, 2022 Please see Basis of Presentation on slide 27 and Appendix for non-GAAP reconciliations 15BD Interventional: Year-over-year recovery in deferrable procedures and
continued strength in Urology & Critical Care
Business Unit Q1 FY22 BD Management Q1 Commentary
Surgery $361M • Double digit growth in Advanced Reconstruction and Repair driven by deferrable
+8.9% FXN procedure recovery and the recent acquisition of Tepha
• Strong Biosurgery and Infection Prevention growth driven by deferrable
procedure recovery in US & EMEA
Peripheral $413M • Decline driven by FY21 product recall, supplier disruption and planned product
Intervention (3.1%) FXN line discontinuations to support portfolio simplification and margin
enhancement strategy
• Partially offset by growth in biopsy & atherectomy platforms coupled with the
Venclose acquisition that expands our focus on chronic disease outcomes across
care settings
Urology and $340M • Sustained demand for chronic female incontinence with PureWick™ in the acute
Critical Care +7.7% FXN care & alternative care settings and backorder recovery in Acute Urology
• Solid TTM performance with our new smart-connected-care enabled Arctic Sun
platform
BD Interventional $1,115M
+3.8% FXN
+2.9% Organic FXN
Q1 FY’22 EARNINGS PRESENTATION FEBRUARY 3, 2022 Please see Basis of Presentation on slide 27 and Appendix for non-GAAP reconciliations 16Solid growth of our base business
(Adjusted) Reported FXN
$ in millions Q1 FY22 Q1 FY21 Y/Y ∆ Y/Y ∆ P&L Highlights
Revenues $4,995 $5,315 (6.0%) (5.9%)
Base revenue $4,811 $4,450 8.1% 8.3% • Revenue: Strong base growth of 8.3% FXN
Gross Profit $2,791 $3,096 (9.8%) (10.5%)
Gross margin 55.9% 58.2% (230 bps) (280 bps)
driven by execution across all three segments
Base gross margin 55.4% 55.5% (10 bps) (60 bps)
SSG&A $1,215 $1,147 +5.9% +6.1%
• Margins:
% of revenues 24.3% 21.6% +270 bps +270 bps
R&D $308 $268 +15.2% +15.4%
• Base gross and operating margins ahead
% of revenues 6.2% 5.0% +120 bps +120 bps of expectations with sequential
Other Operating (Inc) exp, net ($4) $0 N/A N/A improvement
Operating Income $1,271 $1,680 (24.4%) (25.7%)
Base operating income $1,169 $1,112 5.1% 3.1% • Year-over-year decline primarily driven by
Operating margin 25.4% 31.6% (620 bps) (660bps)
Base operating margin 24.3% 25.0% (70 bps) (120 bps)
increased investment in R&D and above-
Interest Income (exp), net ($97) ($118) (18.0%) (17.8%) normal inflation, partially offset by
Other Income (exp), net $26 $30 (15.9%) (11.4%) improved mfg. utilization, margin
Tax Rate 11.1% 14.6% (350bps) N/A
improvement initiatives and FX
Net Income $1,066 $1,360 (21.6%) (23.0%)
Preferred Dividend $23 $23
• Tax: Driven by timing of discrete items as
Net Income Applicable to Common Shareholders $1,044 $1,338
Avg diluted common shares(1) 287 299 anticipated
Adjusted EPS $3.64 $4.55 (20.0%) (21.5%)
(1) In
Q1FY22, the preferred shares are anti-dilutive. Therefore, the adjusted non-GAAP EPS is calculated using net income to common Please see Basis of Presentation on slide 27
FEBRUARY 3, 2022 (preferred dividends are included) while the diluted share count excludes the conversion of the preferred shares in the calculation. In
Q1 FY’22 EARNINGS PRESENTATION Q1FY21, the preferred shares are dilutive. Therefore, the adjusted non-GAAP EPS is calculated using net income (preferred dividends are
Commentary refers to FXN Y/Y basis unless specified 17
excluded) while the diluted share count includes the conversion of the preferred shares in the calculation. Please see Appendix for non-GAAP reconciliationsDisciplined capital allocation policy supported by strong cash flows
Purposeful and balance investments help fuel our robust pipeline
R&D / Capex
~6% ~60% ~$1B ~80% $ in billions Q1 YTD
R&D target R&D spend Targeted annual Strategically (4)
as a % of directed towards capex spend deployed on value R&D $0.3
sales transformative creating programs (2)
Solutions (1)
Capex $0.2
New lever for accelerating our strategy with meaningful capital deployment
through our strengthened balance sheet M&A $0.4
Tuck-in M&A ~$2Bper year
16
Transactions
>$1.3B capital
~80%
directed towards
Dividends $0.3
available to closed since deployed transformative
deploy (3) FY20 since FY20 Solutions (1) OCF $0.7
Committed to increasing the dividend and returning cash to shareholders
Cash balance $1.9
through share repurchase program
Dividend / As of 12/31/2021
Share 50 years ~30% Income statement Cash flow Balance sheet
Repurchase annual dividend Target
increases payout
Ratio (3)
(1) Refer to slide 21 of the November 2021 Investor Day presentation.
(2) Refer to slide 89 of the November 2021 Investor Day presentation.
Q1 FY’22 EARNINGS PRESENTATION FEBRUARY 3, 2022 Please see Basis of Presentation on slide 27 18
(3) Refer to slide 86 of the November 2021 Investor Day presentation.
(4) As adjusted. Please see slide 33 for non-GAAP reconciliationsGuidance Q1 FY’22 EARNINGS PRESENTATION FEBRUARY 3, 2022 19
FY22 assumptions and considerations
  Macro considerations:
  • Continued easing of COVID-19 restrictions                                                              • Base business revenue includes our combination flu/COVID assays
  • No extended major system-wide hospital restrictions on deferrable                                      • Anticipate a “normal” to “light” flu season
    procedures                                                                                             • Does not assume legislation changes that would impact the broader
  • Expect continued inflationary and supply chain pressure with some                                        market
    stabilization by the end of the year. Guidance does not contemplate a
    more significant step increase in market disruption.
                        Medical                                                              Life Sciences                                                                    Interventional
  • Continue to extend our leadership position                    • Leadership positions in attractive and growing                                  • Continuing strategy to evolve from product to
    with competitive gains in vascular access and                   categories                                                                        category leadership in chronic disease
    care and pre-filled injectables                               • Investing in higher growth spaces by enabling                                     treatment while continuing to invest in
  • Investing in solutions transforming healthcare                  smart automated laboratory workflows,                                             accretive high-growth spaces
    through smart connected care and new care                       improving chronic disease treatment with                                        • Investing in organic and inorganic portfolio
    settings                                                        clinically differentiated assays, research tools                                  offerings, expanded labeling and increasing
  • FY22 BD Medical revenue growth expected to                      and companion diagnostics, and migrating                                          non-acute care presence
    be slightly below BDX guidance (1)                              point of care to new care settings                                              • FY22 BD Interventional revenue growth
    • Alaris capital revenue generally in-line with               • FY22 BD Life Sciences revenue growth                                              expected to be slightly above BDX guidance (1)
      FY21                                                          expected to be slightly above BDX guidance (1)

    • Alaris 510(k) FDA clearance not expected in
      FY22

                                                                  (1)
                                                                    Compared to BDX base revenue growth guidance of 5.75% to 6.75% (see slide 21). Please see Basis of Presentation on slide 27.
              Q1 FY’22 EARNINGS PRESENTATION   FEBRUARY 3, 2022   Note: This guidance is only effective as of the date given, February 3, 2022, and will not be updated or affirmed unless and until we   20
                                                                  publicly announce updated or affirmed guidance.
FY22 guidance summary
February 3, 2022 November 4, 2021 Comments
•Increased outlook on strong Q1 results and contribution
Base revenue growth (FXN) 5.75% to 6.75% 5% to 6%
from Q1 acquisitions
COVID only testing(1) revenue ~$450M ~$200M • Increased due to higher testing demand
Estimated FX impact ~(125 bps) ~(50 bps) • Based on current spot rates and currency mix
Estimated total company
$19.55B to $19.75B $19.3B to $19.5B • Compared to $20.2B in FY21
reported revenue
• Compared to base operating margin in FY21 of 21.7% (2)
Base operating margin ~200 bps improvement ~200 bps improvement • Covid-only testing operating margin expected to be
modestly above base BDX average
~$50M to ~$75M • Primarily driven by debt refinancing activities completed
Interest / Other ~$50M improvement
improvement in Q4 FY21
Effective tax rate 12.5% to 13.5% 12.5% to 13.5% • Compared to 11.4% in FY21
• Raising FY22 adjusted EPS guidance $0.50 at the mid-
Adjusted EPS $12.80 to $13.00 $12.30 to $12.50 point driven by strength in the base business and COVID-
only testing
Note: indicates change in guidance
(1)
Please see Basis of Presentation on slide 27
(2)
Please see slide 32 for a reconciliation of adjusted operating margin to base operating margin
Q1 FY’22 EARNINGS PRESENTATION FEBRUARY 3, 2022 21
Note: This guidance is only effective as of the date given, February 3, 2022, and will not be updated or affirmed unless and until we publicly announce updated or
affirmed guidance. Please see Appendix for non-GAAP reconciliationsRaising FY22 revenue guidance driven by strength in the base business and
COVID-only testing
h~$250M
h~75 bps
(or ~$150M) $19.55B to $19.75B
i ~(75 bps) FY22 COVID-
$19.3B to $19.5B (or ~$150M) only testing:
~$450M
FY22 COVID-
only testing:
~$200M FY22 Base
revenue
FY22 Base
growth:
revenue
5.75% to 6.75%
growth:
FXN
5% to 6%
FXN
November 2021 estimated Incremental base Incremental Covid- Incremental February 2022 estimated
total company reported revenue (FXN) only testing revenue estimated FX impact total company reported
revenue guidance revenue guidance
Represents changes from November 2021 to February 2022 guidance
(1)
Please see slide 30 for a reconciliation of total revenues to base revenues
(2)
Please see Basis of Presentation on slide 27
Q1 FY’22 EARNINGS PRESENTATION FEBRUARY 3, 2022 (3)
Please see slide 32 for a reconciliation of adjusted operating margin to base operating margin 22
Note: This guidance is only effective as of the date given, February 3, 2022, and will not be updated or affirmed unless and until we publicly announce
updated or affirmed guidance. Please see Appendix for non-GAAP reconciliationsFY22 operating margins are on the path to recovery
~50 bps
~50 bps ~200 bps
~100 bps
21.7%
FY21 Adjusted Base Volume utilization Continuous Improvement / Above normal inflation Estimated FX Impact FY22 Adjusted Base
Operating Margin (1) (incl. COVID recovery) Price/Mix / Expense Leverage (COGS and Shipping) Operating Margin
Q1 FY’22 EARNINGS PRESENTATION FEBRUARY 3, 2022 (1) Please see slide 32 for a reconciliation of adjusted operating margin to base operating margin. 23Raising FY22 adjusted EPS guidance $0.50 at the mid-point driven by strength
in the base business and COVID-only testing
h~$0.50
~$0.60
$12.80 – $13.00
~45% base business
performance (1) ~($0.10)
~55% COVID-only
testing profit net of
$12.30 - $12.50 reinvestment
FY22 adjusted EPS guidance Incremental base business Estimated incremental FX pressure FY22 adjusted EPS guidance
(as presented November 2021) performance and COVID-only (as presented February 2022)
testing profit net of reinvestment (2)
(1) Basebusiness performance also includes the incremental benefit of improvement in Interest / Other
(2) Please
see Basis of Presentation on slide 27
Q1 FY’22 EARNINGS PRESENTATION FEBRUARY 3, 2022 24
Note: This guidance is only effective as of the date given, February 3, 2022, and will not be updated or affirmed unless and until we publicly announce updated or affirmed guidance.
Please see Appendix for non-GAAP reconciliationsFY22 quarterly phasing considerations
P&L Line item Quarterly phasing considerations
• Q2 revenue growth expected to be another strong quarter above our full-year guidance range due to easier comparison from
Base revenue prior year COVID resurgence
• 2H revenue growth expected to be fairly ratable
• Expect most of the rest-of-year COVID-only testing revenues to occur in Q2
COVID-only
testing • COVID-only testing operating margins expected to be modestly above BD base margin as we intend to reinvest a portion of
the profits which will lag the timing of income
• While we expect improvement vs. the prior year, Q2 expected to be sequentially lower than Q1 driven primarily by the timing
Base gross of licensing revenue and inflationary impacts
margin • Expect inflation impact to stabilize in 2H combined with modest pickup of margin improvement initiatives, with Q4 having the
highest benefit
Base operating
• Operating expenses expected to be fairly ratable by quarter
expenses
Effective tax • Full-year ETR includes assumptions around jurisdictional mix of income and certain potential discrete items.
rate • At the midpoint, implied ETR for remainder of the year expected to be ~13.7%
Q1 FY’22 EARNINGS PRESENTATION FEBRUARY 3, 2022 25Appendix Q1 FY’22 EARNINGS PRESENTATION FEBRUARY 3, 2022 26
Basis of presentation
All dollar amounts presented are USD ($) in millions, unless otherwise indicated, except per share figures.
Certain financial information, described as FXN (defined below), excludes the impact of foreign currency translation.
Revenue year-over-year change comparisons are on a FXN basis unless otherwise noted.
Base revenue denotes total revenues less estimated revenues for COVID-19 only diagnostic testing.
COVID only diagnostic testing includes COVID only assays on our BD Veritor™ and BD Max ™ platforms (with related
collection, transport, and swabs included in the prior year).
Base business margins adjusts for the net impact of estimated COVID only diagnostic testing profitability and the related
profit reinvestments back into our business.(1)
FXN denotes currency neutral basis. We calculate foreign currency-neutral percentages by converting our current-period local
currency financial results using the prior period foreign currency exchange rates and comparing these adjusted amounts to
our current-period results.
Organic FXN excludes the impact of significant acquisitions and currency(1)

             Q1 FY’22 EARNINGS PRESENTATION   FEBRUARY 3, 2022   (1)   See the financial tables in the Appendix for a reconciliation to the most comparable GAAP measure   27
Caution Concerning Products
Not all products in the coming section are launched, and some are only launched/available in some regions given regulatory authorizations. Furthermore:
The BD Veritor System for Rapid Detection of SARS-CoV-2 has not been FDA cleared or approved, but has been authorized by FDA under an EUA for use by
authorized laboratories, and has been authorized only for the detection of proteins from SARSCoV-2, not for any other viruses or pathogens.
The BD Veritor SystemTM for Rapid Detection of SARS-CoV-2 and Flu A+B have not been FDA cleared or approved; but have been authorized by FDA under an EUA
for use by authorized laboratories; these products have been authorized only for the detection of proteins from SARS-CoV-2, influenza A and influenza B, not for
any other viruses or pathogens.
The BD Veritor At-Home COVID-19 Test has not been FDA cleared or approved; but has been authorized by FDA under an EUA; the product has been authorized
only for the detection of proteins from SARS- CoV-2, not for any other viruses or pathogens.
The BD SARS-CoV-2 Reagents for BD MAX SystemTM has not been FDA cleared or approved, but has been authorized for emergency use by FDA under an EUA for
use by authorized laboratories, and has been authorized only for the detection of nucleic acid from SARS-CoV-2, not for any other viruses or pathogens.
The BD SARS-CoV-2/Flu for BD MAX System has not been FDA cleared or approved, but has been authorized for emergency use by FDA under an EUA for use by
authorized laboratories, and has been authorized only for the detection of nucleic acid of SARSCoV-2, influenza A, and influenza B, not for any other viruses or
pathogens.
These products are only authorized for the duration of the declaration that circumstances exist justifying the authorization of emergency use of in vitro
diagnostics for detection and/or diagnosis of COVID-19 under Section 564(b)(1) of the Federal Food, Drug, and Cosmetic Act, 21 U.S.C. § 360bbb3(b)(1), unless
the declaration is terminated or authorization is revoked sooner.
Q1 FY’22 EARNINGS PRESENTATION FEBRUARY 3, 2022 28Glossary
Acronym Defined Term Acronym Defined Term
BDB Biosciences MDS Medication Delivery Solutions
BPS Basis points MFG Manufacturing
CAGR Compounded annual growth rate MMS Medication Management Solutions
Capex Capital expenditures OCF Operating cash flow
DC Diabetes Care PI Peripheral Intervention
EPS Earnings per share PS Pharmaceutical Systems
ESG Environmental, Social, Governance R&D Research and development
FCF Free cash flow SURG Surgery
FY Fiscal year TTM Targeted Temperature Management
IDS Integrated Diagnostics Solutions UCC Urology & Critical Care
M&A Mergers and acquisitions 2H Second Half of Fiscal Year
Q1 FY’22 EARNINGS PRESENTATION FEBRUARY 3, 2022 29Supplemental Revenue Information
Quarterly Reconciliation of Reported Revenue Change to Base Revenue Change
For the Three Months Ended December 31, (Unaudited; Amounts in millions)
(Unaudited; $ in millions) A B C D=A-B E=A-C-B F=(A-B)/B G=(A-B-C)/B
Rptd FXN % Change % Change FX-
2021 2020 FX Impact Change Change Reported Neutral
TOTAL REVENUES $4,995 $5,315 ($7) ($320) ($314) (6.0%) (5.9%)
Less: COVID only diagnostics $185 866 0 (681) (681) (78.7%) (78.7%)
Base Revenues $4,811 $4,450 ($7) $361 $368 8.1% 8.3%
(1)
impact of COVID only diagnostics (12.8%) (12.8%)
BD LIFE SCIENCES $1,483 $1,979 ($5) ($496) ($490) (25.0%) (24.8%)
Less: COVID only diagnostics 185 866 0 (681) (681) (78.7%) (78.7%)
BDLS ex-COVID only Dx $1,299 $1,113 ($5) $186 $191 16.7% 17.2%
(1)
impact of COVID only diagnostics (34.4%) (34.4%)
IDS $1,145 $1,667 ($4) ($522) ($519) (31.3%) (31.1%)
Less: COVID only diagnostics 185 866 0 (681) (681) (78.7%) (78.7%)
IDS ex-COVID only Dx $960 $801 ($4) $159 $163 19.8% 20.3%
(1)
impact of COVID only diagnostics (40.9%) (40.9%)
(1)
Year over year change in COVID only diagnostic revenue divided by the prior year total revenue.
Q1 FY’22 EARNINGS PRESENTATION FEBRUARY 3, 2022 30
Note: FXN denotes FX-neutral.Supplemental Revenue Information - Organic Growth
Quarterly Reconciliation
For the Three Months Ended December 31, (Unaudited; Amounts in millions)
(Unaudited; $ in millions) A B C D=A-B E=A-C-B F=(A-B)/B G=(A-B-C)/B
% Change % Change FX-
2021 2020 FX Impact Rptd Change FXN Change Reported Neutral
TOTAL BDX REVENUES $4,995 $5,315 ($7) ($320) ($314) (6.0%) (5.9%)
Less: COVID only diagnostics $185 866 0 (681) (681) N/A N/A
TOTAL BDX BASE REVENUES $4,811 $4,450 ($7) $361 $368 8.1% 8.3%
Less: Inorganic revenue contribution (1) 21 21 0.5% 0.5%
Total Organic Revenue Growth $340 $347 7.7% 7.8%
BD MEDICAL REVENUES $2,397 $2,261 - $136 $136 6.0% 6.0%
Less: Inorganic revenue contribution (1) 12 12 0.5% 0.5%
BD Medical Organic Revenue Growth $124 $124 5.5% 5.5%
BD INTERVENTIONAL REVENUES $1,115 $1,075 ($1) $40 $41 3.7% 3.8%
Less: Inorganic revenue contribution (1) 9 9 0.8% 0.8%
BD Interventional Organic Revenue Growth $31 $32 2.9% 2.9%
(1)Inorganic revenue contribution is defined as the amount of incremental revenue recognized during the first 12 months post-acquisition. Acquisitions
Q1 FY’22 EARNINGS PRESENTATION FEBRUARY 3, 2022 31
include MedBank, GSL Solutions, Velano Vascular and ZebraSci in the Medical Segment and Tepha Medical, and Venclose in the Interventional Segment.Reconciliation of Non-GAAP adjusted margins to Base Business Margins
Adjusted Gross Margin Adjusted Operating Margin
(A) (B) (C) = (A) – (B) (D) (E) (F) = (D) – (E)
COVID-19 Dx test COVID-19 Dx test
All-in All-in
and reinvestment Base business and reinvestment Base business
adjusted adjusted
impact (FY21 only) impact (FY21 only)
Q1 FY21(1) 58.2% ~270 bps 55.5% 31.6% ~660 bps 25.0%
Q2 FY21(2) 53.8% ~10 bps 53.7% 24.5% ~230 bps 22.2%
(3)
Q3 FY21 51.5% ~(90 bps) 52.4% 19.8% ~(10 bps) 19.9%
(4)
Q4 FY21 52.0% ~(80 bps) 52.8% 19.2% ~(80 bps) 20.0%
(5)
FY21 54.0% ~40 bps 53.6% 23.9% ~220 bps 21.7%
Q1 FY22 (6) 55.9% ~50 bps 55.4% 25.4% ~110 bps 24.3%
(1) Please see slide 34 for reconciliation of GAAP to non-GAAP gross and operating margins
(2) Please see slide 39 in the Q2 FY21 earnings presentation posted on May 6, 2021 at investors.bd.com for a reconciliation of GAAP to non-GAAP gross and operating margins
(3) Please see slide 34 in the Q3 FY21 earnings presentation posted on August 5, 2021 at investors.bd.com for a reconciliation of GAAP to non-GAAP gross and operating margins
(4) Please see slide 35 in the Q4 FY21 earnings presentation posted on November 4, 2021 at investors.bd.com for a reconciliation of GAAP to non-GAAP gross and operating margins
(5) Please see slide 38 in the Q4 FY21 earnings presentation posted on November 4, 2021 at investors.bd.com for a reconciliation of GAAP to non-GAAP gross and operating margins
(6) Please see slide 33 for current reconciliation of GAAP to non-GAAP gross and operating margins
Q1 FY’22 EARNINGS PRESENTATION FEBRUARY 3, 2022 32Supplemental Non-GAAP Reconciliation 1 of 3
Quarterly Reconciliation of Adjusted Change and Adjusted Foreign Currency Neutral Change
Acquisitions Other Interest Other Income Diluted
(Unaudited; Amounts in millions, except per share Gross and Other (Income) Operating Income Income, Tax Net Earnings per
data) Revenues Profit SSG&A R&D Restructurings Expense Income (Expense) Net Net Provision Income Share
Three Months Ended Dec 31, 2021
Reported $ for Three Months Ended Dec 31, 2021 $4,995 $2,423 $1,223 $329 $34 $21 $815 ($96) $4 $46 $677 $2.28
Reported % of Revenues 48.5% 24.5% 6.6% 16.3% 13.6%
Reported effective tax rate 6.3%
Specified items:
(1)
Purchase accounting adjustments pre-tax - 358 (7) - - - 365 (1) - - 364 1.27
Integration costs pre-tax (2) - - - - (17) - 17 - - - 17 0.06
(2)
Restructuring costs pre-tax - - - - (17) - 17 - - - 17 0.06
(3)
Separation & Related costs - - - - - (25) 25 - - - 25 0.09
Transaction gain/loss, product and other litigation- - - - - - - - - 5 - 5 0.02
related matters pre-tax
(4)
European regulatory initiatives-related costs pre-tax - 10 (1) (21) - - 31 - - - 31 0.11
Investment gains/losses and asset impairments pre-tax (5) - - - - - - - - 17 - 17 0.06
Income tax benefit of special items and impact of tax reform - - - - - - - - - 88 (88) (0.31)
Adjusted $ for Three Months Ended Dec 31, 2021 A $4,995 $2,791 $1,215 $308 ($0) ($4) $1,271 ($97) $26 $133 $1,066 $3.64
Adjusted % of Adjusted Revenues 55.9% 24.3% 6.2% 25.4% 21.3%
Adjusted FXN % of Adjusted Revenues (A adjusted for E) 55.4% 24.3% 6.2% 25.0%
Adjusted effective tax rate 11.1%
(1) Includes amortization and other adjustments related to the purchase accounting for acquisitions impacting identified intangible assets and valuation of fixed assets and debt.
(2) Represents amounts associated with integration and restructuring activities resulting from acquisitions, as well as simplification and other cost saving initiatives.
(3) Represents costs recorded to Other operating expense, net which were incurred for consulting, legal, tax and other advisory services associated with the planned spin-off of BD's Diabetes Care business.
(4) Represents costs required to develop processes and systems to comply with regulations such as the European Union Medical Device Regulation ("EUMDR") and General Data Protection Regulation ("GDPR").
(5) Includes unrealized losses recorded within Other income, net relating to certain investments.
Q1 FY’22 EARNINGS PRESENTATION FEBRUARY 3, 2022 33Supplemental Non-GAAP Reconciliation 2 of 3
Quarterly Reconciliation of Adjusted Change and Adjusted Foreign Currency Neutral Change
Acquisitions and Other Other Income Diluted
(Unaudited; Amounts in millions, except per share Gross Other (Income) Operating Interest Income Income, Tax Net Earnings per
data) Revenues Profit SSG&A R&D Restructurings Expense Income (Expense) Net Net Provision Income Share
Three Months Ended Dec 31, 2020
Reported $ for Three Months Ended Dec 31, 2020 $5,315 $2,732 $1,149 $291 $50 ($0) $1,241 ($116) $32 $154 $1,003 $3.35
Reported % of Revenues 51.4% 21.6% 5.5% 23.3% 18.9%
Reported effective tax rate 13.3%
Specified items:
Purchase accounting adjustments pre-tax (1) - 347 (2) (5) - - 355 (2) - - 353 1.20
Integration costs pre-tax (2) - - - - (33) - 33 - - - 33 0.11
Restructuring costs pre-tax (2) - - - - (17) - 17 - - - 17 0.06
Transaction gain/loss, product and other litigation- - 8 - - - - 8 - (12) - (5) (0.02)
related matters pre-tax
(3)
European regulatory initiative-related costs pre-tax - 9 - (18) - - 26 - - - 26 0.09
Impacts of debt extinguishment pre-tax - - - - - - - - 10 - 11 0.04
(4)
Dilutive impact - - - - - - - - - - - (0.02)
Income tax benefit of special items and impact of tax reform - - - - - - - - - 79 (79) (0.27)
Adjusted $ for Three Months Ended Dec 31, 2020 B $5,315 $3,096 $1,147 $268 ($0) $0 $1,680 ($118) $30 $233 $1,360 $4.55
Adjusted % of Revenues 58.2% 21.6% 5.0% 31.6% 25.6%
Adjusted effective tax rate 14.6%
(1) Includes amortization and other adjustments related to the purchase accounting for acquisitions impacting identified intangible assets and valuation of fixed assets and debt.
(2) Represents amounts associated with integration and restructuring activities resulting from acquisitions, as well as simplification and other cost saving initiatives.
(3) Represents costs required to develop processes and systems to comply with regulations such as the European Union Medical Device Regulation ("EUMDR") and General Data Protection Regulation ("GDPR").
(4) Represents the dilutive impact of convertible preferred shares outstanding which were excluded from the reported diluted earnings per share calculation because these share equivalents would have been antidilutive. The adjusted
diluted average shares outstanding (in thousands) at December 31, 2020 were 299,107.
Q1 FY’22 EARNINGS PRESENTATION FEBRUARY 3, 2022 34Supplemental Non-GAAP Reconciliation 3 of 3
Quarterly Reconciliation of Adjusted Change and Adjusted Foreign Currency Neutral Change
Acquisitions Other Interest Other Income Diluted
(Unaudited; Amounts in millions, except per share Gross and Other (Income) Operating Income Income, Tax Net Earnings per
data) Revenues Profit SSG&A R&D Restructurings Expense Income (Expense) Net Net Provision Income Share
Three Months Ended Dec 31, 2021 versus Dec 31, 2020
Adjusted $ change C=A-B ($320) ($305) ($68) ($41) $0 $4 ($410) $21 ($5) $99 ($294) ($0.91)
Adjusted % change D=C/B (6.0%) (9.8%) (5.9%) (15.2%) - - (24.4%) 18.0% (15.9%) 42.7% (21.6%) (20.0%)
Foreign currency translation impact E ($7) $21 $2 $1 $0 $0 $23 $0 ($1) ($3) $19 $0.07
Adjusted foreign currency neutral $ change F=C-E ($314) ($325) ($70) ($41) $0 $4 ($432) $21 ($3) $102 ($313) ($0.98)
Adjusted foreign currency neutral % change G=F/B (5.9%) (10.5%) (6.1%) (15.4%) - - (25.7%) 17.8% (11.4%) 43.9% (23.0%) (21.5%)
Please note:
A refers to the adjusted figures for the three-month period ending December 31, 2021 from slide 32
B refers to the adjusted figures for the three-month period ending December 31, 2020 from slide 33
Q1 FY’22 EARNINGS PRESENTATION FEBRUARY 3, 2022 35Supplemental Non-GAAP Reconciliation –
Reported Diluted EPS to Adjusted Diluted EPS
Quarterly Reconciliation of Reported Diluted EPS to Adjusted Diluted EPS
For the Three Months ended December 31,
Foreign Foreign
Foreign Currency Currency
Currency Neutral Neutral
(Unaudited) 2021 2020 Growth Translation Growth Growth % Growth %
Reported Diluted Earnings per Share $2.28 $3.35 ($1.07) $0.07 ($1.14) (31.9%) (34.0%)
(1)
Purchase accounting adjustments ($364 million and $353 million pre-tax, respectively) 1.27 1.20 -
Integration costs ($17 million and $33 million pre-tax, respectively) (2) 0.06 0.11 -
Restructuring costs ($17 million and $17 million pre-tax, respectively) (2) 0.06 0.06 -
Separation and related costs ($25 million pre-tax) (3) 0.09 - -
Transaction gain/loss, product and other litigation-related matters ($5 million and $(5) million pre- 0.02 (0.02) -
tax, respectively)
(4)
European regulatory initiative-related costs ($31 million and $26 million pre-tax, respectively) 0.11 0.09 -
Investment gains/losses and asset impairments ($17 million pre-tax) (5) 0.06 -- -
Impacts of debt extinguishment ($11 million pre-tax) -- 0.04 -
Dilutive Impact (6) -- (0.02)
Income tax benefit of special items($(88) million and $(79) million, repsectively (0.31) (0.27) -
Adjusted Diluted Earnings per Share $3.64 $4.55 ($0.91) $0.07 ($0.98) (20.0%) (21.5%)
(1) Includes amortization and other adjustments related to the purchase accounting for acquisitions impacting identified intangible assets and valuation of fixed assets and debt.
(2) Represents amounts associated with integration and restructuring activities resulting from acquisitions, as well as simplification and other cost saving initiatives.
(3) Represents costs recorded to Other operating expense, net which were incurred for consulting, legal, tax and other advisory services associated with the planned spin-off of BD's Diabetes Care business.
(4) Represents costs required to develop processes and systems to comply with regulations such as the European Union Medical Device Regulation ("EUMDR") and General Data Protection Regulation ("GDPR").
(5) The current-period amount includes unrealized losses recorded within Other Income, net related to certain investments.
(6) Represents the dilutive impact of convertible preferred shares outstanding which were excluded from the reported diluted earnings per share calculation because these share equivalents would have been antidilutive. The
adjusted diluted average shares outstanding (in thousands) at December 31, 2020 were 299,107.
Q1 FY’22 EARNINGS PRESENTATION FEBRUARY 3, 2022 36Supplemental Non-GAAP Reconciliation –
Revenues by Business Segments and Units
For the Three Months ended December 31
D=(A-B)/B E=(A-B-C)/B
A B C % Change
(Unaudited; $ in millions) 2021 2020 FX Impact Reported FXN
BD MEDICAL
Medication Delivery Solutions $1,084 $1,008 3 7.6 7.3
Medication Management Solutions 627 630 1 (0.4) (0.5)
Diabetes Care 289 285 (1) 1.3 1.6
Pharmaceutical Systems 397 339 (3) 16.9 17.9
TOTAL $2,397 $2,261 $0 6.0 6.0
BD LIFE SCIENCES
Integrated Diagnostic Solutions 1,145 1,667 (4) (31.3) (31.1)
Biosciences 338 312 (1) 8.6 9.0
TOTAL $1,483 $1,979 ($5) (25.0) (24.8)
BD INTERVENTIONAL
Surgery 361 332 0 8.8 8.9
Peripheral Intervention 413 426 1 (2.9) (3.1)
Urology and Critical Care 340 317 (2) 7.2 7.7
TOTAL $1,115 $1,075 ($1) 3.7 3.8
TOTAL REVENUES $4,995 $5,315 ($7) (6.0) (5.9)
Q1 FY’22 EARNINGS PRESENTATION FEBRUARY 3, 2022 37Supplemental Non-GAAP Reconciliation –
Revenues by Geographic Regions
For the Three Months Ended December 31
(Unaudited; $ in millions) A B C D=(A-B)/B E=(A-B-C)/B
Year-over-Year % change
2021 2020 FX Impact Reported FXN
United States $2,853 $3,130 $0 (8.9%) (8.9%)
International $2,143 $2,186 ($7) (2.0%) (1.7%)
Developed Markets $4,229 $4,665 ($15) (9.3%) (9.0%)
Emerging Markets $766 $650 $8 17.8% 16.5%
China $375 $317 $13 18.5% 14.5%
TOTAL REVENUES $4,995 $5,315 ($7) (6.0%) (5.9%)
Q1 FY’22 EARNINGS PRESENTATION FEBRUARY 3, 2022 38Supplemental Non-GAAP Reconciliation – Net Income to Adjusted EBITDA and Net Leverage
Quarterly Reconciliation of Net Income to Non-GAAP Adjusted EBITDA – Unaudited
Last Twelve Months Ending December 31, 2021
Reported GAAP net income $1,766
Adjusted for:
Depreciation and amortization expense 2,275
Interest expense 448
Income taxes 42
Share-based compensation 237
Transaction and integration costs pre-tax (1) 109
Restructuring and other costs pre-tax (1) 50
Separation and related costs pre-tax (2) 60
(3)
Transaction (gain)/loss, product and other litigation-related matters pre-tax 281
European regulatory initiative-related costs pre-tax (4) 139
Investment (gains)/losses and asset impairments pre-tax (5) (28)
Impacts of debt extinguishment pre-tax 173
Adjusted EBITDA $5,552
Short-Term Debt 1,064
Long-Term Debt 16,360
Less: Cash, Cash Equivalents and Short Term Investments (1,910)
Net Debt $15,514
Net Leverage (6) 2.8x
(1) Includes integration, restructuring and transaction costs associated with acquisitions and restructuring costs related to simplification and cost saving initiatives.
(2) Represents costs incurred for consulting, legal, tax and other advisory services associated with the planned spinoff of BD's Diabetes Care business.
(3) Includes amounts recorded for product liability reserves, including related legal defense costs. It also includes net charges related to the estimate of probable future product remediation costs and sale-leaseback transactions
(4) Represents costs required to develop processes and systems to comply with emerging regulations such as the EUMDR and GDPR.
(5) Represents unrealized gains relating to certain investments.
(6) Net Leverage is calculated by dividing Net Debt by Adjusted EBITDA.
Amounts may not add due to rounding
Q1 FY’22 EARNINGS PRESENTATION FEBRUARY 3, 2022 39Supplemental Non-GAAP Reconciliation – FY2022 Outlook Reconciliation Full Year FY2022 Outlook
FY2021A Foreign Currency Reported
($ in millions) Neutral % Change Revenues
BDX Reported Revenues $ 20,248
Less: COVID-19-only Diagnostic Testing Revenues 1,956
Base Business Revenues $ 18,292
FY2022 Base Business Revenue Growth +5.75% to +6.75%
FY2022 COVID-19-only Diagnostic Testing Revenues ~$450 million
Illustrative Foreign Currency (FX) Impact, based on FX spot rates (~125) basis points
Total FY 2022 Revenues $19.55 to $19.75 billion
Full Year FY2022 Outlook
FY2021A Total Company
Reported Diluted Earnings per Share $ 6.85
Purchase accounting adjustments ($1.410 billion pre-tax) (1) 4.82
Integration costs ($135 million pre-tax) (2) 0.46
(2)
Restructuring costs ($50 million pre-tax) 0.17
(3)
Separation and related costs ($35 million pre-tax) 0.12
Transaction gain/loss, product and other litigation-related matters ($272 million pre-tax) (4) 0.93
Impacts of debt extinguishment ($185 million pre-tax) 0.63
European regulatory initiative-related costs ($135 million pre-tax) (5) 0.46
Investment gains/losses and asset impairments (6) (0.16)
Hurricane-related (insurance proceeds) recovery costs -
Income tax benefit of special items ($(353) million) (1.21)
$ 13.08 $12.80 to $13.00
(1) Includes amortization and other adjustments related to the purchase accounting for acquisitions impacting identified intangible assets and valuation of fixed assets and debt.
(2) Represents amounts associated with integration and restructuring activities resulting from acquisitions, as well as simplification and other cost saving initiatives.
(3) Represents costs recorded to Other operating expense, net which were incurred for consulting, legal, tax and other advisory services associated with the planned spin-off of BD's Diabetes Care business.
(4) The 2021 amount includes gains of $158 million on sale-leaseback transactions. The amounts in 2021 and 2020 include charges to record product liability reserves, including related legal defense costs, of $361 million and $378
million, respectively. The sale-leaseback gains and product liability-related charges were recorded to Other operating expense, net. The amounts in 2021 and 2020 also include charges of $56 million and $244 million, respectively,
recorded to Cost of products sold related to the estimate of future product remediation costs.
(5) Represents costs required to develop processes and systems to comply with regulations such as the EUMDR and GDPR.
(6) The amount in 2021 includes unrealized gains recorded within Other (expense) income, net relating to certain investments.
Q1 FY’22 EARNINGS PRESENTATION FEBRUARY 3, 2022 40Investor Relations contact information
Francesca DeMartino Adam Reiffe Nadia Goncalves
SVP, Investor Relations Sr. Director, Investor Relations Sr. Director, Investor Relations
investor.relations@bd.com
Advancing the
TM
world of health 41You can also read