Q1 2022 Oslo, 28 April, 2022 Valborg Lundegaard, CEO Egil Fagerland, CFO

Page created by Anne Collins
 
CONTINUE READING
Q1 2022 Oslo, 28 April, 2022 Valborg Lundegaard, CEO Egil Fagerland, CFO
Q1 2022
Oslo, 28 April, 2022
Valborg Lundegaard, CEO
Egil Fagerland, CFO
Q1 2022 Oslo, 28 April, 2022 Valborg Lundegaard, CEO Egil Fagerland, CFO
Agenda
Introduction and first quarter highlights

ESG focus areas

Market trends

Operations and business development

Finance

The way forward

Q&A
Q1 2022 Oslo, 28 April, 2022 Valborg Lundegaard, CEO Egil Fagerland, CFO
Aker Carbon Capture in brief

  Pure play carbon capture company delivering
  ready-to-use capture plants

  Best-in-class HSE friendly and proprietary
  patented technology for optimized all-round
  plant performance

  Validated and certified market-leading
  proprietary technology with more than 50,000
  operating hours

© 2022 Aker Carbon Capture                       28 April 2022   Slide 3
Q1 2022 Oslo, 28 April, 2022 Valborg Lundegaard, CEO Egil Fagerland, CFO
Highlights
                             Brevik and Twence projects progressing according to
                             schedule

                             Work commenced on FEED for BP Net Zero Teesside

                             Continued high level of market activity, studies and tenders

                             Clear need for CCUS from UN IPCC report

                             MoUs signed:
                             ● Microsoft
                             ● Northern Lights

                             Collaboration agreement with SINTEF

                             Continued strong revenue growth through Q1 2022

© 2022 Aker Carbon Capture                          28 April 2022   Slide 4
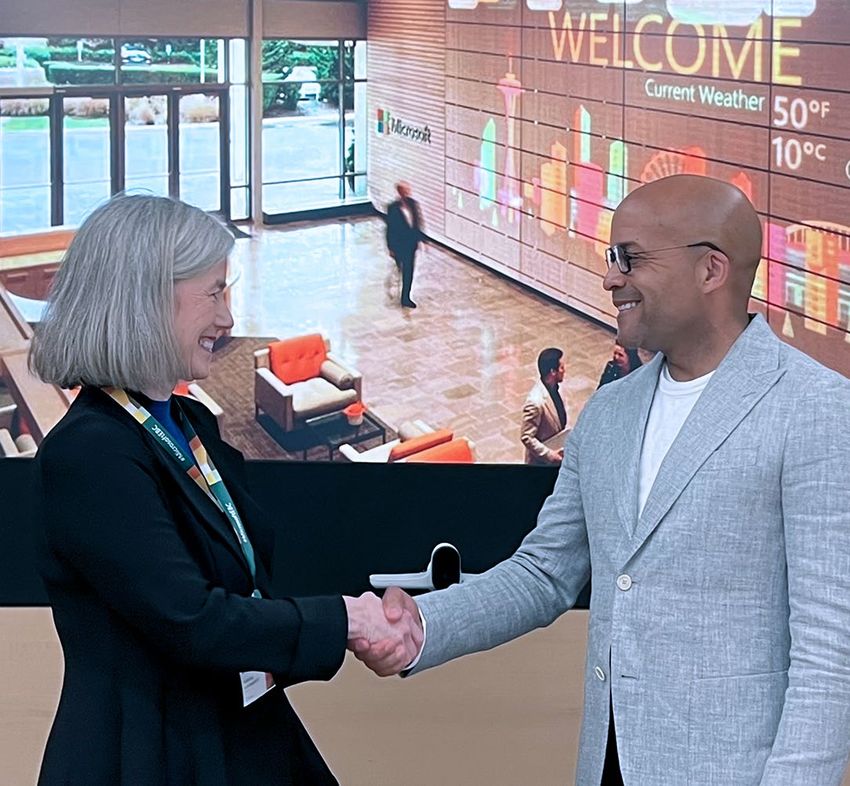
Q1 2022 Oslo, 28 April, 2022 Valborg Lundegaard, CEO Egil Fagerland, CFO
MoU with Microsoft
    Image: Dan Unity Co2
                                                        Collaboration with Microsoft for
                                                        scaling of the carbon capture value
                                                        chain
                                                        ● Using the combined strength of the two
                                                          companies' technology expertise
                                                        ● Demonstrating the full value chain of carbon
                                                          reduction and removal
                                                        ● Enable the ecosystem for the voluntary carbon
                                                          market, providing traceability and data -
                                                          ensuring high-quality carbon credits

   Valborg Lundegaard and Darryl Wills, CVP of Energy
   Industry at Microsoft, signing the MoU in Seattle

© 2022 Aker Carbon Capture                                             28 April 2022   Slide 5
Q1 2022 Oslo, 28 April, 2022 Valborg Lundegaard, CEO Egil Fagerland, CFO
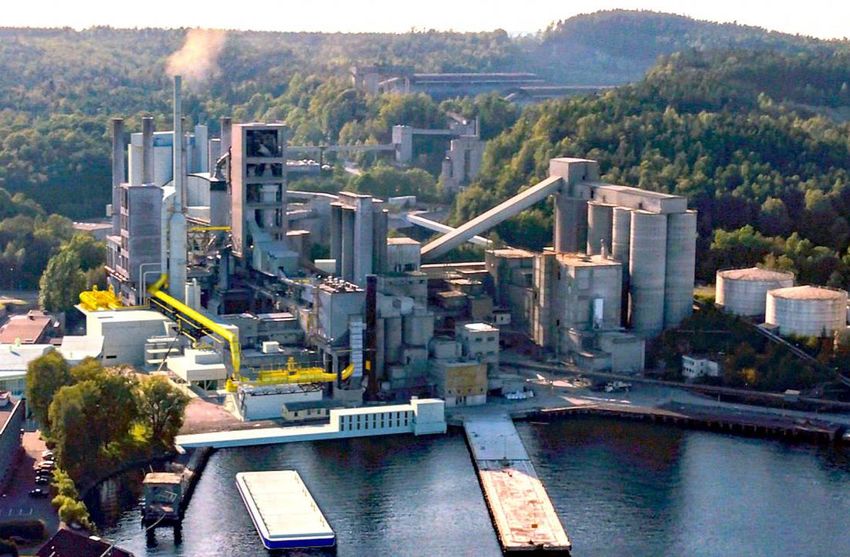
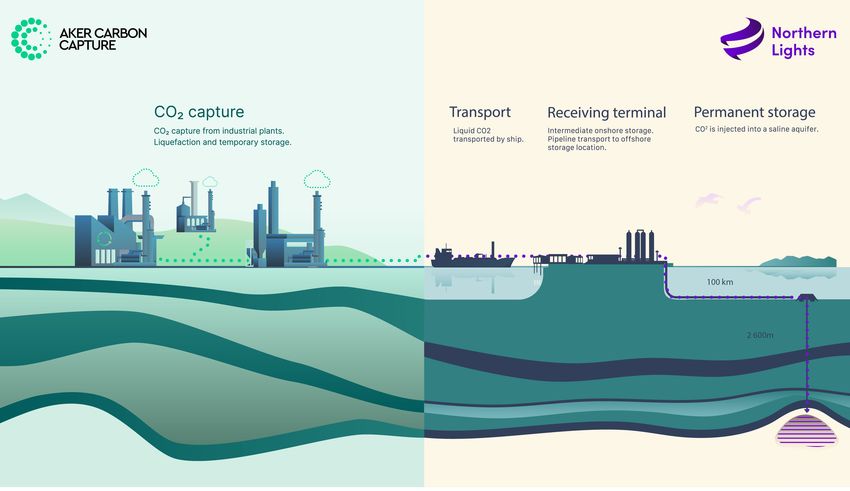
MoU with Northern Lights

   Accelerating the CCS market
   through full value-chain
   offerings in Norway and
   across Europe
   ● Optimize logistics and
     standardize ship-shore interfaces
   ● Build on learnings from the
     Longship project
   ● Develop source-to-storage
     decarbonization on a pay per
     tonne of captured CO2 model

© 2022 Aker Carbon Capture               28 April 2022   Slide 6
Q1 2022 Oslo, 28 April, 2022 Valborg Lundegaard, CEO Egil Fagerland, CFO
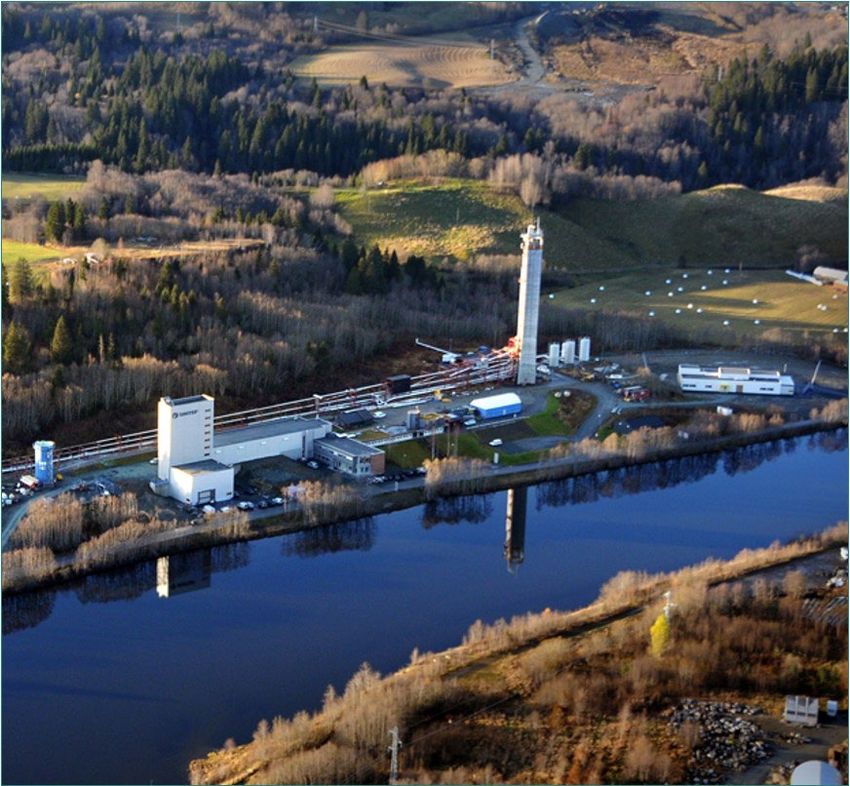
Agreement with SINTEF
    Image:
    The CO2Dan Unity Co
            laboratory
    Image: SINTEF
                       at2 Tiller   Expanding collaboration to develop
                                    next-generation CCUS technology
                                    ● Accelerating the transfer of science and
                                      research to innovation in the market
                                    ● Explore opportunities to develop new capture
                                      technologies
                                    ● Access to SINTEF’s significant testing
                                      infrastructure

© 2022 Aker Carbon Capture                          28 April 2022   Slide 7
Q1 2022 Oslo, 28 April, 2022 Valborg Lundegaard, CEO Egil Fagerland, CFO
MoUs with Dan-Unity CO2, Altera and Höegh LNG

   Exploring solutions for maritime CO2                        Strengthening the transport and storage value
   transport                                                   chain
                                                               ● Non-exclusive collaboration between Aker Carbon Capture,
   ● Collaboration agreement signed with Dan-Unity CO2 in        Altera Infrastructure and Höegh LNG
     Denmark – the world's first CO2-focused shipping player
                                                               ● Partnership targets cost-effective implementation of full
   ● Ambition to establish an optimized and flexible full        CCUS value chain, supporting Aker Carbon Capture's
     value chain for CCUS                                        Carbon Capture as a Service offering
                                                               ● Altera and Höegh involved with Stella Maris CCS project in
   ● Development of sea-based transport opens up multiple        Norway based around large-scale transport of CO2 to
     sourcing points and economies of scale                      offshore storage

© 2022 Aker Carbon Capture                                                         28 April 2022   Slide 8
Q1 2022 Oslo, 28 April, 2022 Valborg Lundegaard, CEO Egil Fagerland, CFO
ESG focus areas
STRATEGIC TARGETS                                                 ACTIONS TOWARDS 2030                             HIGHLIGHTS SO FAR

     Along with the absolute volume of carbon                         Emissions will be reduced through
     captured there are two important targets for                     execution, technological, and
     Aker Carbon Capture:                                             commercial initiatives such as:

                                                                          Improve capture rate and energy                   Founding members through Aker ASA.
                           Carbon intensity to be                         efficiency                                        Creates predictability around demand for
                           improved by 50% by 2030                                                                          sustainable and low-carbon materials and
                                                                          Supply chain engagement, e.g.
                                                                                                                            products.
                                                                          low carbon materials and
                           Reaching net negative by                       reduction targets
                           2030
                                                                          Strategic partner engagement,
                                                                          e.g. transport and storage
     Current Carbon intensity1                                            Purchase of Guarantee of Origin                   We have issued our commitment-letter
     Just Catch                                                           of renewable power                                and moving forward we will collaborate
     Capture phase:               0.2%                                                                                      with Science-Based Target initiative to get
                                                                      Focus on carbon removals including                    our targets approved.
     Big Catch                                                        offsetting residual emissions.
     Capture phase:               1.6%

1   NB: Carbon intensity defined as: tCO2 emitted/tCO2 captured

Confidential © 2022 Aker Carbon Capture                                                                     28 April 2022    Slide 9
Q1 2022 Oslo, 28 April, 2022 Valborg Lundegaard, CEO Egil Fagerland, CFO
Market trends
© 2022 Aker Carbon Capture
Market outlook supportive for                                                       CCUS capacity (Mtpa)
strong CCS growth                                                                                      250

● Major IPCC report (AR6) underlines clear need for CCS, CCU and
  Carbon Dioxide Removals (CDRs) to mitigate climate change
                                                                                                       200
● BNEF sees over 4x increase in global CCS investment by 2025, with
  cumulative spend reaching $52 bn mid-decade

                                                                             Annual CO2 capture Mtpa
● Further acceleration likely, with the IEA's ‘Net Zero Emissions by 2050’
                                                                                                       150
  pathway indicating capacity needs to grow by 8-11x over the next 8
  years
● Corporate net zero strategies driving clear momentum in voluntary                                    100
  carbon removal markets in 2022, with higher carbon offset prices
● Firm policy support continues:
  - European Union climate targets legally binding                                                     50
  - Repower EU package and European Parliament approve extension
      of 24% MSR withdrawal rate as part of EU decarbonisation
      strategy                                                                                          0
  - Proposed regulation for carbon removal certificates in Europe                                            2020 2021 2022 2023 2024 2025 2026 2027 2028 2029 2030

  - North American policy momentum growing – both USA and                                                                                                 Source: BNEF

      Canada

© 2022 Aker Carbon Capture                                                                                     28 April 2022   Slide 11
Operations and business development
© 2022 Aker Carbon Capture
Key markets and industries
                                                     Prioritized industries

                                                               Cement

                                                               Bio/Waste-to-Energy

                                                               Gas-to-Power

                                                               Blue hydrogen
   Main activity in Northern European markets
                                                               ...and engagement with new industry
   ● Scandinavia, Benelux, and the UK                          segments like pulp & paper, smelting,
     …with opportunities emerging in North America             engineered carbon

© 2022 Aker Carbon Capture                                      28 April 2022   Slide 13
Progress toward 10 in 25

                                          SECURED                                               PROSPECTS
                                          FEEDS1

       0.5                          4.0                                         5.5                                    >20

             SECURED
             DEVELOPMENT                                               STUDIES AND
             CONTRACTS                                                 TENDERS

            0.5                     2.5                          5.0                 7.5                   10.0         Capacity (Mtpa)

1   Note: Includes BP Net Zero Teesside and non-disclosed work

© 2022 Aker Carbon Capture                                                                 28 April 2022    Slide 14
Cement industry
                                                               “   It's about the legacy we give back to the

                                                                                                       “
Brevik CCS                                                         community. Also, the lessons learned will be
● Project to deliver the world’s first CCS plant at a cement       valuable for many coming projects.
  facility                                                         Tor Gautestad, Senior Project Manager,
● Started up in January 2021, progressing according to plan        Norcem
● Scope: EPC delivery of a complete CO2 capture plant in
  Brevik, Norway for HeidelbergCement Norcem
● Plant capture capacity 400,000 t/pa of CO2
● Key milestones achieved according to schedule
● Contract value at award of ~NOK 1.7 billion
● In operation from 2024 as part of the full CCS value chain
  Longship project in Norway

   Market                                                                    Brevik CCS live:
                                                                             kunde.byggekamera.no
   ● Cement industry represents 6-7% of global emissions

© 2022 Aker Carbon Capture                                                  28 April 2022   Slide 15
Image: Jeffrey Westerhoff / Twence

                                             Bio/Waste-to-Energy
                                                 Twence:

                                                 ● EPC delivery of full scale modular Just Catch™
                                                 ● Waste to Energy plant in Hengelo, Netherlands
                                                 ● Capacity of 100,000 tonnes CO2/yr
                                                 ● Twence will sell the CO2 into commercial horticulture markets
                                                 ● Commenced work Q4 2021

                                             ●    BIR: Exploring CCS on the largest CO2 emitter in Bergen, near Northern
                                                  Lights terminal
                                             ●    Forus Energi/Lyse: MoU to explore full-scale CCS in southwest Norway
                                             ●    Ørsted and Microsoft: MoU to explore development of carbon
                                                  removals at biomass-fired heat and power plants
                                             ●    Viridor: MoU announced October 2021, focusing on delivery of five Just
                       Technology partner:        Catch™ plants by 2030
                       Hitachi Zosen Inova   ●    Redcar: Exploring implementation of a large-scale carbon capture plant
                                                  in Teesside

    © 2022 Aker Carbon Capture                                              28 April 2022   Slide 16
Gas Fired Power Plants
                                                              Net Zero
                                                                         Gas-to-Power
in the UK                                                     Teesside

    Industrial clusters,
                                                                         Secured FEED for Net Zero Teesside Power
    track 1
                                                                         ● The world’s first commercial scale gas-fired power station
    Industrial clusters,
    track 1 reserved cluster
                                                                           with carbon capture
    Potential industrial                                                 ● Technology partner to a consortium of Aker Solutions,
    clusters, Track 2
                                                                           Siemens Energy and Doosan Babcock
                                                                         ● Capacity of about 2 million tonnes CO2 per year
    Planned new build
    CCGT c/w CCS

    Existing CCGT
    retrofit CCS plans                                                   ● CO2 transportation and storage infrastructure being
                                                 East Coast
                                                   cluster
                                                                           developed by the Northern Endurance Partnership to
                                                                           serve the East Coast Cluster
    Gas fired power
    plant >300 MW               Hynet

                                                                         UK industrial decarbonization strategy
                                                                         ● UK carbon capture aim of 20-30 Mt CO2 per year by 2030
                                                                         ● Hynet and East Coast Clusters confirmed as Track 1
                                                                         ● SSE and Equinor have submitted proposals into the BEIS
                                                                           Cluster sequencing for CCUS deployment for its planned
                                                                           Keadby 3 and Peterhead facilities
                           Technology partner:
                           Siemens Energy

   © 2022 Aker Carbon Capture                                                                 28 April 2022   Slide 17
Sustained CO2 capture rates
Blue hydrogen                                                                       Source: Testing campaign at Preem

Market
● IEA estimates 33% and 38% of global hydrogen market to
  be “Blue” in 2030 and 2050 respectively

Aukra
● Exploring opportunities to establish a regional blue hydrogen hub
  in Norway

Preem
● Our proprietary technology was validated through testing on a SMR
  hydrogen production unit for over 3,000 operating hours
● Some outcomes of the campaign:
     -      Sustained capture rates around 90%                                 Preem solvent color development over time

     -      Superior solvent stability
     -      Improved energy performance vs. MEA (close to 20% savings)
     -      Up to 40% cost savings from residual heat use
● Complements our ongoing research with SINTEF on cryogenic pre-
  combustion carbon capture for ATR hydrogen plants

© 2022 Aker Carbon Capture                                               28 April 2022   Slide 18
Business model development
© 2022 Aker Carbon Capture
Broad product offering with range of delivery models
Three principal carbon capture products offered by Aker Carbon Capture

   Key offerings                                                                                                   Delivery models
                                                                                                                         EPC                     Licensing   CCaaS
                                              Just Catch™
                                              Launched: 2018
                                              Capacity: 40 and 100 ktpa
                                              ● Modularised and cost efficient    ● Compact design – 25m x
                                              ● 15 months delivery time1            18m
                                              ● Easy transport and installation   ● 100% automated

                                              Big Catch
                                              Launched: 1996
                                              Capacity: > 400 ktpa
                                              ● Bespoke plant                        reduction through
                                              ● 30 – 36 months delivery time1        standardisation, modula-
                                              ● Larger footprint                     risation and digitalisation
                                              ● High potential for cost

                                              Just Catch Offshore™
                                              Launched: 2019
                                              Capacity: 120 – 360 ktpa
                                              ● Modularised and cost efficient    ● Compact design
                                              ● 20 – 24 months delivery time1     ● Retrofit potential
                                              ● Self-contained system

Strictly Confidential © 2022 Aker Carbon Capture                                                                                 28 April 2022   Slide 20
Indicative levelized cost of Carbon Capture as a Service1
   EUR per                 Just Catch 100
   tonne CO2            Carbon Capture Plant                           Operations and maintenance                                               Transportation and
                              (CAPEX)                                            (OPEX)                                                               storage
250

200

150                     ●    Just Catch 100 facility                      ●      Solvent supply                                           ●     Onshore transportation
                        ●    Liquefaction                                 ●      Energy                                                   ●     Offshore transportation
                        ●    Temporary storage                            ●      Digital operation center                                 ●     Permanent storage
                                                                                                                                                                                           ~70-150
                        ●    Financing                                    ●      Labor and maintenance
100

   50
                                                                                                                                                     ~30-60
                                ~30-45                                                   ~10-45

     0
                                                1 Levelized Cost of Carbon Capture as a Service calculated as:

© 2022 Aker Carbon Capture                      Cost discounted over 25 years divided by the amount of CO2 captured discounted over 25 years;                   28 April 2022   Slide 21
                                                Discount rate: 7.5%
Full CCS value chain economics turning positive
   EUR/tonne

     200                     Analyst EUA forecasts
                                                                                                                                                                                                  ● EUA reached almost 100 EUR
                             EUA Prices
     180                     Current CCaaS levelized cost range
                                                                                                                                                     Analyst forecast                               per tonne CO2 earlier in 2022
                                                                                                                                                   spread towards 2030
                                                                                                                                                                                                  ● Recent high volatility in price
     160
                                                                                CCaaS high range (150 EUR/tonne)                                                                                    amid geopolitical concerns
     140                                                    All time high at                                                                                                                      ● EU sends strong signals it will
                                                              EUR 97 per
                                                                  tonne
                                                                                                                                                                                                    proceed with reforms to further
     120
                                                                                                                                                                                                    tighten the carbon allowance
     100                                                                                                                                                                                            market1
                                                                                                                                                                                                  ● IEA Sustainable Development
       80
                                                                                                                                                                                                    Scenario requiring EUR ~120
       60
                                                                                CCaaS low range (70 EUR/tonne)                                                                                      per tonne2 by 2030
                                                                                                                                                                                                  ● Some Carbon Capture as a
       40
                                                                                                                                                                                                    Service projects are already
       20                                                                                                                                                                                           economically viable above EUR
                                                         “Fit for 55%”
                                                           package                                                                                                                                  70 per tonne CO2
         0
          2017         2018        2019     2020      2021         2022          2023         2024          2025         2026          2027         2028          2029         2030

                                                   1 Per 6 April 2022: European Parliament voted in favour of maintaining the current 24% MSR intake rate until 2030 (rather

                                                   than allow it to drop to 12% from 2023). The proposal still needs EU Council approval but signals the EU’s continued
© 2022 Aker Carbon Capture                                                                                                                                                        28 April 2022    Slide 22
                                                   commitment to the EU ETS as a key tool to drive down emissions.
                                                   2 1 USD = 0.92 EUR
Financials
© 2022 Aker Carbon Capture
Q1 2022 | Income Statement
Revenue and EBITDA NOK million                                               ● First quarter Revenue ended at NOK 144 million which was
           Revenue           EBITDA                                            an increase of NOK 81 million compared to the same quarter
                                          +81
                                                                               last year.
                                        (127%)                                  -   Mainly driven by the Norcem Brevik CCS EPC, Twence Just Catch EPC
                                                                 144                projects and BP Net Zero Teesside FEED projects
                                                     130                        -   Mobile test unit campaign ongoing in Poland
                                                                                -   More than twelve pre-FEED and feasibility studies contributed in the
                                         101
                                                                                    period
                                                                             ● Fourth quarter EBITDA ended at negative NOK 61 million
                             69
         63                                                                    which was a decrease of NOK 38 million compared to the
                                                                               same quarter last year
                                                                                -   Profit has not yet been recognised on Brevik CCS EPC and Twence
                                                                                    Just Catch EPC. Profit is normally recognized when a project reaches
                                                                                    a high level of certainty in cost estimates.
                                                                                -   Increased resource utilization contributed favourably in the period
                                                                                -   The mobile test unit campaign in Poland, pre-FEED and feasibility
              -23
                                                                                    studies contributed favourably in the period
                                  -47                                           -   Overall negative EBITDA continues to be driven by activity related to
                                               -54
                                                           -66
                                                                       -61          research and development projects, digitalization projects, tenders,
         Q1-21               Q2-21       Q3-21       Q4-21       Q1-22
                                                                                    business development, sales and international growth

© 2022 Aker Carbon Capture                                                                           28 April 2022   Slide 24
Q1 2022 | Balance Sheet
Balance sheet NOK million
           Asset             Liability   Equity                                Value per
                                                                                Q4-2021
  Trade and other receivables                                154                  255
                                                                                           ● Fourth quarter Net Current Operating Assets (net
  Trade and other payables                             644                       -515        working capital) ended at negative NOK 491 million
                                                                                             which represented a strong positive cash position on
  Net Current Operating Assets
  (NCOA)
                               -491                                              -260
                                                                                             key projects
  Intangible Assets                           12                                  11

  Fixed Assets                                    12                               8       ● NOK 470 million negative Net Capital Employed
                                                                                             signalling that the business’ operating capital is
  Right-of-use (RoU) assets                       12                              14
                                                                                             currently funded by project working capital
  Non-current lease liabilities                   4                               -6

  Current lease liabilities                       10                              -10      ● Healthy Cash and cash equivalents balance at NOK
                                                                                             1.5 billion which could cover all liabilities 2.5 times
  Pension liabilities                             2                               -3

  Net Capital Employed
                                          -470
                                                                                           ● Strong Equity position at NOK 1.0 billion
                                                                                 -245
  (NCE)

  Cash and cash equivalents                                    1,485             1,321

  Equity                                                               1,015     1,076

© 2022 Aker Carbon Capture                                                                                    28 April 2022   Slide 25
Q1 2022 | Cash flow
                                                                      Cash flow development NOK million
 ● The first quarter ended with an overall cash inflow
   of NOK 164 million
                                                                         Cash outflow           Cash inflow             Cash and cash equivalents
        -     Loss before tax in the fourth quarter of negative NOK
                                                                                                                       +164
              60 million represented a cash outflow
                                                                                                                                                          4            1 485
        -     Net Current Operating Assets ended the first quarter                                                      6                 2
                                                                         1 321
              at negative NOK 491 million which represented a
              cash inflow of NOK 229 million in the period                           60              229

        -     CAPEX of NOK 6 million was mainly related to the
              building of a new mobile test unit, product
              development and Just Catch standardization
        -     Payment of financial lease liabilities and adjustment
              for other non-cash items represented a net inflow of
              NOK 2 million in the quarter

 ● Cash and cash equivalents ended the first quarter
   at NOK 1,485 million                                                 Q4-2021   Profit/loss     Change in            Capex          Payment of    Adjustment for    Q1-2022
                                                                                  before tax      Net Current                       financial lease non-cash items
                                                                                                   Operating                           liabilities  (depreciation),
                                                                                                    Assets                                           interest and
                                                                                                                                                        foreign
                                                                                                                                                       exchange

© 2022 Aker Carbon Capture                                                                             28 April 2022     Slide 26
Financial outlook
Order backlog by execution year NOK billion                                        SG&A and operating expenses
    2                                                                              ● Total salary, personnel and other operating
                   ~1,8                                                              costs reached NOK 76 million in Q1 2022
                                                                                   ● Excluding costs associated with projects, we
                                                                                     expect to see operating expenses through 2022
                                                                                     around similar levels, with significant flexibility
                                                                 ~1,0
    1

                                        ~0,6                                       Cash balance
                                                                                   ● Q1-22 net cash of NOK 1.5 billion, helped by
                                                                         ~0,2
                                                                                     positive project-related cashflows
    0                                                                              ● Expect progress on projects to use cash in 2022,
             Order backlog
              (per Q1-22)
                                      Remaining
                                        2022
                                                                 2023   2024 -->
                                                                                     with net cash below NOK 1 billion by year end,
                Total order backlog   Order backlog by execution year
                                                                                     but see positive project-related flows in 2023

© 2022 Aker Carbon Capture                                                                          28 April 2022   Slide 27
Way forward
© 2022 Aker Carbon Capture
Way forward
                             Markets
                             Prioritizing Northern Europe initially; opportunities emerging in North America

                                                                                                                                10 in 25
                             Segments
                             Prioritizing cement, bio/waste-to-energy, blue hydrogen and gas-to-power
                                                                                                                                Secure contracts
                                                                                                                                to capture 10
                                                                                                                                million tonnes
        Pure play            Partnerships and M&A
                             Including Aker companies, Microsoft, Northern Lights, Siemens Energy, Haldor Topsøe,               CO2 per annum
        company              HZ Inova, SINTEF, Carbfix                                                                          by 2025

                             Up to 50% capex reduction
                             Technology development, standardization, modularization, digitalization

                             Business models
                             EPC, License and Carbon Capture as a Service – Carbon capture made easyTM

© 2022 Aker Carbon Capture                                                                           28 April 2022   Slide 29
Q&A
© 2022 Aker Carbon Capture
Appendices
             P&L   ●   Balance sheet   ●   Cash flow
Condensed consolidated income statement
                                                                                               Full year
Amounts in NOK thousand            Q1 2021     Q2 2021     Q3 2021     Q4 2021                    2021     Q1 2022

Revenues                           63,452      69,318      100,848     129,560                363,177      144,319
Materials, goods and services       (62,811)    (67,978)    (83,508)   (118,517)             (332,814)     (129,170)
Salary and other personnel costs     (8,007)    (14,446)    (35,313)    (34,336)              (92,102)      (34,135)
Other operating expenses            (15,298)    (34,085)    (36,454)    (42,267)             (128,104)      (41,689)
EBITDA                             (22,664)    (47,192)    (54,427)    (65,561)             (189,843)      (60,675)
                                                                           -
Depreciation                         (1,334)     (1,334)     (1,334)     (1,343)               (5,346)       (2,597)
Operating profit (loss)            (23,998)    (48,526)    (55,761)    (66,904)             (195,189)      (63,272)

Financial income                        327         234         633       1,954                 3,148         2,445
Financial expenses                     (174)       (163)       (168)       (154)                 (659)         (186)
Foreign exchange gain (loss)             19        (102)         49         433                   399           998
Net financial items                    172          (32)       514       2,234                 2,889         3,257
Profit (loss) before tax           (23,826)    (48,558)    (55,247)    (64,670)             (192,301)      (60,015)

Income tax benefit (expense)            -           -           -           -                     -             -
Net profit (loss)                  (23,826)    (48,558)    (55,247)    (64,670)             (192,301)      (60,015)

© 2022 Aker Carbon Capture                                              28 April 2022   Slide 32
Condensed consolidated balance sheet

Assets                                                                                        Equity and Liabilities

Amounts in NOK thousand       Q1 2021    Q2 2021      Q3 2021       Q4 2021       Q1 2022     Amounts in NOK thousand           Q1 2021       Q2 2021      Q3 2021      Q4 2021      Q1 2022

Non-current assets                                                                            Equity
Intangible assets                3,884      3,884        4,210        11,292        12,256    Share capital                     566,060        566,060   604,242         604,242      604,242
Right-of-use assets             11,928     10,673        9,417        14,242        11,751    Other equity and reserves        (138,026)      (186,584)  537,493         472,034      411,064
Fixed assets                     3,597      3,606        5,345         7,732        12,382    Total equity                     428,034        379,476 1,141,736       1,076,276    1,015,307
Total non-current assets       19,410     18,162       18,973        33,266        36,389
                                                                                              Non-current liabilities
Current assets                                                                                Pension liabilities                  2,849         2,981        2,981        2,843        2,475
Trade and other receivables    202,643    239,468       146,072       255,306       153,686   Non-current lease liabilities        7,896         6,508        5,109        6,091        3,545
Cash and cash equivalents      483,666    552,452     1,398,182     1,321,270     1,485,257   Total non-current liabilities      10,745         9,489        8,090        8,934        6,020
Total current assets          686,309    791,920    1,544,255     1,576,576     1,638,944
Total assets                  705,719    810,082    1,563,227     1,609,841     1,675,333     Current liabilities
                                                                                              Trade and other payables           261,547       415,239      407,202      514,917      644,292
                                                                                              Current lease liabilities           5,393          5,877        6,200        9,714        9,714
                                                                                              Total current liabilities        266,940        421,116      413,402      524,631      654,006
                                                                                              Total equity and liabilities     705,719        810,082    1,563,227    1,609,841    1,675,333

© 2022 Aker Carbon Capture                                                                                                    28 April 2022   Slide 33
Condensed consolidated statement of cash flow
                                                                                                                Full year
Amounts in NOK thousand                                   Q1 2021     Q2 2021       Q3 2021       Q4 2021          2021                Q1 2022

Profit before tax                                          (23,826)    (48,558)      (55,247)      (64,670)     (192,301)                  (60,015)

Adjustment for:
Amortisation and depreciation                                1,334       1,334         1,334         1,343         5,346                 2,597
Changes in net current operating assets                     50,508     117,000        77,264        (1,733)      243,039               229,186
Accrued interest and foreign exchange                          174         162           151           109           596                 1,284
Cash flow from operating activities                        28,190      69,939        23,502       (64,951)       56,680               173,053

Acquisition of property, plant and equipment                (1,066)        (87)       (1,819)       (2,369)       (5,341)                   (4,953)
Payments for capitalized development                           (92)        -            (326)       (7,351)       (7,769)                   (1,184)
Cash flow from investing activities                        (1,158)        (87)       (2,145)       (9,720)      (13,110)                   (6,137)

Payment of finance lease liabilities                        (1,066)     (1,066)      (1,227)        (1,530)      (4,888)                    (2,429)
Share issue, net of transaction costs                          -           -        825,600           (712)     824,888                        -
Cash flow from financing activities                        (1,066)     (1,066)     824,373         (2,242)     820,000                     (2,429)

Net cash flow                                              25,966      68,787      845,730        (76,913)     863,571                164,487

FX revaluation of cash                                         -           -             -              -                                (499)
Cash and cash equivalent at the beginning of the period    457,699     483,665       552,452      1,398,182      457,699            1,321,270
Cash and cash equivalent at the end of the period         483,665     552,452     1,398,182     1,321,270     1,321,270           1,485,257

© 2022 Aker Carbon Capture                                                                                      28 April 2022   Slide 34
© 2022 Aker Carbon Capture
Copyright and disclaimer
Copyright
Copyright of all published material including photographs, drawings and images in this document remains vested in Aker Carbon
Capture Norway AS and third party contributors as appropriate. Accordingly, neither the whole nor any part of this document shall
be reproduced in any form nor used in any manner without written prior permission and applicable acknowledgements. No
trademark, copyright or other notice shall be altered or removed from any reproduction.

Disclaimer
This presentation includes and is based, inter alia, on forward-looking information and statements that are subject to risks and
uncertainties that could cause actual results to differ. These statements and this presentation are based on current expectations,
estimates and projections about global economic conditions, the economic conditions of the regions and industries that are major
markets for Aker Carbon Capture Norway AS and Aker Carbon Capture Norway AS’s (including subsidiaries and affiliates) lines of
business. These expectations, estimates and projections are generally identifiable by statements containing words such as “expects”,
“believes”, “estimates” or similar expressions. Important factors that could cause actual results to differ materially from those
expectations include, among others, economic and market conditions in the geographic areas and industries that are or will be
major markets for Aker Carbon Capture Norway AS’s businesses, market acceptance of new products and services, changes in
governmental regulations, interest rates, fluctuations in currency exchange rates and such other factors as may be discussed from
time to time in the presentation. Although Aker Carbon Capture Norway AS believes that its expectations and the presentation are
based upon reasonable assumptions, it can give no assurance that those expectations will be achieved or that the actual results will
be as set out in the presentation. Aker Carbon Capture Norway AS is making no representation or warranty, expressed or implied, as
to the accuracy, reliability or completeness of the presentation, and neither Aker Carbon Capture Norway AS nor any of its directors,
officers or employees will have any liability to you or any other persons resulting from your use.

© 2022 Aker Carbon Capture                                                                 28 April 2022   Slide 36
You can also read