Pyrolysis of Lemon Peel Waste in a Fixed-bed Reactor and Characterization of Innovative Pyrolytic Products
←
→
Page content transcription
If your browser does not render page correctly, please read the page content below
Pyrolysis of Lemon Peel Waste in a Fixed-bed Reactor and Characterization of Innovative Pyrolytic Products Samira ABIDI Centre de Recherches et Technologies de l'Energie Aïda Ben Hassen Trabelsi ( aidabenhassen@yahoo.fr ) CRTEn: Centre de Recherches et Technologies de l'Energie https://orcid.org/0000-0002-8473-7119 Nourhène Boudhrioua Mihoubi Universite de la Manouba Institut Superieure de Biotechnologie de Sidi Thabet Research Article Keywords: lemon peels waste, pyrolysis, xed bed reactor, biofuels, antioxidants Posted Date: August 14th, 2021 DOI: https://doi.org/10.21203/rs.3.rs-656531/v1 License: This work is licensed under a Creative Commons Attribution 4.0 International License. Read Full License
1               Pyrolysis of lemon peel waste in a fixed-bed reactor and

 2                    characterization of innovative pyrolytic products

 3   Samira Abidi1,2,3, Aïda Ben Hassen Trabelsi1*, Nourhene Boudhrioua Mihoubi3
     1
 4       Research and Technology Center of Energy - CRTEn, Borj-Cedria, Technopark,

 5   B.P N°95 2050 –Hammam Lif – Tunisia.
     2
 6       Faculty of Sciences of Bizerte, University of Carthage, 7021 Bizerte, Tunisia.
     3
 7       University of Manouba, Higher Institute of Biotechnology Sidi Thabet, Laboratory of

 8   Alimentation, Physiopathology and Biomolecules, LR17ES03, BioTechPole Sidi

 9   Thabet, SidiThabet, 2020, Tunisia.

10   *Corresponding authors : aida.benhassen@crten.rnrt.tn

11   Abstract

12   The pyrolysis of LPW was carried out in a laboratory fixed-bed reactor at final

13   temperature of 300°C, 400°C and 500°C with an incremental heating rate of 10°C/min,

14   under N2 atmosphere. The maximum yields of bio-oil, biochar and gas were 16.66 wt.%

15   (at 400°C), 66.89 wt.% (300°C) and 54.6 wt.% (500°C), respectively. The recovered

16   biochar FTIR characterization reveals that it is a promising precursor to produce carbon

17   materials, biofertilizer and for solid fuel applications. The bio-oil chemical

18   characterization (GC-MS and FTIR analyzes) shows its richness with innovative

19   compounds such as squalene, d-limonene, ß-Sitosterol and phenol, suitable for

20   applications agriculture, biochemical and pharmaceutical industries. The pyrolytic oil

21   presents also good properties, suitable for its use as an engine fuel or as a potential

22   source for synthetic fuels. The recovered pyrolytic gas has a maximum calorific value

23   around 12 MJ/kg with an average composition of CO (up to 75.87 vol.%), of CH4 (up to

24   5.25 vol.%) and of CnHm (up to 1.48 vol.%). The results could be applied by citrus

                                                                                           1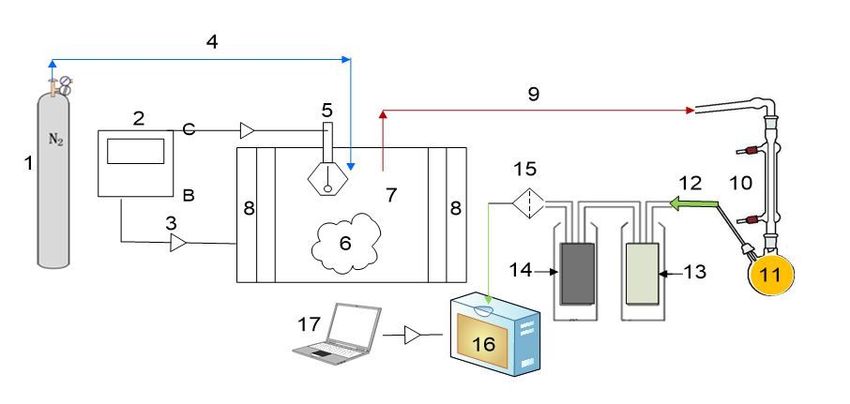
25   farmers and agri-food industrials for large scale application to ensure a sustainable

26   waste management of their citrus by-products and to guarantee economic benefits.

27

28   Keywords: lemon peels waste; pyrolysis; fixed bed reactor; biofuels; antioxidants.

29

30

                                                                                          2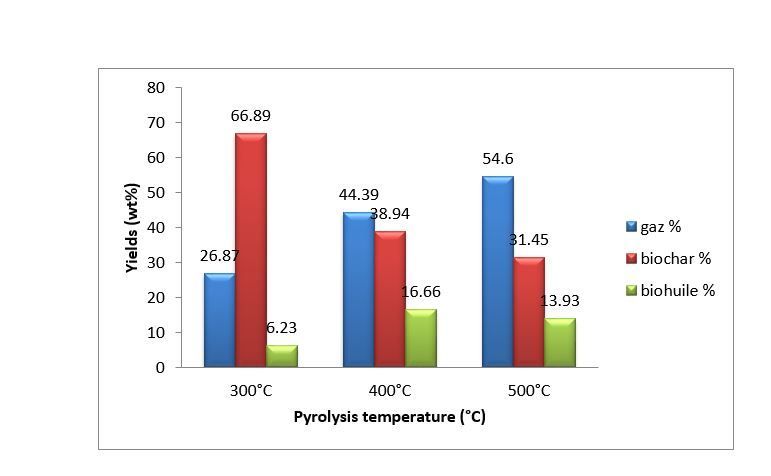
31   Introduction

32   The exploitation of new renewable resources to produce biofuels as a replacement for

33   the use of the conventional derivates of petroleum has received an increasing global

34   research interest. Global climate change associated with the extensive release of

35   greenhouse gases (GHG) have raised concern about the application of fossilized

36   hydrocarbons as the main energy source (Patsalou et al. 2019). In this context, the

37   transformation of agro-industrial waste into renewable biofuels can reduce fossil fuel

38   dependency, contribute to lower GHG emissions and considerably diminish the

39   pollution associated to the unsafe disposal of agro-industrial residues (Mahato et al.

40   2020). Currently, the citrus processing industry generates a substantial waste stream in

41   areas of important citrus production (Negro et al. 2018). Amongst the agro-industrial

42   wastes, citrus waste is abundant feedstock, inexpensive raw materials and readily

43   available for renewable energy production (Mahato et al. 2020). Citrus crops are highest

44   abundant worldwide with yearly production of around 120 million tons of oranges,

45   lemons, grapefruits and mandarins (Lopez-Velazquez et al. 2013). In Tunisia, citrus

46   production is estimated to 560 000 tons in 2018, which represents 0.7% of the global

47   citrus production. Several varieties are cultivated in Tunisia among which maltaise,

48   lemon and mandarin are the most produced ones (27%, 15% and 2.16% of the national

49   citrus production, respectively) (GIFruits, 2018) It is estimated that 33% of the citrus

50   harvest in the world is transformed into juice (Ahmad Taghizadeh-Alisaraei , Seyyed

51   Hasan Hosseini, Barat Ghobadian 2016). As most of agro-industrial activities, the citrus

52   conversion sector leads to the manufacturing of huge quantities of organic waste. It is

53   estimated that 40-60% of the citrus are converted into organic waste: peels, pulp and

54   seeds. Particularly, Citrus Peel Waste (CPW) represents around 40-55% of the citrus

                                                                                           3
55 industry (Sharma et al. 2018). Therefore, the suitable management of these organic
56 residues constitutes a permanent concern for the citrus processing industry.
57 Current management practices of CPW include first generation recycling methods, such
58 as animal feed after drying, composting since they are very rich in sugar fibers (Siles
59 López et al. 2010), disposal in landfills and anaerobic digestion (Patsalou et al. 2020)
60 and for recovery of biologically active composites (such as phenolic acids and
61 flavonoids pectin, fibers…etc) (M’hiri et al. 2015). But these conventional techniques
62 of CPW processing are insufficient and induce many problems in terms of energy
63 productivity and environmental consequences (Wei et al. 2017).
64 The chemical composition of CPW reveals a significant content of pectin in addition to
65 cellulose, hemicellulose and lignin as major components (Alvarez et al. 2018). These
66 lignocellulosic wastes could be considered as attractive feedstock to produce renewable
67 fuels and innovative products (biofertilizers, bioactive molecules). Regarding the
68 significant calorific power of CPW (around 17 MJ/kg dry basis), their direct use for
69 energy transformation across combustion (Siles et al. 2016) or for offering energy
70 vectors through thermochemical processes such gasification (Chiodo et al. 2017a) could
71 be a solution for providing energy for citrus product transformation industry (Zema et
72 al. 2018). Pyrolysis is the thermochemical process that, in the lack of oxygen, converts
73 organic wastes into valuable products including solid char, liquids (hydrocarbons and
74 water) and gaseous products. Few studies have been done on the pyrolysis of CPW;
75 most of them have been performed on orange peel waste (Aguiar et al. 2008; Miranda et
76 al. 2009; Morales et al. 2014; Volpe et al. 2015; Kim et al. 2015a; Alvarez et al. 2018)
77 and mandarin peel waste (Adeniyi et al. 2019). Aguiar et al. ( 2008) while studying the
78 energy recovery from orange peel (from juice industry) using a fixed bed pyrolyzer,
479 they investigated the influence of pyrolysis temperature (300, 500 and 600°C) and
80 particle size (300-800 mm) on products yields, gas composition and biochar heating
81 value. They denoted that the temperature of the pyrolysis is the parameter which exerts
82 the most important influence on the products yields more than particle size. Miranda et
83 al. (2009) carried out the pyrolysis of dry peels sweet orange (citrus sinensis) and
84 highlighted that these wastes have a high potential for producing liquid fuel (around
85 53.1% of bio-oil) due to their volatile content (78.9 % w/w) and their little ash content
86 (2.94% w/w) with an average yields of biochar and gas around 21.1% and 25.8% w/w,
87 respectively. Morales et al. (2014) studied the solar pyrolysis of orange peel and
88 reported a high bio-oil yield (around 77.64%), a moderate biochar yield (20.93%) and
89 only little percentage of gas (around 1.43%). Volpe et al. (2015) studied slow pyrolysis
90 in a laboratory-scale fixed-bed reactor of dried citrus waste (lemon and orange peel)
91 resulting from the citrus juice industry and reported that bio-oil yield varies between
92 36% and 39% w/w for a temperatures range of 400-650°C; whereas the biochar yield
93 was between 37.2% and 40.8% w/w. Alvarez et al. (2018) performed the fast pyrolysis
94 of orange waste and reported that bio-oil yield is close to 55 wt.% in the interval of
95 temperature between 425 and 500°C and a moderate yield of biochar, varying from 27
96 to 33 wt.%.
97 The previous studies of CPW pyrolysis focused essentially on the conversion of orange
98 and mandarin peel wastes to produce biochar. Few studies were interested in the
99 optimization of the pyrolysis of Lemon Peel Waste (LPW) (Patsalou et al. 2019) with a
100 focus on all pyrolysis products (bio-oil, biochar and gas) and on their adequate and
101 specific uses especially in nonconventional application using active biomolecules.
102 Adeniyi et al. (2019) developed a steady state thermodynamic model for the pyrolysis
5103 of lemon peel tested at 500°C and atmospheric pressure. The authors reported that the
104 lemon peels were the best for bio-oil production compared to other biomass peel waste.
105 Thus, more information on the pyrolysis of LPW and on the optimal conditions of bio-
106 oil, biochar and gas is still lacking and a deep investigation of end products
107 characteristics of LPW pyrolysis is required. The principal objective of this paper is to
108 explore, firstly, the pyrolysis of LPW into innovative pyrolytic products having
109 potential applications not only in energy, biofertilizer and biofuel production but also in
110 biochemical and pharmaceutical industries. It attempts to explore the consequence of
111 pyrolysis final temperature on pyrolytic products yields and qualities and to evaluate the
112 prospective application of each pyrolysis end product.
113 Material and Methods
114 Preparation of the samples
115 LPW used for this work were collected in March 2017, from a juice citrus factory in
116 Cap Bon (Northern Tunisia). The fresh material was collected immediately after
117 processing. The freshly processed LPW was slash into little pieces of an average area of
118 2 cm2 and were oven dried for 48 h at 60°C to diminish the moisture content until ~
119 10% (Ghanem Romdhane et al. 2015). The dried LPW was ground in a mill and then
120 sieved in order to obtain homogenous products with 2 to 4 mm particle sizes.
121 Experimental setup and procedure
122 The pyrolysis experiments of dried LPW were carried in April 2017 using a laboratory
123 scale fixed-bed reactor at final temperatures of 300°C, 400°C and 500°C, with a heating
124 rate of 10°C/min and under atmospheric pressure. The pyrolysis setup used in this work
125 was report in details in (Ben Hassen Trabelsi et al. 2018) (Fig. 1). The pyrolysis
126 experiments were conducted on a batch fixed-bed reactor heated with an electric
6127 furnace. The reactor is flushed with nitrogen to prevent oxygen introduction into the
128 reactor and to guarantee an inert medium for pyrolysis reactions and the reactor axial
129 temperature is followed using a K-type thermocouple. The pyrolysis gases pass through
130 a condensation system to collect bio-oil and non-condensable gases, separately.
131 Each experiment was conducted in duplicates, in order to confirm reproducibility and
132 the obtained products yields mentioned are the average value of two equivalent runs.
133 The end products were put in dark vials and stored at 4°C for further analyzes. Pyrolysis
134 products yields are determined by weighing the biochar and the bio-oil (Bensidhom et
135 al. 2017) and by using the following equations (1), (2) and (3) :
136
137
138
139 Analytical methods
140 Proximate and ultimate analysis of LPW and biochar samples
141 The moisture content of LPW samples was determined by the weight loss after drying at
142 105°C for 24 hours (AFNOR,2010). The volatile matter (VM) content of LPW samples
143 was determined based on the mass loss after samples combustion at 900 °C for 4 min
144 (AFNOR, 2010). Ash content was calculated by using the standard methods (AFNOR
145 2010). The fixed carbon (FC) amount was obtained according to (Volpe et al. 2015) as
146 follows:
147
148 Ultimate analysis CHN-O was fulfilled using a CHN elemental analyzer (Perkin Elmer
149 2400, country). The oxygen content was determined by difference.
7150 The High Heating Value (HHV) calculation was established based on the ultimate
151 analysis data (CHN-O) using the following formula (Bensidhom et al. 2017):
152 (MJ/kg) (5)
153 The determination of proximate and ultimate analyzes of LPW and produced biochar
154 allows the evaluation of LPW suitability as feedstock for the pyrolysis and the
155 estimation of their energetic potential.
156 FTIR spectroscopy of LPW, biochar and bio-oil samples
157 Fourier Transform Infrared (FTIR) spectroscopy analyzes were performed in order to
158 find out the functional groups composition of raw material (LPW), bio-oil and biochar.
159 FTIR analyzes will be useful for further determination of potential applications for
160 molecules having bioactive functional groups. The FTIR spectra were registered on KBr
161 pellets using a FTIR spectrometer (Perkin Elmer, FTIR 2000), in the spectral range of
162 400–4000 cm-1.
163 Thermogravimetric analyzes of LPW
164 Thermogravimetric (TGA-DTG) analyzes were conducted to investigate the thermal
165 degradation behavior of LPW by following the mass loss with the temperature increase,
166 using a TGA Thermogravimetric analyzer (SETSYS-1750) under Argon atmosphere in
167 the temperature range between 30°C and 700°C and the heating rate of 10°C/min. The
168 thermogravimetric analyzes (TG-DTG) of LPW are useful for the comprehension of the
169 thermal behavior of LPW under heating in an inert medium and for the selection of end
170 pyrolysis temperature.
171 Gas chromatography-mass spectrometry of bio-oil
172 Bio-oil samples were derivatized using bis (trimethylsilyl) tri fluoroacetamide
173 (BSTFA) and pyridine, in order to produce trimethylsilylester derivatives. Around 10
8174 mg of the bio-oil sample was derivatized with 100 µL of pyridine and 100 µL of
175 BSTFA. The solution was jumbled in a vortex and left to stand for 30 min at 70 °C. The
176 GC-MS analyzes of the produced bio-oil were performed using an Agilent 7890A GC
177 equipped with an Agilent 5975C mass-selective detector (MSD). The capillary column
178 was HP-5MS 5% Phenyl Methyl Siloxof 30 m long, 0.25 mm internal diameter, and
179 0.25 μm film thickness. The oven was programmed to hold at 70°C for 2 min, then a
180 ramp at 7°C/min to 300°C and hold there for 10 min. The injector temperature was set
181 to 250°C. The injector split ratio was set to 10:1 ratio. The carrier gas was helium
182 (1ml/min). The identification of bio-oil compounds was performed according to the
183 NIST database and by comparing to previously published mass spectra data.
184 GC-MS analyzes of studied bio-oils were conducted in order to explore the molecules
185 group content recognized in literature as active or bioactive.
186 Pyrolytic gas chemical composition determination
187 The gas chemical composition and the calculated calorific content (Low heating value
188 LHV) of the produced pyrolytic gas were determined by a gas analyzer (GEIT 3160
189 model, Belgium). Before analyzes, the gaseous mixture was purified in order to reduce
190 tars and water (Ben Hassen Trabelsi et al. 2018).Results and Discussion
191 3.1 Samples characterization
192 Proximate analyzes
193 The proximate results of the LPW are set in Table 1. As it is shown, pre-dried LPW
194 sample has moisture content around 10.86%. The drying pre-treatment (using open air
195 and oven) was a fundamental step before pyrolysis, since the fresh LPW samples are
196 very humid (moisture content around 78.1% by weight) and the pyrolysis process
197 require feedstock with low water content (around 10%, (Abnisa and Wan Daud 2014))
9198 The pre-drying process is usually recommended before pyrolysis experiments in order
199 to avoid additional heat to remove the moisture from biomass and to reduce pyrolysis
200 products (mainly bio-oil) moisture content.
201 The volatile matter (VM) content of LPW was about 80%. This VM value was in the
202 same range of those obtained for other LPW (Table 1) (77.22% (Volpe et al. 2015);
203 87.16 %(Pathak et al. 2017) and for other CPW (74.3% (Kim et al. 2015a); 57.5%
204 (Chiodo et al. 2017b)). The high VM content of studied LPW sample reveals its
205 suitability as raw material for pyrolysis process since biomass with high VM is easily
206 devolatilized and also produces less char. The LPW ash content is around 5.37 %.
207 Ultimate analyzes
208 Besides, the studied LPW showed high amounts of carbon (46.1%), of hydrogen
209 (7.36%), of nitrogen (1.02%) and of oxygen (51.52%) (Table 1). The high content of
210 organic matter (as carbon and hydrogen) makes LPW suitable for thermal conversion
211 (Fernandez et al. 2016).
212 The results shown in Table 1 are in agreement with those of other investigators: 40.33%
213 C, 5.96% H, 1.27% N and 52.25% O, reported by (Chiodo et al. 2017a) for Lemon Peel;
214 45.04% C, 5.78% H, 1.75% N and 47.43% O, reported by (Arni 2017) for in sugarcane
215 bagass.
216 The calculated HHV of LPW is around 18 MJ/kg. This HHV value is close to those
217 obtained for other lignocellulosic biomasses reported in the literature, such as
218 surgarcane bagasse (18.17 MJ/kg) (Arni 2017), rice husk (14.69 MJ/kg) (Yin 2011) and
219 grape bagasse (22.06 MJ/kg) (Demiral and Asl 2011).
220 LPW Thermal behavior
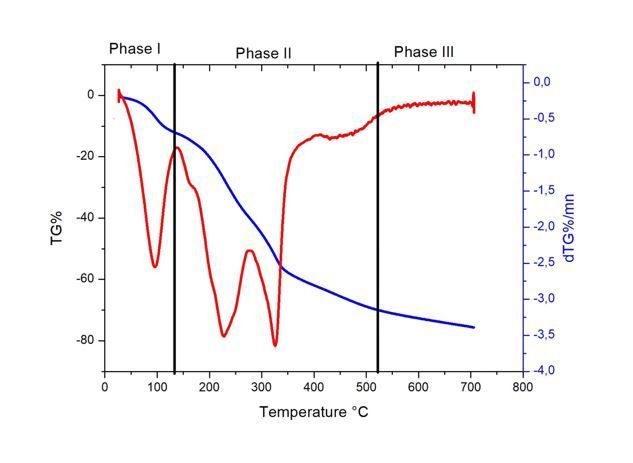
10221 Figure 2 shows the thermal behavior of LPW by simultaneous TG (mass loss) and DTG
222 (derivative thermogravimetric) evolution profiles as a function of temperature. Three
223 stages were distinguished for the principal thermal processes up to 700°C. The first
224 stage starts at 26°C and ends at 133°C with a mass loss about 12.38 % on account of the
225 removal of moisture and very light volatile components from biomass (Miranda et al.
226 2009; Varma and Mondal 2016; Zaafouri et al. 2016). The second stage starts at 134°C
227 and finishes at 407°C with a global mass loss of 50.8 %. It should be noted that this
228 stage is mainly characterized by the degradation of pectin, hemicelluloses and cellulose
229 (Lopez-Velazquez et al. 2013). In this stage, the maximum degradation temperature of
230 pectin is at 162°C with a mass loss of 2.18%, that of hemicelluloses is at 230°C with a
231 mass loss of 26.63 %, and that for cellulose is at 330°C with a mass loss of 19.08%.
232 This interval was considered as an active pyrolysis stage (Varma and Mondal 2016) .
233 Aguilar et al. (2012) while investigating the thermal comportment of fresh lemon,
234 reported that the decomposition peaks found are 160°C (9 %), 235°C (22 %), and 328°C
235 (8.3 %) and correspond in fresh lemon to pectin, hemicellulose, and cellulose,
236 respectively. The third stage, from 408°C to 700°C, is assigned to the presence of
237 lignins in the biomass sample with a mass loss of 4 % at temperature maximal of 462°C.
238 The last stage is referred as passive pyrolysis (Miranda et al. 2009; Varma and Mondal
239 2016; Chiodo et al. 2017b). Its decomposition go down slowly under a wide range of
240 temperature from ambient to 700 °C (Dhyani and Bhaskar 2017). The thermal
241 decomposition of hemicelluloses, cellulose and lignins is well studied in the literature
242 and it is specified that their decomposition temperature ranges are 210–325, 310–400
243 and 160–900°C, respectively) (Boluda-Aguilar and López-Gómez 2012; Aboulkas et al.
244 2017).
11245 Fourier Transform Infra-Red (FTIR) spectroscopy
246 LPW FTIR spectra is presented in Figure 3. The wide band in the energy zone (3100–
247 3500 cm−1) is assigned to O-H stretching vibrations of carbohydrates and lignins, in
248 addition to the symmetric and asymmetric stretching vibrations associated with H2O
249 molecules (Yin 2011; Lopez-Velazquez et al. 2013; Bensidhom et al. 2017). Stretching
250 vibrations at 1743 are due to C=O and C-O bonds of the acetyl ester units present in
251 hemicelluloses. The intense band at 1065 cm−1 corresponds to the link COH or
252 COR (alcohols or esters) while the distinctive band at 2897 cm-1 is related to the
253 presence of CH stretching vibration together with bending vibrations around 1430 cm-1
254 of aliphatic chains ( CH2 and CH3 ) forming the basic structure of these lingo-cellulosic
255 materials (Boluda-Aguilar et al. 2010; Lopez-Velazquez et al. 2013). The band shown at
256 around 622 cm-1 is attributed to CH aromatic stretching vibrations and CH2 deformation
257 vibration (Anukam et al. 2016; Zaafouri et al. 2016). The aliphatic and oxygenated
258 functional groups contents of raw LPW emphasize their potential use as feedstock for
259 pyrolysis process.
260 Pyrolysis products yields
261 LPW pyrolysis products distribution is given in Figure 4. Biochar yield decreased from
262 66.9 wt. % to 31.5 wt.% when the temperature increased from 300 to 500°C while the
263 pyrolytic gas yield increased from 26.9 to 54.6% when temperature rose from 300 to
264 500°C. The bio-oil yield showed a maximum value (around 16.6%) at 400°C. The bio-
265 oil yields reduction at high temperature is mainly due to secondary reactions (rupture
266 and rearrangement) of the pyrolysis vapors, which participates to the increase of the
267 gaseous product (Primaz et al. 2018). At 500°C, the yield of condensable and non-
268 condensable products dropped by around 68.53 wt.%. This reaction is compatible with
12269 TGA (Fig. 2), where weight loss at 500°C was observed. The yield of bio-oil acquired
270 in this work is slightly lower than that indicated for the pyrolysis of LPW or similar
271 citrus waste, which range from 35 to 53% by weight (Miranda et al. 2009; Volpe et al.
272 2015; Kim et al. 2015a; Wang et al. 2018) . The decrease of biochar yield with
273 temperature increase could be due either to the primary decomposition of the biomass at
274 higher temperatures or through secondary decomposition of the char residue in the form
275 of dehydrogenation and dehydration of hydroxyl groups reaction (Aboulkas et al. 2017).
276 This result is comparative to those reported by Volpe et al. (2015), who investigated the
277 slow pyrolysis of the lemon peel juice industries in a fixed-bed pyrolysis reactor after
278 drying, where the biofuel yield decreased from 55.3% to 38.2%, respectively, at from
279 300°C. It is believed that the increase of pyrolytic gas proportion is mainly due to the
280 secondary cracking of the pyrolysis vapors at higher temperatures. However, secondary
281 decomposition of char at higher temperatures can give non-condensable gaseous
282 products.
283 Characterization of pyrolysis products
284 Biochar characterization
285 Proximate and ultimate analyzes in Table 2 show that by increasing the severity of the
286 treatment, the solid residues have a moisture content below equilibrium and that the
287 volatile mass decreases rapidly (from 75% to 68%). The obtained biochar fixed carbon
288 content is about 18.34% C (at 300°C) and 31.88 % C (at 500 °C). By increasing
289 pyrolysis temperature, most of the oxygenated compounds in the biological reservoir
290 are lost (O% = 41.68% at 300°C and O%=21.36% at 500 ° C). Besides, carbon content
291 increases from 51.41% at 300 °C to 72.29 % at 500 °C, which positively affects the char
292 calorific values, increasing from 19.88 at 300 °C to 24.42 MJkg-1 at 500 °C. Similar
13293 HHV's were obtained for other chars from the pyrolysis of orange peel or citrus wastes
294 at temperatures between 300 and 600°C (Alvarez et al. 2018). The hydrogen content of
295 the studied chars decreases with the temperature increase of the pyrolysis. Biochar
296 product obtained at different temperatures shows also less amount of fixed carbon and
297 hydrogen than raw LPW which is attributed to lignocelluloses volatilization (Zaafouri et
298 al. 2016).
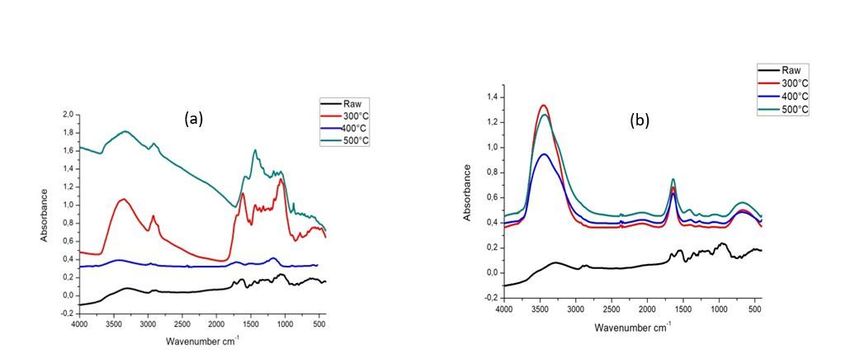
299 FTIR spectra of biochar obtained from LPW pyrolysis is shown in Figure 5(a). The
300 peak assignments description is provided in Table 3. Remarkably, the intensity of the
301 hydroxyl groups, of the C-H stretching associated to aliphatic com- pounds and the
302 carbonyl band C=O decreased with rising temperature. The O-H stretching vibration at
303 3600-3100 cm-1 in the FTIR spectra of the biochar sharply decreased after pyrolysis,
304 probably due to the further dehydration of the LPW (release of residual water)
305 (Aboulkas et al. 2017). Compared to raw LPW, pyrolysis at 300°C, 400°C and 500°C
306 resulted in decrease of the absorption intensity of O-H (3394-3309 cm-1) and aliphatic
307 C-H (2922 cm-1) functional groups, mainly due to dehydration of residual cellulose
308 and/or hemicellulose in LPW sample. Thus this result is alike to the studies conducted
309 by Volpe (Volpe et al. 2017) and Wang (Wang et al. 2018) on residual biochars
310 produced from citrus waste and rice husk, respectively. At higher temperatures the less
311 intense signal in FTIR is related to aromatics undergoing condensation reactions and
312 forming more rigid structures closer to graphite (Volpe et al. 2017). At 400°C, the
313 distinctive absorption peaks at 3400 cm-1, 2920 cm-1 and 1602 cm-1 representing O-H,
314 aliphatic C-H and C=O, respectively, vanished, which indicates that at modest pyrolysis
315 temperatures hydroxyl and CO2 are liberated mainly by direct dehydration and
316 decarbonylation reactions, respectively (Wang et al. 2018) It can be spotted that signals
14317 at around 1000 cm-1 arrange in the spectra of hemicellulose and cellulose are originated
318 from the hydroxyl and either groups of polysaccharides. The last spectra are different
319 from the spectra of lignin(Cao et al. 2014).
320 Bio-oil characterization
321 FTIR analyzes have also designed that the functional groups of bio-oils at different
322 pyrolysis temperatures are quite similar (Fig.5 (b)). Table 3 shows the functional groups
323 and corresponding classification of compounds. The stretching vibration of OH (3300–
324 3600 cm−1) designates the presence of alcohols and phenols. The absorbance of peaks
325 between 1578 and 1686 cm-1 representing C=C stretching vibrations is indicative of
326 alkenes and aromatics. The absorption of aliphatic CH2 at 1420 cm-1indicates the
327 presence of alkanes or aliphatic hydrocarbon chains in heteroatomic compounds. The
328 absorption bands between 1672 and 1607 cm-1 indicate the presence of carboxylic acids
329 and aldehydes; the three bio-oils obtained at different temperatures represent the same
330 absorption band at 1638 cm-1 with different intensities. The possible presence of
331 aromatic esters is indicated by the absorbance peaks between 657 and 670 cm-1 as well
332 as C–O stretch indicates the presence of aromatic (Demiral and Asl 2011).
333 GC-MS analysis was performed to determine the organic compounds of the bio-oils
334 presented in Figure 6. The bio-oil was mainly composed of alcohols, carboxylic acids,
335 phenols, fatty acids, aldehydes, nitrogenous compounds (indoles and pyridines) which is
336 are consequences of the features of the components in the pectin, hemicellulose,
337 cellulose and lignin contained in LPW.
338 The major detected compounds in the bio-oil sample were n-hexadecanoic acid
339 (palmitic acid) (19.98%) and (10.74%); 9-octadecenoic acid (oleic acid) (12.7%) and
340 (5.97%); octadecanoic acid (10%) and (stearic acid) (8.89%) respectively at 500°C and
15341 300°C pyrolytic temperatures in Table 4. The components of the bio-oil at 500°C were
342 similar to the liquid product obtained by Primaz et al., 2018 (2018). The other useful
343 compounds that were found on the bio-oil at 500°C were: squalene, d-limonene and β-
344 Sitosterol. The components of the bio-oil were similar to the liquid product obtained by
345 other researchers (Kim et al. 2015b; Liu et al. 2017). The most abundant phenols
346 accounted for 16.3 % at the temperature of 400°C. The existence of phenolic and
347 aromatic compounds in pyrolysis oil were due to the thermal degradation of lignin and
348 was also seen in the FTIR spectral regions of 3300–3600 cm-1 (Bhattacharjee and
349 Biswas 2019).
350 The major compound found in the bio-oil fraction obtained during pyrolysis at 400°C is
351 glycerol (23.5%). It is a foremost renewable raw material used essentially in the
352 chemical industry. The prevailing compounds obtained are hydroquinone and 4-
353 coumaric acid. The oxygenated compounds correspond to saccharides. The pyrolysis
354 mechanism of hemicelluloses is very similar to that of cellulose, which also starts with
355 the depolymerization of polysaccharide chains to form oligosaccharides, following the
356 cleavage of the xylan chain in the glycosidic linkage and rearrangement of the produced
357 molecules (Liu et al. 2017). The nitrogen-containing heterocyclic compounds in bio-
358 oils, such as pyridines, are supposed to be derived from protein degradation (Zhou et al.
359 2010).
360 Gas characterization
361 The composition of produced synthesis gas and their corresponding heating value
362 (LHV) are presented in Table 5. Carbon monoxide (CO) was the largest amount of the
363 chemicals in the pyrolytic gas which contributed to about 75.87 wt.% at 400°C but at
364 500°C the concentration of CO decreased about 59.8 wt.%. The contents of carbon
16365 dioxide increasingly from 0.12 wt.% at 300°C to 0.72 wt.% at 500°C. The CO and CO2
366 contents of the gaseous fraction are indicators of the oxygen present in the sample. This
367 oxygen derives from the pyrolytic decomposition of partially oxygenated organic
368 compounds (cellulose, lignin, lipids and carbohydrates). These results are almost like
369 values found in previous studies on pyrolysis of different feedstocks at maximum
370 temperature 500°C: for example, Bensidhom et al. (2017)reported for the gas produced
371 from date palm waste pyrolysis an yield of CO ranging from 30 to 55 wt.% and an yield
372 of CO2 ranging from 0.33 to 0.55 wt.%. The presence in the gaseous mixture of CH4 in
373 significant proportions gives it good fuel properties. The releasing of CH4 can be caused
374 by the cracking of methoxyl-O-CH3, and was mainly focused at low temperatures (<
375 600 °C). Hemicellulose, cellulose and lignin all contributed to the releasing of CH4
376 from biomass pyrolysis, at respectively low, middle and high temperature ranges. The
377 yield of H2 was also very low (≤0.46 wt.%). In the present experiments, CO, CO2, CH4
378 and LHV decreased when temperature increases from 400°C to 500°C. Furthermore, the
379 lower heating value (LHV) of gas decreased from 12 MJ/kg to 10 MJ/kg, when the
380 reactor temperature increased from 400°C to 500°C. The large reduction in methane
381 leads to a decrease in the pyrolytic gas LHV of the synthesis gas because methane has
382 the highest calorific value than the other gases (He et al. 2009).
383 Conclusion
384 In this research, dried LPW were converted into biochar, bio-oil and pyrolytic gas using
385 a fixed-bed pyrolysis reactor. The maximum yields of biochar (66.89 wt.%), bio-oil
386 (16.66 wt.%) and gas (54.6 wt. %), were obtained at 300°C, 400°C and 500°C,
387 respectively. The increase of the final temperature was followed by an important
388 increase of the production of non-condensable compounds but resulted in a decrease in
17389 the biochar yield. The produced bio-oil is composed namely of phenols, acids, terpenes,
390 alcohols and nitrogen compounds. This study has shown that LPW could be processed
391 to obtain bio-oil and biochar, containing active biomolecules with high added-value
392 having potential applications in agriculture, pharmaceutical and nutraceutical industries.
393 Besides produced chars, little ash and high calorific value could be used to replace the
394 most valuable conventional fossil fuels. The present feasability study have to be
395 completed by an economic analysis of the examination of the hole process efficiency
396 taking into consideration all produced economic value products (energy forms, active
397 molecules, potential fertilizer) and in a biorefinery facility approach. The outcomes of
398 this work could be adopted by citrus farmers and agri-food industrials to ensure a
399 sustainable citrus by-products waste management and to provide economic benefits in
400 this economic sector.
401 Acknowledgements
402 This work is co-financed by Young Researcher Programs. Project Ref. 18PJECI-12-05.
403 Thermochemical conversion of citrus co-products and sardine into biofuels rich
404 in active molecules. The authors gratefully acknowledge the Tunisian Ministry of
405 Higher Education and Research for financial support. The authors
406 gratefully acknowledge the revision of the English of the final manuscript by Pr.
407 Benlarbi Maha, Researcher at Clore Laboratory, University of Buckingham,
408 United Kingdom and at Laboratory of Physiopathology, Alimentation and
409 Biomolecules, University of Manouba.
410
411
18412 Ethical Approval
413 o Not applicable
414 Consent to Participate
415 o Not applicable
416 Consent to Publish
417 o Not applicable
418 Authors Contributions
419 o Samira Abidi: Experiments conducting and writing-original draft
420 o Aïda Ben Hassen Trabelsi: Experimental results validation and
421 manuscript Revision
422 o Nourhene Boudhrioua Mihoubi: Investigation and manuscript Revision
423 Availability of data and materials
424 o Not applicable
425 Competing Interests
426 o The authors have no conflicts of interest to declare that are relevant to the
427 content of this article. All authors certify that they have no affiliations
428 with or involvement in any organization or entity with any financial
429 interest or non-financial interest in the subject matter or materials
430 discussed in this manuscript. The authors have no financial or proprietary
431 interests in any material discussed in this article.
432
433
19434 References
435 Abnisa F, Wan Daud WMA (2014) A review on co-pyrolysis of biomass: An optional
436 technique to obtain a high-grade pyrolysis oil. EAbnisa, F, Wan Daud, WMA,
437 2014 A Rev co-pyrolysis biomass An optional Tech to obtain a high-grade
438 pyrolysis oil Energy Convers Manag 87, 71–85
439 https//doi.org/101016/j.enconman201407007nergy Convers Manag 87:71–85.
440 https://doi.org/10.1016/j.enconman.2014.07.007
441 Aboulkas A, Hammani H, El Achaby M, et al (2017) Valorization of algal waste via
442 pyrolysis in a fixed-bed reactor: Production and characterization of bio-oil and bio-
443 char. Bioresour Technol 243:400–408.
444 https://doi.org/10.1016/j.biortech.2017.06.098
445 Adeniyi AG, Otoikhian KS, Ighalo JO, Mohammed IA (2019) Pyrolysis of Different
446 Fruit Peel Waste Via a Thermodynamic Model. ABUAD J Eng Res Dev 2:16–24
447 AFNOR French Association for Standardization 2010 (2010) AFNOR French
448 Association for Standardization, 2010. Solid biofuels - AFNOR XP CEN/TS
449 14774-3: NF EN 14774-3; AFNOR - XP CEN/TS 14775: NF EN 14775
450 Aguiar L, Márquez-Montesinos F, Gonzalo A, et al (2008) Influence of temperature and
451 particle size on the fixed bed pyrolysis of orange peel residues. J Anal Appl
452 Pyrolysis 83:124–130. https://doi.org/10.1016/j.jaap.2008.06.009
453 Ahmad Taghizadeh-Alisaraei , Seyyed Hasan Hosseini, Barat Ghobadian AM (2016)
454 Biofuel production from citrus wastes: A feasibility study in Iran. Renew Sustain
455 Energy Rev 69:1100–1112. https://doi.org/10.1016/j.rser.2016.09.102
20456 Alvarez J, Hooshdaran B, Cortazar M, et al (2018) Valorization of citrus wastes by fast
457 pyrolysis in a conical spouted bed reactor. Fuel 224:111–120.
458 https://doi.org/10.1016/j.fuel.2018.03.028
459 Anukam AI, Mamphweli SN, Reddy P, Okoh OO (2016) Characterization and the effect
460 of lignocellulosic biomass value addition on gasification efficiency. Energy Explor
461 Exploit 34:865–880. https://doi.org/10.1177/0144598716665010
462 Arni S Al (2017) Comparison of slow and fast pyrolysis for converting biomass into
463 fuel. Renew Energy 124:197–201. https://doi.org/10.1016/j.renene.2017.04.060
464 Ben Hassen Trabelsi A, Zaafouri K, Baghdadi W, et al (2018) Second generation
465 biofuels production from waste cooking oil via pyrolysis process. Renew Energy
466 126:888–896. https://doi.org/10.1016/j.renene.2018.04.002
467 Bensidhom G, Hassen-trabelsi A Ben, Alper K, et al (2017) Pyrolysis of Date palm
468 waste in a fixed-bed reactor: characterization of pyrolytic products. Bioresour
469 Technol. https://doi.org/10.1016/j.biortech.2017.09.066
470 Bhattacharjee N, Biswas AB (2019) Pyrolysis of orange bagasse: Comparative study
471 and parametric influence on the product yield and their characterization. J Environ
472 Chem Eng 7:102903. https://doi.org/10.1016/j.jece.2019.102903
473 Boluda-Aguilar M, García-Vidal L, González-Castañeda F d P, López-Gómez A (2010)
474 Mandarin peel wastes pretreatment with steam explosion for bioethanol
475 production. Bioresour Technol 101:3506–3513.
476 https://doi.org/10.1016/j.biortech.2009.12.063
477 Boluda-Aguilar M, López-Gómez A (2012) Production of bioethanol by fermentation of
21478 lemon (Citrus limon L.) peel wastes pretreated with steam explosion. Ind Crop
479 Prod 41:188–197. https://doi.org/10.1016/j.indcrop.2012.04.031
480 Cao X, Zhong L, Peng X, et al (2014) Comparative study of the pyrolysis of
481 lignocellulose and its major components: Characterization and overall distribution
482 of their biochars and volatiles. Bioresour Technol 155:21–27.
483 https://doi.org/10.1016/j.biortech.2013.12.006
484 Chiodo V, Urbani F, Zafarana G, et al (2017a) Syngas production by catalytic steam
485 gasification of citrus residues. Int J Hydrogen Energy 42:28048–28055.
486 https://doi.org/10.1016/j.ijhydene.2017.08.085
487 Chiodo V, Urbani F, Zafarana G, et al (2017b) Syngas production by catalytic steam
488 gasification of citrus residues. Int J Hydrogen Energy 1–8.
489 https://doi.org/10.1016/j.ijhydene.2017.08.085
490 Demiral I, Asl E (2011) Pyrolysis of grape bagasse : Effect of pyrolysis conditions on
491 the product yields and characterization of the liquid product. Bioresour Technol
492 102:3946–3951. https://doi.org/10.1016/j.biortech.2010.11.077
493 Dhyani V, Bhaskar T (2017) A comprehensive review on the pyrolysis of
494 lignocellulosic biomass. Renew Energy 129 part B:695–716.
495 https://doi.org/10.1016/j.renene.2017.04.035
496 Fernandez A, Saffe A, Pereyra R, et al (2016) Kinetic study of regional agro-industrial
497 wastes pyrolysis using non-isothermal tga analysis. Appl Therm Eng 106:1157–
498 1164. https://doi.org/10.1016/j.applthermaleng.2016.06.084
499 Ghanem Romdhane N, Bonazzi C, Kechaou N, Mihoubi NB (2015) Effect of Air-
22500 Drying Temperature on Kinetics of Quality Attributes of Lemon (Citrus limon cv.
501 lunari) Peels. Dry Technol 33:1581–1589.
502 https://doi.org/10.1080/07373937.2015.1012266
503 GIFruits 2018 GIFruits – Groupement Interprofessionnel des Fruits – Tunisie 2018
504 He M, Xiao B, Hu Z, et al (2009) Syngas production from catalytic gasification of
505 waste polyethylene : Influence of temperature on gas yield and composition. Int J
506 Hydrogen Energy 34:1342–1348. https://doi.org/10.1016/j.ijhydene.2008.12.023
507 Kim B-S, Kim Y-M, Jae J, et al (2015a) Pyrolysis and catalytic upgrading of Citrus
508 unshiu peel. Bioresour Technol 194:312–319.
509 https://doi.org/10.1016/j.biortech.2015.07.035
510 Kim B-SS, Kim Y-MM, Jae J, et al (2015b) Pyrolysis and catalytic upgrading of Citrus
511 unshiu peel. Bioresour Technol 194:312–319.
512 https://doi.org/10.1016/j.biortech.2015.07.035
513 Liu WJ, Li WW, Jiang H, Yu HQ (2017) Fates of Chemical Elements in Biomass
514 during Its Pyrolysis. Chem Rev 117:6367–6398.
515 https://doi.org/10.1021/acs.chemrev.6b00647
516 Lopez-Velazquez MA, Santes V, Balmaseda J, Torres-Garcia E (2013) Pyrolysis of
517 orange waste: A thermo-kinetic study. J Anal Appl Pyrolysis 99:170–177.
518 https://doi.org/10.1016/j.jaap.2012.09.016
519 M’hiri N, Ioannou I, Mihoubi Boudhrioua N, Ghoul M (2015) Effect of different
520 operating conditions on the extraction of phenolic compounds in orange peel. Food
521 Bioprod Process 96:161–170. https://doi.org/10.1016/j.fbp.2015.07.010
23522 Mahato N, Sharma K, Sinha M, et al (2020) Bio-sorbents , industrially important
523 chemicals and novel materials from citrus processing waste as a sustainable and
524 renewable bioresource : A review. J Adv Res 23:61–82.
525 https://doi.org/10.1016/j.jare.2020.01.007
526 Miranda R, Bustos-Martinez D, Blanco CS, et al (2009) Pyrolysis of sweet orange
527 (Citrus sinensis) dry peel. J Anal Appl Pyrolysis 86:245–251.
528 https://doi.org/10.1016/j.jaap.2009.06.001
529 Morales S, Miranda R, Bustos D, et al (2014) Solar biomass pyrolysis for the
530 production of bio-fuels and chemical commodities. J Anal Appl Pyrolysis 109:65–
531 78. https://doi.org/10.1016/j.jaap.2014.07.012
532 Negro V, Ruggeri B, Fino D (2018) Recovery of Energy from Orange Peels Through
533 Anaerobic Digestion and Pyrolysis Processes after d-Limonene Extraction. Waste
534 and Biomass Valorization 9:1331–1337. https://doi.org/10.1007/s12649-017-9915-
535 z
536 Pathak PD, Mandavgane SA, Kulkarni BD (2017) Fruit peel waste: Characterization
537 and its potential uses. Curr Sci 113:444–454.
538 https://doi.org/10.18520/cs/v113/i03/444-454
539 Patsalou M, Chrysargyris A, Tzortzakis N, Koutinas M (2020) A biorefinery for
540 conversion of citrus peel waste into essential oils, pectin, fertilizer and succinic
541 acid via different fermentation strategies. Waste Manag 113:469–477.
542 https://doi.org/10.1016/j.wasman.2020.06.020
543 Patsalou M, Samanides CG, Protopapa E, et al (2019) A Citrus Peel Waste Biorefinery
24544 for Ethanol and Methane Production. molecules 24:2451
545 Primaz CT, Schena T, Lazzari E, et al (2018) Influence of the temperature in the yield
546 and composition of the bio-oil from the pyrolysis of spent co ff ee grounds :
547 Characterization by comprehensive two dimensional gas chromatography. Fuel
548 232:572–580. https://doi.org/10.1016/j.fuel.2018.05.097
549 Sharma K, Mahato N, Lee YR (2018) Extraction, characterization and biological
550 activity of citrus flavonoids. Rev Chem Eng 35:265–284.
551 https://doi.org/10.1515/revce-2017-0027
552 Siles JA, Vargas F, Gutiérrez MC, et al (2016) Integral valorisation of waste orange
553 peel using combustion, biomethanisation and co-composting technologies.
554 Bioresour Technol 211:173–182. https://doi.org/10.1016/j.biortech.2016.03.056
555 Siles López QL& IPT, ToLópez S, Li Q, et al (2010) Biorefinery of waste orange peel.
556 Crit Rev Biotechnol 30:63–69. https://doi.org/10.3109/07388550903425201
557 Sukumar V, Manieniyan V, Senthilkumar R, Sivaprakasam S (2020) Production of bio
558 oil from sweet lime empty fruit bunch by pyrolysis. Renew Energy 146:309–315.
559 https://doi.org/10.1016/j.renene.2019.06.156
560 Varma AK, Mondal P (2016) Physicochemical characterization and kinetic study of
561 pine needle for pyrolysis process. J Therm Anal Calorim 124:487–497.
562 https://doi.org/10.1007/s10973-015-5126-7
563 Volpe M, Panno D, Volpe R, Messineo A (2015) Upgrade of citrus waste as a biofuel
564 via slow pyrolysis. J Anal Appl Pyrolysis 115:66–76.
565 https://doi.org/10.1016/j.jaap.2015.06.015
25566 Volpe R, Menendez JMB, Reina TR, et al (2017) Evolution of chars during slow
567 pyrolysis of citrus waste. Fuel Process Technol 158:255–263.
568 https://doi.org/10.1016/j.fuproc.2017.01.015
569 Wang S, Jiang D, Cao B, et al (2018) Bio-char and bio-oil characteristics produced from
570 the interaction of Enteromorpha clathrate volatiles and rice husk bio-char during
571 co-pyrolysis in a sectional pyrolysis furnace: A complementary study. J Anal Appl
572 Pyrolysis 135:219–230. https://doi.org/10.1016/j.jaap.2018.08.030
573 Wei Y, Li J, Shi D, et al (2017) Resources , Conservation and Recycling Environmental
574 challenges impeding the composting of biodegradable municipal solid waste : A
575 critical review. "Resources, Conserv Recycl 122:51–65.
576 https://doi.org/10.1016/j.resconrec.2017.01.024
577 Yin C-Y (2011) Prediction of higher heating values of biomass from proximate and
578 ultimate analyses Chun-Yang. Fuel 90:1128–1132.
579 https://doi.org/10.1016/j.fuel.2010.11.031
580 Zaafouri K, Ben Hassen Trabelsi A, Krichah S, et al (2016) Enhancement of biofuels
581 production by means of co-pyrolysis of Posidonia oceanica (L.) and frying oil
582 wastes: Experimental study and process modeling. Bioresour Technol 207:387–
583 398. https://doi.org/10.1016/j.biortech.2016.02.004
584 Zema DA, Calabrò PS, Folino A, et al (2018) Valorisation of citrus processing waste :
585 A review. Waste Manag 80:252–273.
586 https://doi.org/10.1016/j.wasman.2018.09.024
587 Zhou D, Zhang L, Zhang S, et al (2010) Hydrothermal Liquefaction of Macroalgae
26588 Enteromorpha prolifera to Bio-oil. Energy and Fuels 24:4054–4061.
589 https://doi.org/10.1021/ef100151h
590
591
27Figures Figure 1 Schematic of pyrolysis system used in LPW (Ben Hassen et al. 2018) 1: N2 gas cylinder; 2: Heating control panel; 3: control transfer; 4: N2 Inlet; 5: Thermocouple; 6: 162 WCO; 7: pyrolysis reactor; 8: Electrical furnace; 9: Vapors outlet; 10: Condensation system; 11: 163 Liquid fraction ; 12: non condensable gases; 13: Gas puri cation system ; 14: Activated carbon 164 column ; 15: gas lter ; 16: Gas analyzer ; 17: Laptop for data acquisition.
Figure 2

Thermo Gravimetric Analysis of Lemon Peel Waste

Figure 3
FTIR spectrum of Lemon Peel Waste

Figure 4

Yields of pyrolysis products obtained at 300, 400 and 500°C from Lemon Peel Waste at heating rate of
10°C/min

Figure 5
FTIR spectrums of bio-char (a) and bio-oil (b)

Figure 6

Distribution of organic compounds in bio-oil samples produced under different temperatures
You can also read