PROCESSES FOR THE PRODUCTION OF TRANSPORTATION FUEL VIA DEOXYGENATED BIO-OIL - f3 centre
←
→
Page content transcription
If your browser does not render page correctly, please read the page content below
PUBLICATION FDOS 47:2022

 Final report

 PROCESSES FOR THE PRODUCTION OF
 TRANSPORTATION FUEL VIA DEOXYGENATED
 BIO-OIL

 May 2022

 Lucio Rodrigo Alejo Vargas1, Shivani Ramprasad Jambur1, Pontus Bokinge2,
 Gopi Subramaniam3, Elin Svensson2, Simon Harvey3, Rolf Ljunggren4, Klas Engvall1,
 Shareq Mohd Nazir1*
 1 KTH Royal Institute of Technology
 2 CIT Industriell Energi AB
 3 Chalmers University of Technology
 4 Cortus Energy AB

 *Corresponding author: Shareq Mohd Nazir, smnazir@kth.se

A project within

RENEWABLE TRANSPORTATION FUELS AND SYSTEMS 2018-2021
A collaborative research program between the Swedish Energy Agency and
f3 The Swedish Knowledge Centre for Renewable Transportation Fuels

 www.energimyndigheten.se www.f3centre.se
PROCESSES FOR THE PRODUCTION OF TRANSPORTATION FUEL VIA DEOXYGENATED BIO-OIL

FDOS 47:2022 2
PROCESSES FOR THE PRODUCTION OF TRANSPORTATION FUEL VIA DEOXYGENATED BIO-OIL

PREFACE
This project has been carried out within the collaborative research program Renewable transporta-
tion fuels and systems (Förnybara drivmedel och system), Project no. 50466-1. The project has
been financed by the Swedish Energy Agency and f3 – Swedish Knowledge Centre for Renewable
Transportation Fuels.

The Swedish Energy Agency is a government agency subordinate to the Ministry of Infrastructure.
The Swedish Energy Agency is leading the energy transition into a modern and sustainable, fossil
free welfare society and supports research on renewable energy sources, the energy system, and
future transportation fuels production and use.

f3 Swedish Knowledge Centre for Renewable Transportation Fuels is a networking organization
which focuses on development of environmentally, economically and socially sustainable renewa-
ble fuels. The f3 Centre is financed jointly by the centre partners and the region of Västra Götaland.
Chalmers Industriteknik functions as the host of the f3 organization
(seehttps://f3centre.se/en/about-f3/).

Acknowledgments

The authors acknowledge the financial support received from Swedish Energy Agency and f3
Swedish Knowledge Centre for Renewable Transportation Fuels for the project.

This report should be cited as:

Vargas, L.R.A, Jambur, S.R., Bokinge, P., Subramaniam, G., Svensson, E., Harvey, S., Ljunggren,
R. Engvall, K. & Nazir, S.M. (2022) Processes for the Production of Transportation Fuel via
Deoxygenated Bio-Oil. Publ. No FDOS 47:2022. Available at https://f3centre.se/en/renewable-
transportation-fuels-and-systems/

FDOS 47:2022 3
PROCESSES FOR THE PRODUCTION OF TRANSPORTATION FUEL VIA DEOXYGENATED BIO-OIL

FDOS 47:2022 4
PROCESSES FOR THE PRODUCTION OF TRANSPORTATION FUEL VIA DEOXYGENATED BIO-OIL

SUMMARY
Sweden aims to achieve net-zero greenhouse gas (GHG) emissions by 2045. This will require a re-
duction of GHG emissions from domestic transport (excluding aviation) by 70% by 2030 with re-
spect to the levels in 2010. An important element for achieving this is Sweden's resources of sus-
tainable biomass in the form of forestry and agricultural residues, which can be used as raw materi-
als for the production of renewable fuels for the transport sector to accelerate the transition to net-
zero greenhouse gas emissions. Biofuels currently account for 19.5%, or 16 TWh/year, of the entire
Swedish transport sector's energy needs, which is forecasted to increase to 38 TWh/year by 2045.
Today, mainly ethanol, FAME (i.e. Fatty Acid Methyl Esther) and hydro-treated vegetable oils
(HVO) are used as "drop-in" fuels, where increased use is limited by the compatibility with the ve-
hicle fleet and the availability of raw materials. The production of hydrocarbon-based fuels such as
petrol and diesel from bio-based raw materials would provide greater benefits in terms of the possi-
bility of utilizing the existing industrial processes, distribution networks and the compatibility with
the existing vehicle fleet. This is also in line with the Swedish Energy Agency's priority to produce
"drop-in" fuels from bio-based waste raw materials. Fast pyrolysis at elevated temperature is an at-
tractive process for the production of bio-oils, which can be used directly by today's refinery indus-
try for petrol and diesel production with residual biomass as raw material. Bio-oil from fast pyroly-
sis, however, contains a larger amount of oxygen (35-40% by weight), which makes the oil unsta-
ble and therefore not suitable for primarily storage or longer transport. Therefore, depending on the
location of the pyrolysis process, the oxygen must be removed from the bio-oil, which can be done
by a reaction with hydrogen in a hydro-deoxygenation (HDO) process. The process requires rela-
tively large amounts of hydrogen of between 40-100 kg of hydrogen per tonne of dry biomass. This
means, to achieve the 2045 targets, we will need 0.17-0.42 million tonnes of hydrogen per year for
the HDO process. Therefore, hydrogen generation is a key element in producing biooils that can be
further converted into drop-in fuels.

The main aim of this study is to increase knowledge in techno-economic performance of integrat-
ing hydrogen generation processes with pyrolysis and HDO step to produce deoxygenated bio-oil.
This study also presents a first-of-its-kind techno-economic analysis of integrating vapor phase
HDO step with pyrolysis to generate hydro-deoxygenated bio-oils. Four process pathways are pre-
sented in this study. The first three process pathways include biomass fast pyrolysis and vapor
phase HDO step integrated with different hydrogen generation processes (i) natural gas reforming
(ii) electrolysis (iii) biomass gasification. The fourth process pathway is the in-situ catalytic hydro-
pyrolysis and hydro-conversion process, named as IH2. In-house process models for fast pyrolysis
and HDO step have been developed in this project with the aid of thermodynamic, kinetic and ex-
perimental data available in literature. The mass and energy balance for the IH2 process is estab-
lished based on the published data available from the experience of technology provider. The pro-
cesses have also been analyzed when integrated with CO2 capture and storage (CCS) for the cases
with hydrogen generation from natural gas and biomass gasification. The economic and GHG
emission assessment has been carried out for two scenarios, Sustainable Development (SD) and
New Policies (NP) scenarios. The main difference in the two scenarios is that the SD scenario as-
sumes biomass to be a limited resource while the NP scenario assumes it to be unlimited.

The IH2 process, which is an in-situ catalytic hydro-pyrolysis and hydro-conversion process, out-
performs the other process routes in terms of both process and economic performance. The bio-oil

FDOS 47:2022 5
PROCESSES FOR THE PRODUCTION OF TRANSPORTATION FUEL VIA DEOXYGENATED BIO-OIL

yield, carbon recovery and system efficiency of the IH2 process is higher than other process routes.
Among the other process routes, integrating electrolysis with pyrolysis and HDO step has a higher
carbon recovery while having higher system efficiency than the process route with biomass gasifi-
cation. However, the process with biomass gasification integrated with HDO step has lower pro-
duction costs in the NP scenario. In addition, this process route will offer additional cost benefits if
integrated with CO2 capture and Storage when negative emissions are incentivized.

This topic requires further research to demonstrate vapor phase HDO step experimentally while de-
veloping suitable high-performance catalysts. The study also shows that more than 55% of the car-
bon from the process is lost in the form of CO2 from the process. Therefore, CO2 utilization
through either in-situ recycling or ex-situ downstream synthesis of fuels will enable higher carbon
recovery in the form of biofuels and result in efficient sustainable biomass utilization.

FDOS 47:2022 6
PROCESSES FOR THE PRODUCTION OF TRANSPORTATION FUEL VIA DEOXYGENATED BIO-OIL

SAMMANFATTNING
Sverige har som mål att uppnå nollutsläpp av växthusgaser fram till 2045. Detta kräver en minsk-
ning av växthusgasutsläppen från inrikes transporter (exklusive flyg) med 70 % år 2030 relativt ni-
våerna 2010. En viktig tillgång för att uppnå detta är Sveriges tillgångar av hållbar biomassa i form
av skogs- och jordbruksrester, som kan användas som råvaror för produktion av förnybara drivme-
del för transportsektorn, vilket kan påskynda övergången till nollutsläpp av växthusgaser. Biodriv-
medel står idag för 19,5 %, eller 16 TWh/år, av hela svenska transportersektorns energibehov, vil-
ket förutspås öka till 38 TWh/år till år 2045. Idag används främst etanol, FAME (dvs. Fatty Acid
Methyl Esther) och hydrerade vegetabiliska oljor, s.k. HVO (hydrogeneated vegetable oils), som
”drop-in” bränslen, där en utökad användning begränsas av kompatibiliteteten med fordonsflottan
och tillgången på råvara. En produktion av kolvätebaserade drivmedel som bensin och diesel från
biobaserad råvara skulle ge större fördelar i form av möjligheten att utnyttja de befintliga industri-
ella processerna, distributionsnäten och kompatibiliteteten med den befintliga fordonsflottan. Detta
är även i linje med Energimyndighetens prioritering att producera ”drop-in” bränslen från biobase-
rade avfallsråvaror. Snabb pyrolys vid förhöjd temperatur är en attraktiv process för produktion av
biooljor, som direkt kan användas av dagens raffinaderiindustri för bensin- och dieselproduktion
med restbiomassa som råvara. Bioolja från snabb pyrolys innehåller dock en större mängd syre (35-
40 vikt-%), vilket gör oljan instabil och därför inte lämpar sig för främst lagring eller längre trans-
porter. Syret måste därför beroende på placeringen av pyrolysprocessen avlägsnas från biooljan,
vilket kan göras genom en reaktion med vätgas i en HDO-process (HDO-hydrodeoxygenation).
Processen kräver förhållandevis stora mängder vätgas på mellan 40 - 100 kg vätgas per ton torr bio-
massa, vilket innebär att vi behöver mellan 0,17-0,42 miljoner ton vätgas per år för HDO-proces-
sen. Vätgasgenerering är därför en nyckelprocess för produktion av biooljor, som kan vidareföräd-
las till drop-in bränslen.

Huvudsyftet med studien var att öka kunskapen om teknisk-ekonomisk prestanda för produktion av
deoxygenerad bioolja i integrerade processer där produktion av vätgas, pyrolys av restbiomassa till-
sammans med ett HDO-processteg för direkt dexygenering av pyrolysoljan i ångfas ingår. Fyra
processvägar undersöks i studien, där de första tre processvägarna, inkluderar snabb pyrolys av
restbiomassa och ett HDO-processteg, integrerat med olika processer för vätegasproduktion: (i) re-
formering av naturgas (ii) elektrolys (iii) förgasning av restbiomassa. Den fjärde processvägen är
en process, IH2-processen, där vätgasen introduceras redan vid den primära omvandlingen av rest-
biomassa till biolja i en katalytisk pyrolysprocess. Vätgasen produceras från restgaser internt i pro-
cessen. Vi har utvecklat egna modeller för processerna snabb pyrolys och HDO-steget med hjälp av
teoretiska och experimentella data tillgängliga i litteraturen. Material- och energibalansen för IH2-
processen baseras på publicerade data och erfarenheten publicerade av teknikleverantören. En ana-
lys av en integrering av CO2-infångning och lagring (CCS - CO2 capture and storage) utfördes även
för de fallen med vätgasproduktion från naturgas och biomassaförgasning. Den ekonomiska be-
dömningen och utsläppen av växthusgaser har utförts för två scenarier, hållbar utveckling och nya
riktlinjer. Den största skillnaden mellan de två scenarierna är att scenariot för hållbar utveckling an-
tar att restbiomassa är en begränsad resurs medan scenariot för nya riktlinjer antar att den är obe-
gränsad.

Resultaten visar att IH2-processen, där vätgasen introduceras i en katalytisk pyrolysprocess, över-
träffar de andra processvägarna både när det gäller process och ekonomisk prestanda. Utbytet av

FDOS 47:2022 7
PROCESSES FOR THE PRODUCTION OF TRANSPORTATION FUEL VIA DEOXYGENATED BIO-OIL

bioolja, kolomvandlingen och totalprocessens verkningsgrad är högre för IH2-processen än för de
andra processvägarna. För de övriga tre processvägarna så ger en integrering av elektrolys för vät-
gasproduktion en högre kolomsättning och en högre processverkningsgrad än för fallet där förgas-
ning restbiomassa används för vätgasproduktion. Processen där förgasning av restbiomassa integre-
rats tillsammans med HDO-steget har dock lägre produktionskostnader i scenariot för nya riktlin-
jer. Dessutom erbjuder denna processväg ytterligare kostnadsfördelar om den integreras med CO2-
avskiljning och lagring, vilket möjliggör negativa utsläpp av CO2.

HDO-processen för en direkt omvandling pyrolysolja i ångfas för att minska mängden syre i den
producerade pyrolysoljan kräver i dagsläget ytterligare FoU för att utveckla lämpliga högpreste-
rande katalysatorer och demonstrera teknologin experimentellt. Studien visar även att mer än 55 %
av kolet från processen går förlorat i form av CO2. Därför kommer möjligheten att utnyttja CO2 an-
tingen internt i processen eller externt i syntesprocesser för produktion av biodrivmedel vara viktigt
för att minska kolförlusterna (ökad kolomsättning) och därmed ett effektivare utnyttjande av rest-
biomassa som råvara.

FDOS 47:2022 8
PROCESSES FOR THE PRODUCTION OF TRANSPORTATION FUEL VIA DEOXYGENATED BIO-OIL

CONTENTS
1 INTRODUCTION......................................................................................................15
2 PROCESS DESCRIPTION AND PROCESS MODELLING ......................................19
 BIOMASS FAST PYROLYSIS AND HDO PROCESS ......................................19
 MEA SOLVENT BASED CO2 CAPTURE UNIT................................................31
 BIOMASS GASIFICATION ...............................................................................31
 HYDROGEN PRODUCTION FROM NATURAL GAS REFORMING ................35
 HYDROGEN PRODUCTION FROM ELECTROLYSIS .....................................36
 IH2 PROCESS .................................................................................................36
 BIOOIL TO TRANSPORTATION FUELS .........................................................37
3 PROPOSED PROCESS SCENARIOS.....................................................................38
4 METHODOLOGY .....................................................................................................39
 PROCESS PERFORMANCE ...........................................................................39
 ECONOMIC AND GHG ASSESSMENT ...........................................................40
5 RESULTS AND DISCUSSION .................................................................................49
 RESULTS FOR PROCESS PERFORMANCE..................................................49
 ECONOMIC AND GHG ASSESSMENT RESULTS ..........................................52
6 CONCLUSIONS .......................................................................................................56

REFERENCES ................................................................................................................58

APPENDIX ......................................................................................................................63
 DETAILED PROCESS ANALYSIS OF BIOMASS FAST PYROLYSIS AND HDO ........63
 EFFECT OF HYDROGEN FLOW TO HDO STEP ON BIO-OIL PRODUCTION ...........66
 EFFECT OF DIFFERENT BIOMASS SPECIES ON BIO-OIL PRODUCTION ..............67
 MODELLING OF BIOMASS GASIFICATION PROCESS IN ASPEN PLUS .................67
 ANALYSIS OF BIOMASS GASIFICATION PROCESS ................................................75
 PROCESS DESCRIPTION FOR SCENARIOS REF3 AND REF4 AS PROPOSED IN
 TABLE 7.......................................................................................................................76
 ANALYSIS OF REF1 SCENARIO ................................................................................80
 BIOMASS SPECIES AND THEIR COMPOSITION ......................................................81

 FDOS 47:2022 9
PROCESSES FOR THE PRODUCTION OF TRANSPORTATION FUEL VIA DEOXYGENATED BIO-OIL

 COMPONENTS OF BIOMASS CONSIDERED IN MODELLING OF FAST PYROLYSIS
 IN ASPEN PLUS ..........................................................................................................82
 THERMOPHYSICAL PROPERTIES OF BIOMASS INTRODUCED IN MODELLING OF
 PROCESS USING ASPEN PLUS ................................................................................83
 KINETIC SCHEMES FOR BIOMASS FAST PYROLYSIS PROCESS REPORTED IN
 LITERATURE ...............................................................................................................85
 SUMMARY OF REVIEW FOR VAPORT PHASE HDO PROCESS ..............................88
 ASSUMPTIONS FOR YIELD IN MODELLING HDO STEP ..........................................90
 PROCESS DETAILS FOR DIFFERENT BIOMASS SPECIES .....................................91
 PROCESS DETAILS FOR REF4, CCS2, CCS3, CCS4 AND CCS5 CASES................93

FDOS 47:2022 10
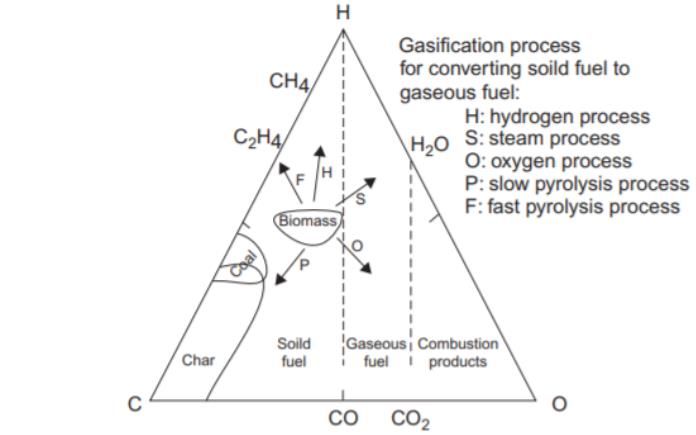
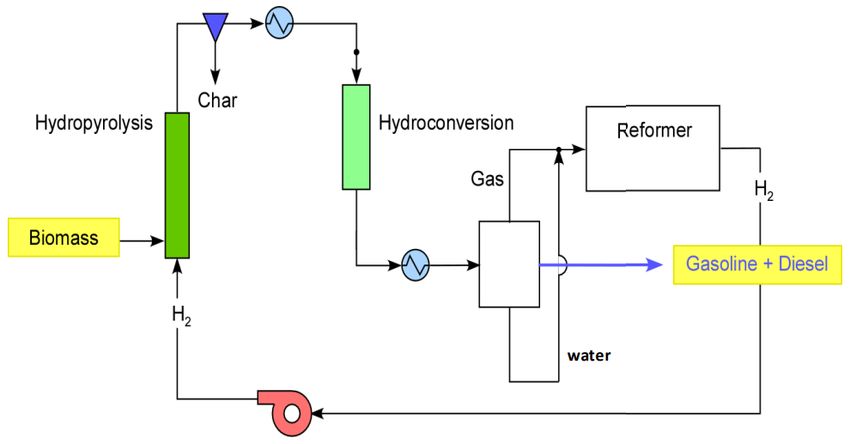
PROCESSES FOR THE PRODUCTION OF TRANSPORTATION FUEL VIA DEOXYGENATED BIO-OIL

LIST OF FIGURES
Figure 1. C-H-O ternary diagram for biomass conversion (Source for figure: [5]). The figure shows
the main products from biomass conversion through different processes. Bio-oil is the key product
obtained from fast pyrolysis route (indicated as F in the figure, pointing towards mainly pyrolysis
vapors containing biooils and non-condensable gases). ................................................................... 16

Figure 2. Different routes for hydrogen and deoxygenated bio-oil production. Blue boundary is for
the process that uses hydrogen for HDO from electrolysis. Green boundary is for the process where
hydrogen is generated from biomass or char gasification. The grey boundary is for the process
route that has NG reforming for hydrogen production for HDO. The red boundary is the IH2
process. NCG is the abbreviation for non-condensable gases. For the cases with biomass
gasification and NG reforming, analysis have also been performed for the process integrated with
CCS. ................................................................................................................................................. 18

Figure 3. Simplified process flow diagram of biomass fast pyrolysis process. ............................... 20

Figure 4. Process flow of the biomass fast pyrolysis process in Aspen Plus. The details in the
figures are described in the sections below. ..................................................................................... 22

Figure 5. Fast Pyrolysis reactor model in Aspen Plus. .................................................................... 28

Figure 6. Conversion of the fast pyrolysis stream to conventional components as modelled in
Aspen Plus........................................................................................................................................ 28

Figure 7. HDO unit in Aspen Plus. .................................................................................................. 29

Figure 8. Biomass gasification process diagram flow in the plant of Güssing, Austria. Source:
https://web.archive.org/web/20120324011457/http://www.ficfb.at/. .............................................. 32

Figure 9. Fast Internally Circulating Fluidized Bed (FCICFB) schematic diagram (Source: [31]). 33

Figure 10. Water gas shift section diagram flow as modelled in Aspen Plus. ................................. 34

Figure 11. Intercooled syngas compressor train and PSA section as modelled in Aspen Plus. ....... 35

Figure 12. Schematic of the SMR plant using FTR for the reforming of Natural gas – Reproduced
from Nazir et al. [27]. ....................................................................................................................... 35

Figure 13. Simple process flow schematic of IH2 process as proposed by GTI (Source: [34]). ..... 37

Figure 14. Assumed mass balance for refinery processing of the produced deoxygenated bio-oil. 37

Figure 15. System boundaries and inputs/outputs considered for the GHG assessment. PINK:
Included in all process routes, ORANGE: Included in all fast pyrolysis routes, BLUE:
Pyrolysis/electrolysis route (Ref2), GREY: Pyrolysis/steam reforming route (Ref1, CCS1),
GREEN: Pyrolysis/gasification route (Ref3-4, CCS4), RED: Hydro pyrolysis route (IH2). (+)
denotes inputs and (-) denotes outputs/products. ............................................................................. 47

 FDOS 47:2022 11
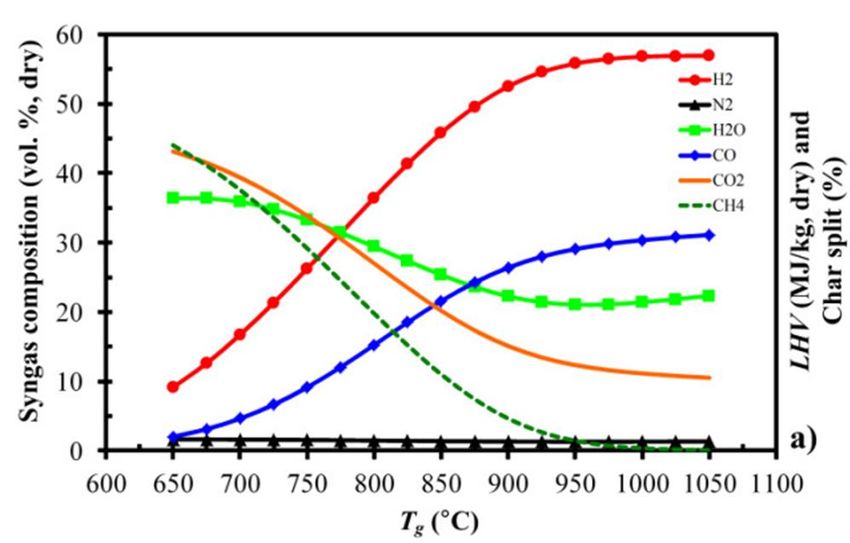
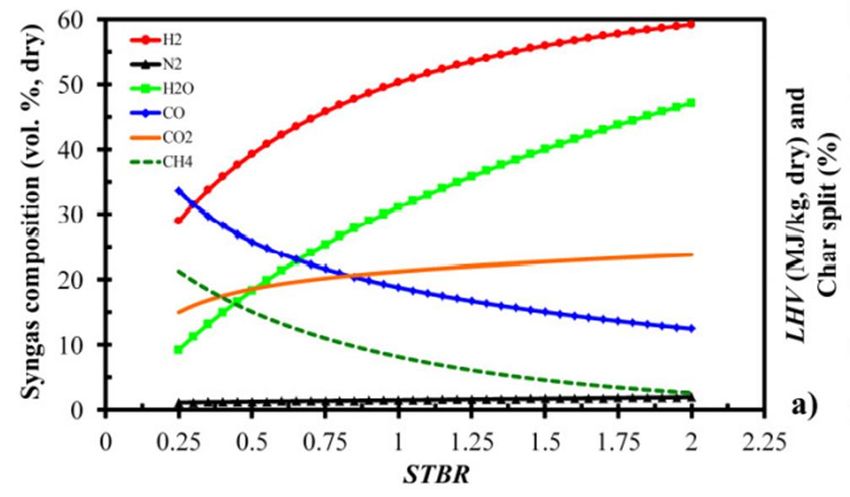
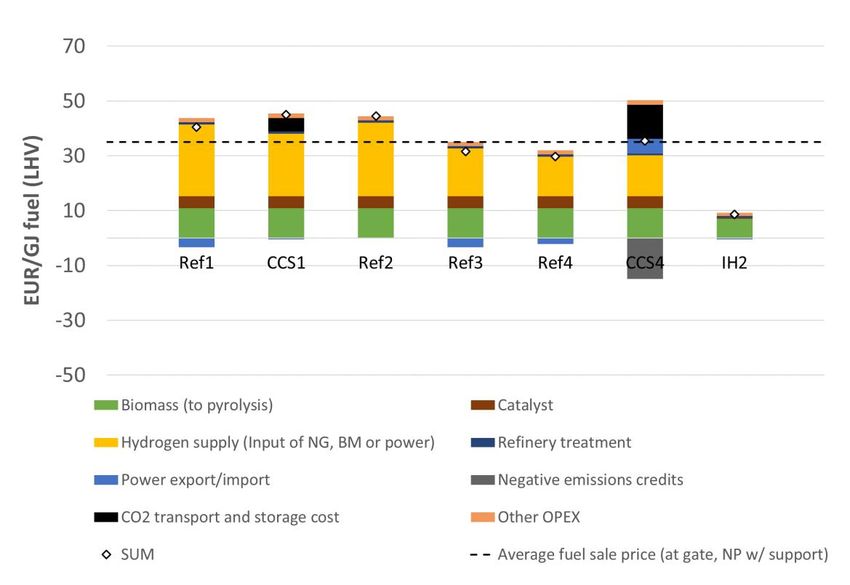
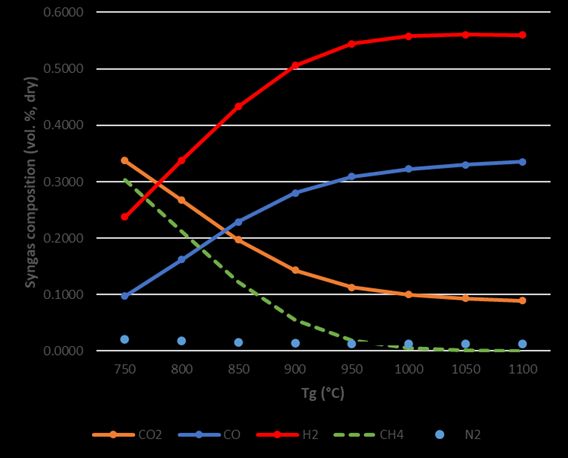
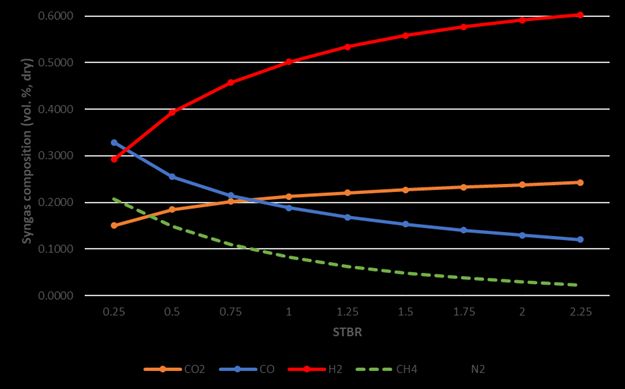
PROCESSES FOR THE PRODUCTION OF TRANSPORTATION FUEL VIA DEOXYGENATED BIO-OIL

 Figure 16. Total fuel production OPEX for the investigated biofuel pathways in the ENPAC (a)
SD Scenario and (b) NP Scenario. The resulting investment opportunity (in terms of annualized
TCI) is calculated as the fuel sale price (dashed line) minus the OPEX sum (diamonds). If OPEX is
lower than the sales price, the investment opportunity can be read as the distance between the
OPEX sum and the dashed lines in the figure. The fuel sale price is the average biofuel sale price at
gate calculated from diesel and gasoline prices and the diesel/gasoline product split. Ref1: Natural
gas, CCS1: Natural gas with CCS applied to fossil CO2-emissions, Ref2: Electrolysis, Ref3:
Gasification, Ref4: Gasification with char utilization, CCS4: Gasification with char utilization and
BECCS applied to all CO2 emissions. IH2: IH2 process based on work by [35]. ........................... 53

Figure 17. Well-to-gate + combustion emissions for the process routes investigated in this work.
(a): emission factors from ENPAC Scenario SD. The dashed line represents the 65% emission
reduction limit for transportation fuels in REDII. The comparison to REDII is only relevant for
scenario NP. (b): emission factors from ENPAC Scenario NP. Ref1: Natural gas, CCS1: Natural
gas with CCS applied to fossil CO2-emissions, Ref2: Electrolysis, Ref3: Gasification, Ref4:
Gasification with char utilization, CCS4: Gasification with char utilization and BECCS applied to
all CO2 emissions. IH2: IH2 process based on work by [P5]. Note the y-axis breaks in the positive
and negative direction, since the values are significantly higher for two points. ............................. 55

Figure 18. Bio-oil produced vs Supplied Hydrogen......................................................................... 66

Figure 19. Overall flowsheet of the biomass gasification process in Aspen Plus. ........................... 69

 Figure 20. Effect of gasification temperature on the syngas composition by the model of Doherty
et al. [31]. ......................................................................................................................................... 73

Figure 21. Effect of gasification temperature on the syngas composition by our model. ............... 73

 Figure 22. Effect of steam to biomass ratio on the syngas composition by the model of Doherty et
al. [31]. ............................................................................................................................................. 74

Figure 23. Effect of steam to biomass ratio on the syngas composition by our model. .................. 74

 FDOS 47:2022 12
PROCESSES FOR THE PRODUCTION OF TRANSPORTATION FUEL VIA DEOXYGENATED BIO-OIL

LIST OF TABLES
Table 1. Assumed (dried) biomass composition in pyrolysis step in the analysis (Composition is
similar to the composition of dried Douglas fir wood belonging to the pine family). (Source [21])23

Table 2. Different components in biomass, intermediate species and end-products involved in the
fast pyrolysis process. Non-biomass components are also listed in the table. ................................. 24

Table 3. Required estimated properties for the solid and conventional components. ...................... 25

Table 4. Adapted multistep kinetic scheme of the biomass fast pyrolysis process from the original
multistep kinetic scheme of Ranzi et al. [22]. [The kinetic data for *Reaction 14 reported in the
table is the modified value to fit the resulting product composition available in literature.
Comparison with the value from Ranzi et al. [22] is shown in Table 5]. (A is the pre-exponential
factor, x is the power to which temperature is raised in the equation, Ea is the activation energy).
Please refer to Table 2 and Table 26 (in Appendix) for definition of components in the reactions. 26

Table 5. Modified reaction from the original multistep kinetic scheme of Ranzi et al. [22]. This
table reports the adjustments we made in kinetic data for Reaction 14 with respect to literature ... 27

Table 6. Comparison between the experimental results of Caudle et al. [21] and our model. ......... 29

Table 7. Definition of different process scenarios. .......................................................................... 38

Table 8. Input data used to generate ENPAC scenarios, and the resulting output data used in GHG
and economic assessments in this work. .......................................................................................... 42

Table 9. Parameters and data used in the economic assessment. ..................................................... 44

Table 10. Summary of Total Capital Investment (TCI) estimates for the investigated process routes.
The studies by Jones et. al. and Dutta et.al. considered production of deoxygenated bio-oil with
hydrogen supply via steam methane reforming (i.e., Ref1 in the present study). An average of their
TCI estimates was used directly for Ref1. For other routes, TCI values were adjusted to account for
differences in hydrogen supply and the use of (BE)CCS, where relevant. All monetary values have
been escalated to EUR-2019 using the CEPCI composite index and annual average currency
exchange rates. IEC: Installed Equipment Cost, PEC: Purchased Equipment Cost......................... 46

Table 11. ENPAC GHG emission factors used in the GHG assessment. ........................................ 48

Table 12. Main results from process analysis. ................................................................................. 51

Table 13. Analysis of reference case pyrolysis process with HDO (irrespective of the source of
hydrogen). ........................................................................................................................................ 63

Table 14. Analysis of reference case pyrolysis process with HDO (irrespective of the source of
hydrogen) integrated with CO2 capture for combustion exhaust gases from pyrolysis unit. .......... 65

Table 15. Effect of Hydrogen flow to HDO step on bio-oil production. ......................................... 66

Table 16. Results of the fast pyrolysis process for different biomass species.................................. 67

 FDOS 47:2022 13
PROCESSES FOR THE PRODUCTION OF TRANSPORTATION FUEL VIA DEOXYGENATED BIO-OIL

Table 17. Biomass Gasification reactions specified in the model – Source: Doherty et al. [31]. .... 68

Table 18. Biomass composition. ...................................................................................................... 70

Table 19. Yield Distribution of each component based on the biomass ultimate analysis data. ...... 70

Table 20. Results for the biomass gasification process with CO2 capture. ...................................... 75

Table 21. Details of Ref 3 scenario. ................................................................................................. 77

Table 22. Details of the Ref4 scenario. ............................................................................................ 79

Table 23. Details of Ref1 scenario. .................................................................................................. 80

Table 24. Composition of the Douglas fir wood sample and Spruce samples from the work of
Caudle et al. [21] and Debiagi et al. [24]. ........................................................................................ 81

Table 25. Composition of the Pine samples from the work of Debiagi et al. [24]. .......................... 81

Table 26. Biomass components, intermediate species and end products involved in the fast
pyrolysis process, reproduced from the work of Gorensek et al. [25]. ............................................ 82

Table 27. Estimated properties for conventional solid components in pyrolysis process model.
Table reproduced from the work of Gorensek et al. [25]. ................................................................ 83

Table 28. Estimated properties for conventional fluid components in pyrolysis process model.
Table reproduced from the work of Gorensek et al. [25]. ................................................................ 84

Table 29. Original Multistep kinetic scheme of the biomass fast pyrolysis process. Table
reproduced from the work of Ranzi et al. [22]. ................................................................................ 85

Table 30. Simplified multistep kinetic scheme for biomass fast pyrolysis process, table reproduced
from the work of Caudle et al. [21]. ................................................................................................. 87

Table 31. Summary of review on vapor phase hydrodeoxygenation. .............................................. 88

Table 32. Carbon, oxygen and hydrogen wt% for hydro-deoxygenated bio-oil as reported in
literature. .......................................................................................................................................... 89

Table 33. Yield used in the HDO process model. ............................................................................ 90

Table 34. Analysis for Ref1 case when using different biomass types ............................................ 91

Table 35. Analysis for Ref2 case when using different biomass types ............................................ 91

Table 36. Analysis for Ref3 cases for different biomass types ........................................................ 92

Table 37. Process details for the Ref4 case ...................................................................................... 93

Table 38. Process details for the CCS2-5 cases ............................................................................... 93

 FDOS 47:2022 14
PROCESSES FOR THE PRODUCTION OF TRANSPORTATION FUEL VIA DEOXYGENATED BIO-OIL

1 INTRODUCTION
Sweden has the long-term goal to achieve net-zero greenhouse gas emissions by 2045. Throughout
this path there are different milestones that need to be achieved first, one of them is to have a vehi-
cle fleet independent of fossil fuels by 2030 [1]. According to the European Biofuels Technology
Platform, and an internal governmental investigation performed in 2013, one of the first steps to
achieve mentioned milestone would be by powering up approximately 50% of the passenger cars
on biofuels. However, achieving this sole milestone would require approximately 20 TWh of bio-
fuel production in Sweden. The feedstock for the production of this amount of biofuel is expected
to come from Sweden´s forest industries as a sustainable and resource efficient energy system [1].
Another key element that is used in the production of transportation fuels from biogenic feedstocks
biofuels and several other industrial processes is hydrogen, which is used in the hydrogenation and
hydrocracking processes of vegetable oils for the production of hydrogenated vegetable oil (HVO)
[2]. Thus, hydrogen plays an important role in Sweden’s bio-economy, since it is used in producing
the most common biofuel used in the transport sector, which is HVO, followed by fatty acid methyl
ester (FAME), ethanol and biogas [1].

In Sweden, the residues from the forest industries can be used as feedstock and treated via thermo-
chemical conversion, enabling in this manner the production of a variety of energy carriers and
chemicals, including transport fuels. One example of this thermochemical conversion processes is
the process called Pyrolysis. Pyrolysis is the heating of organic matter (temperatures are around
300-650°C) in an environment with no oxygen present, with the help of a catalyst. There are sev-
eral modes to run the pyrolysis in, but the two most common one is called fast pyrolysis and slow
pyrolysis. The difference between them is that fast pyrolysis takes only a few seconds (0.5-2 sec),
by using a higher operating temperature and a higher heating rate. Using fast pyrolysis can increase
the yield of pyrolysis oil (higher hydrocarbon fractions obtained after condensing pyrolysis vapors)
and lower the bio-char yield compared to the case when using slow pyrolysis [3], also seen in Fig-
ure 1. The aim with slow pyrolysis is typically to produce bio-char [4]. In this project, our focus is
on fast pyrolysis process, as we would like to optimize the production of bio-oils.

FDOS 47:2022 15
PROCESSES FOR THE PRODUCTION OF TRANSPORTATION FUEL VIA DEOXYGENATED BIO-OIL

Figure 1. C-H-O ternary diagram for biomass conversion (Source for figure: [5]). The figure shows the
main products from biomass conversion through different processes. Bio-oil is the key product ob-
tained from fast pyrolysis route (indicated as F in the figure, pointing towards mainly pyrolysis vapors
containing biooils and non-condensable gases).

While operating fast pyrolysis, it is the liquid phase that is of interest. The crude bio-oil that is
formed in the fast pyrolysis process consists of a wide spectrum of organic oxygenated substances
[4]. Wood derived crude bio-oil has a black or red-brown to dark green color. The water content in
the bio-oil ranges from 15-50 wt. % depending on production and collection. Bio-oils cannot be
dissolved in water but can tolerate some water before a phase separation occurs. It is miscible with
polar solvents such as methanol but immiscible with petroleum-derived fuels. It also has a density
around 1.2 kg/L, compared to light fuel oil at 0.85 kg/L. The viscosity varies between 25-1000 cSt
(measured at 40°C). The oil is chemically unstable and the instability increases with temperature.
There is a time-dependent behavior called aging where the viscosity increases, volatility decreases
and phases separate with time [6]. In addition, the level of deoxygenation of the oils required for
successful co-refining is as yet unclear but initial recommendations state that oxygen content
should be reduced to less than 7% to be considered as stabilized and completely miscible with pe-
troleum [7]. An approximation of the composition of the crude bio-oil is presented by the chemical
formula CH1.34O0.43. In order to upgrade the oils a hydrodeoxygenation (HDO) step could be imple-
mented. In the hydrogenation step, oxygen is rejected in a catalytic reaction, which makes use of
hydrogen, and leaves in the form of water. As a result, the plant requires a hydrogen supply in or-
der to perform the upgrading, either produced on or off site.

There are two different methods for HDO (i) high pressure HDO of liquid bio-oil (ii) atmospheric
vapor phase HDO. with high pressure HDO being the conventional process. The high-pressure liq-
uid phase HDO is the conventional process designed at 20 MPa and 400°C [8], and requires 0.073
kg H2 per kg of fast pyrolysis oil [9]. However, vapor phase HDO step designed at atmospheric
pressure is an interesting route that can be easily integrated with conventional pyrolysis units with-
out the need for condensing of pyrolysis vapors and pressurizing the bio-oil. However, the process
to directly apply HDO to pyrolysis vapors is still in experimental phase and has been reported to
use 0.1 kg H2 per kg of dry biomass feed to pyrolysis step [10]. Attempts to reduce the load on the

FDOS 47:2022 16
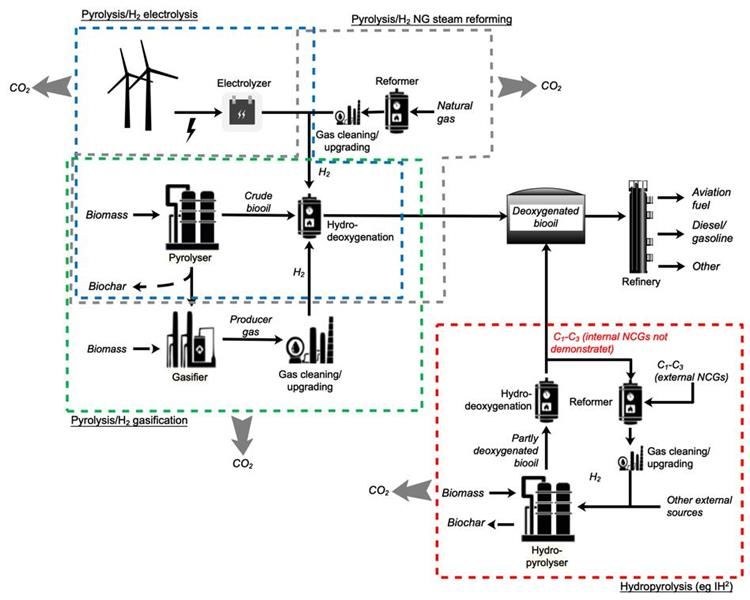
PROCESSES FOR THE PRODUCTION OF TRANSPORTATION FUEL VIA DEOXYGENATED BIO-OIL

HDO process by introduction of in situ catalysts in the pyrolysis process or using hydrogen instead
of nitrogen in the pyrolysis process, have been proposed [11, 12]. A recent successful example is
the IH2 (integrated hydropyrolysis and hydroconversion) process, which mitigates this problem
through pyrolysis in a hydrogen-rich environment [13]. The bio-oil produced from these processes
is further treated for oxygen removal, cracking of heavy carbon compounds to lighter products and
upgrading the product to meet the transportation fuel requirements. However, there is still need for
0.053 kg hydrogen per kg of bio-oil in the IH2 process to upgrade the bio-oil [9]. Therefore, the
source of hydrogen affects the techno-economic performance of bio-oil upgrading.

This project increases knowledge in integrating hydrogen generation processes with bio-oil produc-
tion. Four different process pathways to produce deoxygenated bio-oils are investigated. Three of
them are ex-situ hydro-deoxygenation of pyrolysis vapors, with hydrogen generated from (i) natu-
ral gas reforming (ii) electrolysis (iii) biomass/char gasification. The fourth pathway is the in-situ
hydro-pyrolysis and hydro-conversion process, termed as IH2. These four pathways can be de-
picted in Figure 2. The investigated processes can be integrated with existing (i) sawmills where
there is sawdust available or (ii) bio-refineries where the biooil can be converted into transportation
fuels. The first three pathways, have the same pyrolysis and HDO step, and only the H2 generation
process is different. In this study, we analyze the vapor phase HDO process and its integration with
bio-oil production. In-house process models for pyrolysis, gasification and HDO step have been de-
veloped using ASPEN Plus and validated against experimental results available in literature. We
also present scenarios with improved process integration and including CO2 capture and storage
(CCS). Mass and energy balance for the IH2 process is developed based on the publicly available
data and literature about the Gas Technology Institute’s (GTI) patented technology. Finally,
techno-economic analysis and greenhouse gas (GHG) assessment is presented for the different sce-
narios. These analysis helps us achieve the main objectives of the project to (i) obtain quantitative
understanding of the proposed configurations production of transportation fuels based on pyrolysis
and hydrodeoxygenation (ii) evaluate environmental (greenhouse gas) and techno-economic perfor-
mance of the proposed process chains based on the quantitative understanding (iii) assessing future
perspectives of integrating the process with biorefineries and potentially sawmills where sawdust is
available for biooil production.

Section 2 presents the process description of the process pathways and modelling assumptions. In
Section 3, we define the specific process scenarios analyzed in this project. In Section 4, we present
and discuss the key results for process performance and techno-economic analysis followed by
GHG assessment. Key performance indicators (KPIs) are also defined in Section 4. In Section 5 we
summarize our conclusions. The detailed process modelling of different process steps and under-
lying assumptions is described in the Appendix.

The detailed analysis of the IH2 process was part of a master thesis project [14]. A YouTube video1
is also available for step-by-step description of developing process model for biomass pyrolysis in
ASPEN Plus.

1
 Modelling of biomass pyrolysis process in Aspen Plus, available: https://youtu.be/s56NaOcPVg4

 FDOS 47:2022 17
PROCESSES FOR THE PRODUCTION OF TRANSPORTATION FUEL VIA DEOXYGENATED BIO-OIL

 CCS

 Vapors

 CCS

Figure 2. Different routes for hydrogen and deoxygenated bio-oil production. Blue boundary is for the
process that uses hydrogen for HDO from electrolysis. Green boundary is for the process where hydro-
gen is generated from biomass or char gasification. The grey boundary is for the process route that has
NG reforming for hydrogen production for HDO. The red boundary is the IH2 process. NCG is the
abbreviation for non-condensable gases. For the cases with biomass gasification and NG reforming,
analysis have also been performed for the process integrated with CCS.

FDOS 47:2022 18
PROCESSES FOR THE PRODUCTION OF TRANSPORTATION FUEL VIA DEOXYGENATED BIO-OIL

2 PROCESS DESCRIPTION AND PROCESS MODELLING
In this section, we describe the different process steps and the modelling methodology used to ana-
lyze the process. They key process steps include biomass fast pyrolysis, vapor phase HDO step, hy-
drogen generation and bio-oil upgrading to diesel and gasoline fractions. The last step of upgrading
to diesel/gasoline is same in all the process routes investigated, and therefore discussed only in the
results and discussion section. The IH2 process is also discussed in this section, but the detailed de-
scription is available in Subramaniam [14] We also discuss the CO2 capture process, which is inte-
grated with pyrolysis and hydrogen generation processes.

 BIOMASS FAST PYROLYSIS AND HDO PROCESS

 Process description
In this section, a general description of the whole biomass fast pyrolysis process is provided and
covering all the steps considered for the production of bio-oil from biomass. Two options exist for
production of bio-oils from fast pyrolysis: in situ catalytic fast pyrolysis followed by hydro-conver-
sion and the pyrolysis followed by ex-situ vapor phase catalytic HDO. In this section we discuss
the ex-situ process route based on the analysis presented by National Renewable Energy Labora-
tory (NREL) [15]. The reason why this specific configuration was chosen is because of the ad-
vantages this configuration provides. More specifically, the in-situ configuration combines both the
fast pyrolysis process and the catalytic upgrading process of the fast pyrolysis vapors within the
same reactor. In this manner, mixing the catalyst with biomass, char, and ash, and posing different
challenges related to the catalyst performance and a need of continuous maintenance to the reactor.
In exchange, the ex-situ configuration performs the fast pyrolysis and upgrading processes in sepa-
rate reactors. The advantages that the ex situ configuration provides is that the upgrading process of
the fast pyrolysis vapors are not exposed to the solid products associated with the pyrolysis process,
providing in this manner a more favorable environment for reaction chemistry [15]. In addition, an-
other advantage that the report of NREL highlights regarding the ex-situ configuration is that there
is the possibility to attach a hot gas filter in between the reactors in order to remove the fine solid
materials present in the vapor stream before entering the upgrading reactor. The overall process
flow diagram is shown in Figure 3.

FDOS 47:2022 19
PROCESSES FOR THE PRODUCTION OF TRANSPORTATION FUEL VIA DEOXYGENATED BIO-OIL

 Hydrogen

 Heated Non condensable Recovered
 Hydrogen gases Hydrogen
 Fluidization Gases

 Dry Pyrolysis Pyrolysis Pyrolysis HDO Bio oil PSA
 Cyclone Separator
Biomass Reactor Products Vapors Reactor + water Unit

 Pyrolysis Char
 Solids

 Flue Ash Free
 Combustor Cyclone Heat Recovery Train
 Gas Flue Gas

 Ash

Figure 3. Simplified process flow diagram of biomass fast pyrolysis process.

In the fast pyrolysis process, the pyrolysis reactor is designed at a pressure of 2.3 bar, with an oper-
ating temperature of 500°C, and a residence time of 1.5 seconds. Dried biomass feedstock is fed to
the reactor along with fluidizing gases and recirculating hot sand. This recirculation of hot sand
stream provides the necessary heat required by the endothermic reactions of the pyrolysis process.
After the dried biomass is pyrolyzed, the products of the process are composed of char, ash, pyroly-
sis vapor, steam, and non-condensable gases (which has mainly CO and CO2). The solid products
such as char, sand and ash are separated from the vapor product stream and sent to the combustor,
while the vapor product is cooled down in a heat exchanger and sent to the hydrodeoxygenation re-
actor to produce biooil that can be used in refinery to generate drop-in transportation fuels.

At the combustor, which operates at ambient pressure, the streams of char, sand and ash, and a
stream of compressed air are supplied. A specific amount of air is provided to the combustor in or-
der to achieve a complete combustion. The flue gas, besides being composed of CO2 as the major
component, it also contains residual ash and other finer particles, which are separated using a cy-
clone. Then, the solid-free flue gas stream is sent to a heat recovery train to preheat other streams
and processes at the plant, and generate steam which is consequently sent to the turbine section to
generate electricity. The recirculating sand stream is heated up during the combustion process and
sent to the fast pyrolysis reactor with enough thermal capacity to satisfy the heat requirements by
the endothermic reactions of the process.

The pyrolysis vapor stream, after being cooled, is sent to the HDO reactor, where the necessary
amount of hydrogen is supplied for the hydrodeoxygenation process. The hydrodeoxygenation up-
grading process of biomass pyrolysis oil removes oxygen atoms using hydrogen gas as a reducing
agent [16]. The main focus in the project was the ex-situ hydrodeoxygenation of bio-oil under at-
mospheric pressure in the vapor phase, as it is an energy efficient and promising upgrading method.
There are several catalysts that have been studied for vapor phase HDO upgrading at atmospheric
pressure, but we have assumed a MoO3 catalyst. The biomass fast pyrolysis vapors are hydro-
deoxygenated with the help of the catalyst MoO3, and using hydrogen at a low pressure of 1.8 bar.
The product stream consists mostly of linear alkanes (C1-C6) and aromatics [17]. Efficient HDO
reactions with the suitable catalyst and design conditions can minimize the total hydrogen con-
sumption of the process and therefore reduce capital and operation costs. The catalyst MoO3, [17]

FDOS 47:2022 20
PROCESSES FOR THE PRODUCTION OF TRANSPORTATION FUEL VIA DEOXYGENATED BIO-OIL

proved to be very effective for the production of hydrocarbons at higher yields than those obtained
by other studies using different catalysts and at different process conditions.

Hence, after the HDO process, the main composition of the product stream is bio-oil with water,
char and non-condensable gases. The product stream is cooled down to condense the water content.
Char is separated and sent for combustion to the combustor block to provide the sufficient energy
for the endothermic reactions of the fast pyrolysis process. The bio-oil along with the condensed
water leaving the reactor is consequently separated as well. The non-condensable gases stream is
sent to a compressor, where it is pressurized to a specific pressure of 8 bar for the hydrogen recov-
ery process. Once the stream of non-condensable gases has been compressed to the desired pres-
sure, it is then sent to the pressure swing adsorption unit (PSA). Recovered hydrogen is ready to be
used in the HDO process. Fraction of the resulting off gas from PSA is used as a fluidization gas
and the remaining is combusted to generate heat for the endothermic processes.

 Modelling of biomass fast pyrolysis
In general, the process modeling of biomass fast pyrolysis represents a challenge for most research-
ers as many variables are involved, which can impact the process results. Humbird et al. [18] pre-
sents that approximately more than a thousand species can be produced in fast pyrolysis systems.
These differences in product species are caused by different sources such as feedstock composition,
feedstock particle size, operating conditions of the reactor, reactor’s size and configuration, and ul-
timately the variations in heat and mass transfer effects due to the previous elements mentioned.

Humbird et al. [18] presents the most common approaches to simulate fast pyrolysis reactors in
large processes for technoeconomic analysis:

 − The first approach is through the yield specification of the representative process products
 previously obtained from experimental data [18].

 − The second approach is the use of predictive models with reaction kinetics. However, the
 main challenges using a kinetic reaction framework are the scarcity of studies based on this
 approach, and that the reported kinetic parameters of these few studies often include mass,
 heat, and momentum transfer effects that are unique for each experiment.

 − Finally, the third approach for the simulation of the fast pyrolysis process is the use of 2-
 dimensional or 3-dimensional Computational Fluid Dynamic (CFD) models, which would
 be more beneficial for modeling the dynamics inside the reactor from first principles. How-
 ever, the downside of using a CFD model are the long computation times that can signifi-
 cantly increase with the addition of more reaction kinetics or when a more detailed simula-
 tion is required. The few available studies that take the approach of using a CFD model are
 based on simple reaction kinetics, and lump the fast pyrolysis products in three categories,
 char, tar, and gas.

In order to balance the fluid dynamics and detailed kinetics, Humbird et al. [18] used a 1-dimen-
sional fast pyrolysis reactor with a reasonably detailed speciation of process products. The latter is
important as an adequate speciation of products is necessary for the proper modeling of down-
stream operations such as the hydrodeoxygenation of fast pyrolysis oil. Finally, another study that
uses a CFD modeling approach is the work of Trendewicz et al. [19], in which the issues that arise

FDOS 47:2022 21
PROCESSES FOR THE PRODUCTION OF TRANSPORTATION FUEL VIA DEOXYGENATED BIO-OIL

from the variations of biomass composition, residence time, and reaction temperature on the pyrol-
ysis process, were addressed by incorporating a flexible pyrolysis reaction mechanism, a 1-dimen-
sional steady state momentum balance for the solids-gas flow, a 1-dimensional steady state energy
equation, and the use of a multistep, multicomponent reaction system developed by Ranzi et al.
[20]. The model used by Trendewicz et al. [19] provides a reasonable distribution of products for
the modeling of the downstream processing section of bio-oil.

The approach taken in our study for the modeling of biomass fast pyrolysis follows the same ap-
proach taken by Caudle et al. [21], and using a more recent multistep kinetic scheme of biomass
pyrolysis developed by Ranzi et al. [22]. Although, some improvements were made on the multi-
step kinetic scheme to correct model deficiencies in our work, these improvements will be ad-
dressed in detail in the following section. Thus, the process flow for the biomass fast pyrolysis pro-
cess, represented in Figure 1, was developed using the commercial process modeling software As-
pen Plus. An overall process flow diagram of the biomass fast pyrolysis process can be seen in Fig-
ure 4.

Figure 4. Process flow of the biomass fast pyrolysis process in Aspen Plus. The details in the figures are
described in the sections below.

 Simulation environment setup
The following steps were taken for the modeling of the biomass fast pyrolysis in Aspen Plus: (i)
specification of biomass components and the composition of the biomass samples used in the study
(ii) manually specifying the thermophysical properties of the biomass components (iii) selection of
a suitable fluid package (iv) specification of the thermodynamic framework.

 Biomass composition
The three major building blocks of biomass are cellulose, hemicellulose, and lignin. Other im-
portant components are extractives, moisture and ash. The content of each one of these components
depends entirely on the sample of biomass taken for the process. The following table, Table 1,
summarizes the components in biomass:

FDOS 47:2022 22
PROCESSES FOR THE PRODUCTION OF TRANSPORTATION FUEL VIA DEOXYGENATED BIO-OIL

Table 1. Assumed (dried) biomass composition in pyrolysis step in the analysis (Composition is similar
to the composition of dried Douglas fir wood belonging to the pine family). (Source [21])

 Biomass Components Weight fraction (wt%) (dry)
 Cellulose 42.93
 Hemicellulose: Glucomannan (Softwood) 21.46
 Hemicellulose: Xylan (Hardwood) -
 Lignin rich in Carbon 4.56
 Lignin rich in Oxygen 10.67
 Lignin rich in Hydrogen 11.75
 Tannin 1.20
 Triglyceride 4.92
 Moisture 2.04
 Ash 0.48

The composition of biomass is similar to Douglas fir wood (having 30% moisture content before
drying), which belongs the pine family. It is important in Sweden’s context, because 70% percent
of Sweden’s land area is covered by forest, from which: 42% is spruce, 39% is pine, 12% is birch,
and 7% being other deciduous trees [23].

In this project, we also present the results for bio-oil production for different biomass types. We
consider 4 different types of spruce and pine. The characteristics of the different samples of Spruce
and Pine wood present in different physical forms (such as chips or sawdust) have been assumed
from study of Debiagi et al. [24], and are summarized in Table 24 and Table 25 in the Appendix.

 Thermophysical properties of biomass
The thermophysical properties for the biomass components, biomass pyrolysis intermediate spe-
cies, and biomass pyrolysis end products were taken from the work of Gorensek et al. [25]. It in-
cludes 49 components, from which 20 are not present in the Aspen plus databank. The reason for
which these 20 components are not present in the commercial process simulator databank is be-
cause of the complexity of representing biomass on hypothetical “model compounds” that cannot
be isolated for their respective measurement of physical properties [25]. Since the accuracy of a
process model depends entirely on the fidelity of its component’s properties model, Gorensek et al.
[25] compiles information from different studies of the thermophysical properties for these missing
components.

Hence, in the present section a summary of the different components generated during the biomass
fast pyrolysis are presented. A complete table of the different components along with their formu-
las, ID, type, and specification of their availability of the thermophysical properties data in the As-
pen plus databank can be found in Table 26 in the Appendix. In the following section, the different
thermophysical properties of the missing components, biomass pyrolysis intermediate species, and
biomass pyrolysis end products - that were manually introduced into the simulation environment -
are addressed.

For biomass fast pyrolysis process, Ranzi et al. [22] assumes that each biomass component behaves
independently, giving as a resulting 7 components that form reactive intermediates, which undergo
further decomposition. These reactive intermediate components are activated cellulose, two acti-

FDOS 47:2022 23
PROCESSES FOR THE PRODUCTION OF TRANSPORTATION FUEL VIA DEOXYGENATED BIO-OIL

vated components of hemicellulose, three intermediate components of lignin, and a tannin interme-
diate. Table 2 summarizes different components involved in the biomass fast pyrolysis process.
The overall components are divided into four groups, the first group “Biomass components” pre-
sents the un-pyrolyzed biomass components. The second group “Biomass Pyrolysis Intermediate
Species” describes the intermediate products of biomass pyrolysis. The third group “Biomass Py-
rolysis End-Products” presents the 28 end products of biomass pyrolysis.

Table 2. Different components in biomass, intermediate species and end-products involved in the fast
pyrolysis process. Non-biomass components are also listed in the table.
 Biomass Components
 - Cellulose (CELL) - O – rich lignin (LIGO) - Moisture
 - Glucomannan - H – rich lignin (LIGH) - Ash
 - Xylan - Tannin (TANN)
 - C – rich lignin (LIGC) - Triglyceride (TGL)
 Biomass Pyrolysis intermediate Species
 - Tannin intermediate
 - Secondary lignin intermediate (LIG) - Activated hemicellulose 1 (HCE1)
 (ITANN)
 - C – rich lignin intermediate (LIGCC) - Activated hemicellulose 2 (HCE2)
 - H/O – rich lignin intermediate (LIGOH) - Activated cellulose (CELLA)
 Biomass pyrolysis end products
 - Char - Acrolein - Formaldehyde
 - Sinapyl aldehyde - n – propionaldehyde - Formic acid
 - Free fatty acid - 3 – hydroxypropanal - Methane
 - High–molecular–weight lignin - Furfural (FURF) - Methanol
 - Glyoxal (GLYOX) - Xylosan - Carbon monoxide
 - Ethylene - Levoglucosan (LVG) - Carbon dioxide
 - Acetaldehyde - Phenol - Hydrogen
 - Acetic acid - 5–hydroxymethyl–furfural - Water
 - Glycolaldehyde - Anisole
 - P – coumaryl alcohol
 - Ethanol
 (COUMARYL)
 Non biomass components also included in the simulation environment
 - Argon - Nitrogen - Oxygen
 - Sand

More details are available in Table 26 in the Appendix.

 Thermodynamic model to estimate properties
The selection of a proper thermodynamic model in Aspen plus for the simulation of the fast pyroly-
sis process of biomass is based on the approach taken by Gorensek et al. [25], where the Peng-Rob-
inson cubic equation of state with the Boston-Mathias alpha function (also known as the PR-BM
method) was chosen as the thermodynamic basis for the calculation of the properties for the differ-
ent streams in the biomass fast pyrolysis process. This fluid package is recommended for gas pro-

FDOS 47:2022 24
You can also read