Preparation and property analysis of solid carbonate-oxide composite materials for an electrolyte used in low-temperature solid oxide fuel cell
←
→
Page content transcription
If your browser does not render page correctly, please read the page content below
Science and Technology for Energy Transition 77, 4 (2022)
Ó The Author(s), published by EDP Sciences, 2022
https://doi.org/10.2516/stet/2022003
Selected Papers from 7th International Symposium on Hydrogen Energy,
Renewable Energy and Materials (HEREM), 2021                                                                                    Available online at:
                                                                                                                                  stet-review.org
Edited by Mohan Lal Kolhe
  REGULAR ARTICLE

Preparation and property analysis of solid carbonate-oxide
composite materials for an electrolyte used in low-temperature
solid oxide fuel cell
Yong-Xin Liang, Ze-Rong Ma, Si-Ting Yu, Xin-Yue He, Xu-Yang Ke, Ri-Feng Yan, Xiao-Xian Liang,
Xin Wu, Rui-Sen Huang, Liang-Cheng Wen*, and Gengyu Cao*

College of Materials Science and Engineering, Guangdong University of Petrochemical Technology, 139 Guanduer Road,
Maonan District, Maoming City 525000, Guangdong Province, PR China

            Received: 4 October 2021 / Accepted: 4 February 2022

            Abstract. The oxide-carbonate composite electrolyte material with high ionic conductivity at low temperature
            has been thought that it can be used to develop LT-SOFC. However, the carbonate composite electrolyte is not
            easy to make it dense, especially mixing and packing oxide and carbonate to fabricate the composite electrolyte
            simply. In this article, rare-earth-doped CeO2 (RDC) (R = La, Sm, Gd, and Gd + Y) series samples were
            prepared by wet ball-milling, then sintered into fully dense and porous oxide bulk at 1500–1600 °C and
            1000 °C. Melted carbonate LNCO, composed of Li2CO3 and Na2CO3 at a molar ratio of 1:1, was combined with
            porous oxide bulk materials using a bath method at 500 °C for 10 h to prepare a dense carbonate-oxide com-
            posite electrolyte. The dense oxide-carbonate composite electrolyte always obtains by this fabrication process.
            Boiling water was used to remove carbonate from these composites. Lattice parameters were obtained through
            Rietveld refinement, and a calculation procedure for quantifying the composite density was proposed. The
            quantified composite density results were verified through scanning electron microscopy microstructure
            observations. The Ce valence in the RDC oxides and RDC-carbonate composite was analyzed by X-ray absorp-
            tion near edge structure spectroscopy to observe the effects of heat treatment temperature and carbonate on the
            Ce4+/Ce3+ mixed-valence state in doped CeO2.

            Keywords: Solid electrolyte, Carbonate, Full dense, Mixed-valence states.

1 Introduction                                                              a commercially available electrolyte ceramic material that
                                                                            has a low conductivity of 0.1 S cm 1 under operational
Solid Oxide Fuel Cell (SOFC) technology has great                           temperatures of 1000 °C [3–5]. The use of a SOFC under
potential in the power generation field. The structures of                   high temperatures has the following disadvantages:
its components are simple and because SOFC technology                       (1) The composition interface is prone to reacting. (2)
can be used in high temperatures (650–1000 °C), it does                     There can be a reduction in thermal stability. (3) Interfacial
not require use of expensive platinum as a catalytic                        bonding is affected by the coefficient of expansion and easily
converter because cathode and anode materials can be used                   results in battery cracking caused by thermal stress. (4) To
at relatively low costs instead. Furthermore, SOFC technol-                 achieve stable usage, electrode and bipolar plate materials
ogy has a high efficiency, relatively low pollution emissions,               with relatively high costs are required, directly affecting
such as NOx, SOx, and HC, and the produced CO2 can be                       the manufacturing costs of the SOFC [6–10]. Electrolyte
easily captured [1, 2]. Additionally, the materials that can                materials currently in use only possess appropriate
be used as fuels in an SOFC are diverse, including natural                  levels of conductivity in high temperature environments.
gas, CO, H2, methanol, coal gas, and even flammable                          Therefore, the development of an electrolyte material with
exhaust gases.                                                              a high ionic conductivity in low temperature environments
    To popularize the use of SOFCs, some components still                   (under 600 °C) is an essential research topic in SOFC
require further improvement. For instance, (Y0.08Zr0.92)                    development.
O1.96 (8 mol% yttria-stabilized zirconia, 8YSZ) is currently                    In operational environments with temperatures below
                                                                            600–800 °C, Rare-earth Doped CeO2 (RDC) electrolyte
* Corresponding authors: 2032466104@qq.com;                                 materials can achieve conductivity values similar to that
gyucao@gdupt.edu.cn                                                         of 8YSZ at 1000 °C. Therefore, RDC is viewed as the
This is an Open Access article distributed under the terms of the Creative Commons Attribution License (https://creativecommons.org/licenses/by/4.0),
              which permits unrestricted use, distribution, and reproduction in any medium, provided the original work is properly cited.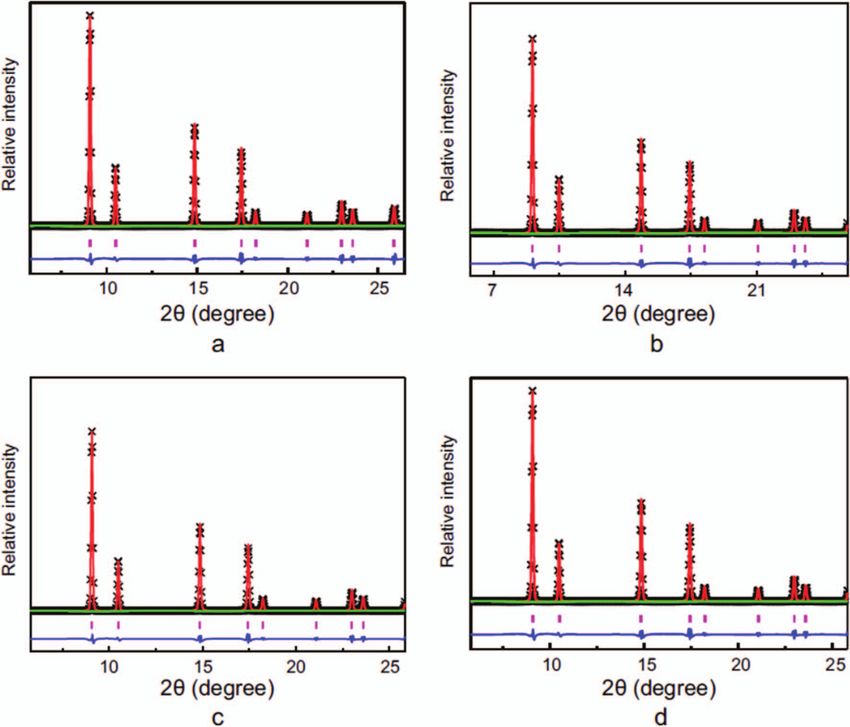
2                          The Author(s): Science and Technology for Energy Transition 77, 4 (2022)

Table 1. Chemicals used in this study.
Reagent                                                                 Label                                       Purity
La2O3                                                              Riedel-de Haën                                99.9%
Sm2O3                                                              Riedel-de Haën                                99.9%
Gd2O3                                                              Riedel-de Haën                                99.9%
Y 2O 3                                                             Riedel-de Haën                                99.9%
Li2CO3                                                             Riedel-de Haën                                99.5%
Na2CO3                                                                 Showa                                      99%
PMMA (Poly(methyl methacrylate))                                  Aldrich Chemical                             MW ~ 996 000
C3H5(OH)3                                                         Junsei Chemical                                 99%
CH3COCH3                                                           Acros Organics                                99.8%
Corn oil                                                          Junsei Chemical                                99.9%

Fig. 1. TG/DTA diagrams of (a) binder (PMMA), (b) dispersant (corn oil), and (c) plasticizer (glycerin).

electrolyte material with the greatest potential for medium      2 Materials and methods
to low temperature applications. However, a portion of the
Ce4+ may be reduced to Ce3+ in doped CeO2 oxides during          The chemicals listed in Table 1 were processed with wet
high-temperature sintering, which may result in a mixed-         ball-milling to produce the LaDC, SDC, GDC, and GYDC
valence state. After the resulting material is used to assem-    sample powders. The manufacturing process was as follows:
ble a cell component, if the operating temperature surpasses     3 wt.% binder (PMMA), 1 wt.% dispersant (corn oil), and
550 °C and the material comes into contact with an anode         1 wt.% plasticizer (glycerin) were added to each sample
reduction atmosphere, the formation of a Ce4+/Ce3+               powder. The resultant mixture was placed in a tungsten
mixed-valence state is accelerated and the electrical conduc-    carbide grinding jar. A suitable amount of zirconia balls
tivity is increased, which results in a decline in the open      with 1 cm diameters and a volume ratio of 1:1 relative to
circuit voltage and operating power density [11–14].             the sample powder were added. Acetone was added, and
    In order to stop the Ce valence change, two electrolyte      the resulting mixture was ground with a planetary ball mill
materials, a carbonate mixture and oxygen ion conductor,         for 24 h. After filtering out the zirconia balls and placing the
were combined to produce a carbonate-oxide composite;            solution into an oven to dry the acetone, an agate mortar
under 500 °C, it achieves a conductivity value similar to        was used to evenly grind the dry powder. A uniaxial pres-
that of 8YSZ at 1000 °C and suppresses the Ce element            sure of 840 MPa was then applied to transform the powder
valence change, which is an achievement that has attracted       sample into a pellet. The pellet was placed into a furnace
remarkable attention. This study builds upon previous            that increased 100 °C/h until 500 °C, after which the fur-
research by synthesizing a carbonate-oxide composite elec-       nace idled for 2 h to remove any remaining organic addi-
trolyte material through a bath method in order to ensure        tives. The ThermoGravimetric and Differential Thermal
a high degree of density [15]. Furthermore, a series of doped    Analysis (TG/DTA) results of the binder, dispersant, and
CeO2 oxides of (La0.2Ce0.8)O1.9 (LaDC), (Sm0.2Ce0.8)O1.9         plasticizer are shown in Figure 1. The heat program was
(SDC), (Gd0.2Ce0.8)O1.9 (GDC), and (Gd0.05Y0.15Ce0.8)O1.9        used by the heating rate of 5 °C/min from room tempera-
(GYDC) were synthesized for complete physical prop-              ture to 800 °C, and the N2 gas was employed to measure-
erty analyses and discussion. The lattice parameter,             ment process by 20 mL/min. These results indicate that
microstructure and Ce4+/Ce3+ mixed-valence state in              these organic additives can be completely decomposed at
the RDC oxides and carbonate-oxide composite materials           500 °C. Then, the furnace continued to increase its temper-
are shown in this research.                                      ature by 100 °C/h until it reached the maximal sintering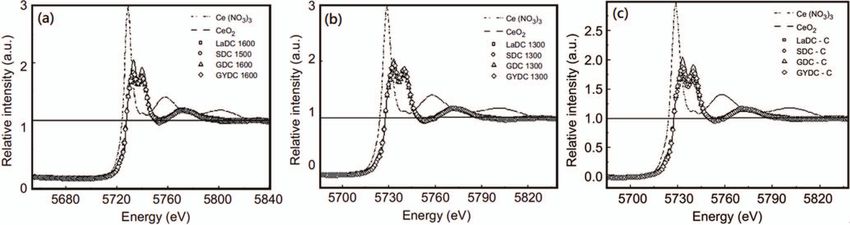
The Author(s): Science and Technology for Energy Transition 77, 4 (2022)                           3

Fig. 2. XRD diagram of the RDC series oxides sintered at           Fig. 3. XRD diagram of the RDC series oxides sintered at
1500–1600 °C for 5 h. The angle of diffraction 2h values are for   1000 °C for 10 h. The angle of diffraction 2h values are for
X-wavelength 0.15418 nm (top) and 0.0495941 nm (bottom).           X-wavelength 0.15418 nm (top) and 0.0495941 nm (bottom).

temperature of 1500–1600 °C, at which point, the furnace
maintained the temperature to complete sintering over 5–
10 h. Finally, the furnace lowered its temperature by
100 °C/h until it reached 1000 °C, at which point, the fur-
nace was turned off to allow for natural cooling.
    The theoretical density of each sample was calculated
by first obtaining the theoretical molar volume:
a3  10 24  6.02  1023 cm3/Z, in which a (Å) is the sam-
ple unit cell parameter. If the sample exhibited a fluorite
structure, Z equals 1, whereas if the sample exhibited a
pyrochlore structure, which is the superstructure of fluorite,
Z equals 8. This is because the entire cells were A16B16O56
and the typical A2B2O7 is 1/8 of the unit cell. Then, the
molar weight of the sample was divided by the theoretical
molar volume to obtain the theoretical density of each
sample. Next, a scale was used to measure the actual weight
of each sample, after which the Archimedes principle was
used to determine the actual volume, from which the actual
density was obtained. Lastly, the actual density was divided
by the theoretical density to find the relative density of the
sample.
    The manufacturing process of composites was as fol-            Fig. 4. XRD diagram of the RDC series composites. The angle
lows. First, the RDC pellet was sintered at the appropriate        of diffraction 2h values are for X-wavelength 0.15418 nm (top)
temperature into a porous oxide bulk material that has a           and 0.0495941 nm (bottom). The symbol (d) in the diagram
relative density of approximately 60–70%. Then, Li2CO3             indicates the Li2CO3 signal, whereas (&) indicates the Na2CO3
and Na2CO3 were mixed through wet-ball milling at a                signal.
1:1 molar ratio to produce a carbonate mixture referred
to as LNCO. An appropriate amount of LNCO was then
placed into an SUS304 stainless steel container that was           of the carbonate-oxide composite increases with increasing
heat resistant up to 900 °C. The container was heated to           the amount of carbonate mixture until the carbonate vol-
500 °C for 24 h to produce a carbonate liquid. A porous            ume makes up 30% of the composite [16]. Therefore, this
oxide pellet was then heated with the LNCO to 500 °C               study utilized sintering temperatures to make oxide bulk
for 12 h to allow the melted carbonate to penetrate and            materials with porosity values between 30% and 40%,
fill the pores of the pellet in order to produce a high-            which is equal to the ratio of carbonate volumes in the
density composite. Zhu et al. found that the conductivity          samples.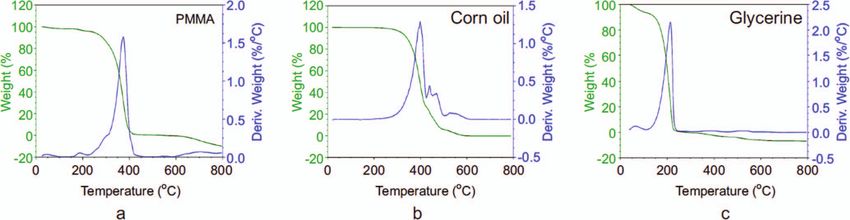
4 The Author(s): Science and Technology for Energy Transition 77, 4 (2022)
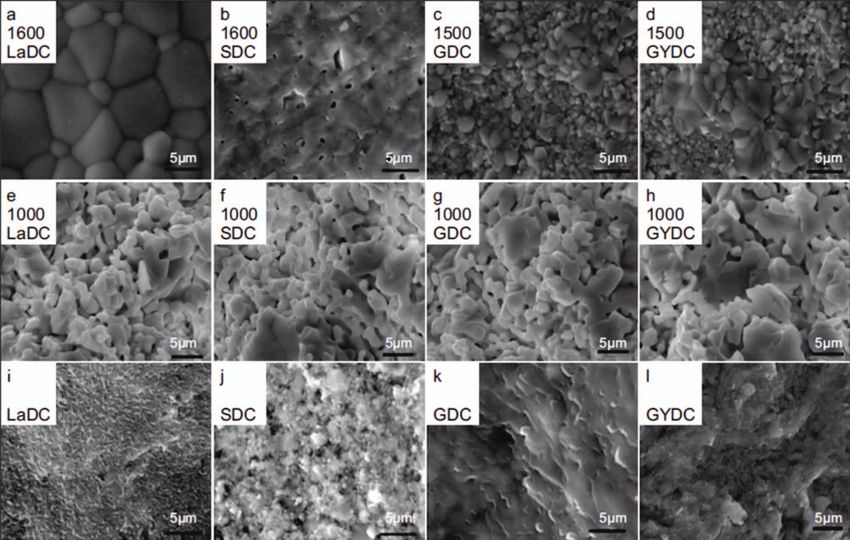
Fig. 5. The RDC series Rietveld refinement results for sample powders sintered at 1500–1600 °C, (a) LaDC, (b) SDC, (c) GDC, and
(d) GYDC.
Powder diffraction data used for the Rietveld refine- the density would be as high as an SOFC solid electrolyte.
ment were collected to determine the crystal structure of The sintered RDC series samples were all fluorite single-
the sample oxide. The General Structure Analysis System phase samples. As can be observed from Figures 2 and 3,
developed by Larson and von Dreele was employed to the diffraction signal angles gradually shift toward the right
analyze the structural parameters using the Rietveld from LaDC, SDC, GDC, to GYDC because of the respec-
method [17]. The morphology of the sample was observed tive eight coordination La3+, Sm3+, Gd3+ and Y3+ ionic
using a VEGA SBH scanning electron microscope. The radii of 1.16, 1.079, 1.053, and 1.019 Å [18]. This trend
X-ray Absorption Near Edge Structure spectroscopy matches the Bragg diffraction formula of nk = 2dsinh.
(XANES), BL16A1 wiggler beam line was used to observe Figure 3 shows the XRD diagram for the LaDC, SDC,
the Ce4+/Ce3+ mixed-valence state in both the RDC oxides GDC, and GYDC pure oxide samples sintered at 1000 °C
and carbonate-oxide composite materials. for 10 h. These samples also exhibited fluorite single-phase
structures. Figure 4 displays the XRD diagram of the car-
bonate-oxide composites and LNCO. It shows the signal
3 Results and discussion positions of the Li2CO3 (7.12° and 10.64°) and Na2CO3
(8.90°, 11.13°, 11.47°, and 14.09°) [15]. As the carbonate
Figure 2 illustrates the XRD diagram for LaDC, SDC, structures were amorphous, their signal range was wider
GDC, and GYDC pure oxide samples. Here, GDC and and less apparent [6].
GYDC were sintered at 1500 °C for 5 h, while LaDC and The XRD angle of diffraction data from the RDC
SDC were sintered at 1600 °C for 5 h. These temperatures samples was refined to obtain the structural parameters
were selected so that the pure oxide sample bulks would for calculating the relative density of the samples and to
exceed the relative density of 98.3(4)%, which meant that evaluate their effect on sample physical properties. Figure 5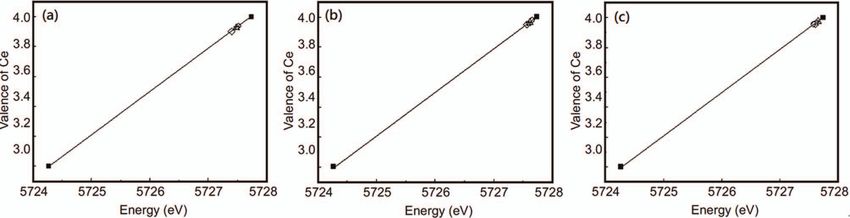
The Author(s): Science and Technology for Energy Transition 77, 4 (2022)                            5

Table 2. LaDC, SDC, GDC, and GYDC lattice param-
eters, v2, Rwp, and Rp values.
Sample        a-axis         v2        Rwp (%)       Rp (%)
LaDC         5.4726(7)      3.975        3.55          2.24
SDC          5.4370(2)      3.115        3.91          3.23
GDC          5.4237(6)      3.415        2.32          1.62
GYDC         5.4106(4)      4.006        2.58          1.33

shows the Rietveld refinement results for the RDC series
samples sintered at 1500–1600 °C. Table 2 lists the RDC
series sample lattice parameters obtained from the Rietveld
refinement. Note that the v2 values are all between 0.5 and
5 and the error values are less than 5%, indicating that the
sample calculations are credible. Figure 6 shows the refined
lattice parameters plotted against the doped rare earth         Fig. 6. LaDC, SDC, GDC, and GYDC lattice parameters
ionic radii. The sample lattice parameters, including LaDC,     plotted against R3+ ionic radius.
SDC, GDC, and GYDC, exhibit a gradually decreasing
trend that is consistent with Vegard’s Law. These results
indicate that, for this series, the consistency of each step    Table 3. RDC and RDC composite heat treatment
in the manufacturing process of the samples is high and         temperatures and relative densities.
human error is relatively small.
    The heat treatment temperatures and relative densities      Sample                     Relative density (%)
of the RDC series of high-density oxides, porous oxides, and
composite samples are listed in Table 3. As shown in the                      1500–1600 °C           1000 °C      Composite
table, both LaDC and SDC sintered at 1600 °C, and               LaDC             98.3(4)             66.5(6)        99.8(2)
GDC and GYDC sintered at 1500 °C produced high sample           SDC              98.9(5)             63.6(2)       100.0(3)
densities (>98.3(4)%). Furthermore, 1000 °C sintering for
                                                                GDC              99.4(2)             68.4(5)        99.7(1)
10 h produced densities between 63.6(2)% and 68.4(5)%,
which correspond to porosities between 31.6% and 36.4%.         GYDC             98.5(6)             64.8(4)        99.4(2)
After the porous samples were made into composites, the
sample densities approached 100%, meaning that the
melted carbonate filled almost all the sample pores. A
necessary condition for a solid electrolyte is high relative    quantify the relative density of a carbonate-oxide composite
density close to 100%. This study verified the relative          bulk.
density of composites, as shown in Table 4. The composite           Scanning Electron Microscope (SEM) microstructure
made of a porous oxide with a known relative density,           photographs help visualize the results of the high-density
then used sandpaper to remove the excess surface carbonate      composite calculations. Figure 7 shows the SEM images of
of the composite bulk and measured it to determine weight       the RDC series high-density oxide, porous oxide, and
W1. Then, boiling water was used to remove the carbonate        composite samples magnified 5000 times. As shown in
in the composite, which was then dried prior to reweighing      Figures 7a–7d, pores are barely visible in oxides that have
to obtain the weight W2 of the remaining oxide bulk. There-     been sintered at high temperatures (1500–1600 °C),
fore, W1 W2 was the weight of the carbonate filling into         whereas numerous pores can be seen in the oxide samples
the porous oxide bulk. As LNCO is composed of Li2CO3            sintered at 1000 °C in Figures 7e–7h. Figures 7i–7l depict
and Na2CO3 with a molar ratio of 1:1, the respective            the SEM diagrams of the composite samples and clearly
weights, W3 and W4, in the composite can be obtained.           illustrate that the vast majority of pores in the porous oxide
The densities of Li2CO3 and Na2CO3 were used to obtain          samples have been filled.
their respective volumes V4 and V5 in the composite filling.         Numerous studies have indicated that after CeO2-doped
The volumes of Li2CO3 and Na2CO3 (V4 + V5) approached           oxide electrolyte materials are assembled into SOFC unit
volume V3 of the oxide bulk material pores, indicating that     cell components, the reduction of Ce4+ into Ce3+ results
the carbonate almost completely filled the pores. Further-       in a mixed-valence state. This study proposes that materials
more, the relative density of the oxide can be used to obtain   of this type are likely to begin producing mixed-valence
the volume of the oxide V2 in the composite. The sum of the     states during high-temperature sintering densification pro-
two carbonate volumes V4 + V5 plus the volume occupied          cess. Operational temperatures higher than 550 °C and
by the oxide V2, divided by the volume of the composite         the effects of the reductive environment result in an even
V1 is a value closely approaching 1. These results confirm       more apparent mixed-valence phenomenon. The resulting
that this calculation process and its results can be used to    electronic conductivity is increased, causing lower open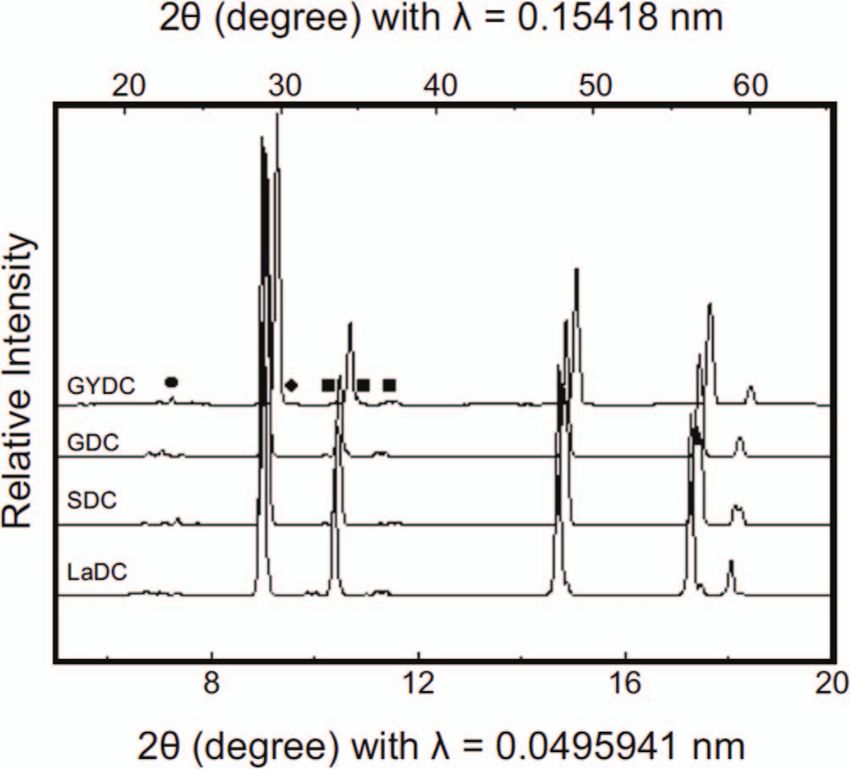
6                           The Author(s): Science and Technology for Energy Transition 77, 4 (2022)

Table 4. Carbonate composite density calculation process and results.
Sample      Composite         Oxide                       Carbonate        Li2CO3                                   Na2CO3
             W1 (g)           W2 (g)                     W1 – W2 (g)       W3 (g)                                   W4 (g)
LaDC           1.4101          1.2041                       0.2060          0.0846                                   0.1214
SDC            1.4133          1.2131                       0.2002          0.0822                                   0.1180
GDC            1.4281          1.2352                       0.1929          0.0792                                   0.1136
GYDC           1.4064          1.1900                       0.2164          0.0889                                   0.1275
Sample     Oxide relative                Composite                          Oxide                                    Void
            density (%)                  V1 (cm3)                          V2 (cm3)                                 V3 (cm3)
LaDC            66.7                       0.2653                           0.1770                                   0.0884
SDC             67.4                       0.2641                           0.1780                                   0.0861
GDC             68.4                       0.2616                           0.1789                                   0.0827
GYDC            64.8                       0.2632                           0.1706                                   0.0926
Sample       Li2CO3                       Na2CO3         Carbonate                       Composite density
             V4 (cm3)                     V5 (cm3)     V4 + V5 (cm3)                   (V4 + V5 + V2)/V1 (%)
LaDC           0.0401                      0.0480           0.0881                                99.7
SDC            0.0390                      0.0466           0.0856                                99.4
GDC            0.0375                      0.0449           0.0825                                99.8
GYDC           0.0421                      0.0504           0.0925                                99.9

Fig. 7. RDC sintered at 1500–1600 °C for 5 h; sintered at 1000 °C for 10 h; SEM diagram of carbonate composite magnified 5000
times. (Here, (a), (e), (i) have R = La; (b), (f), (j) have R = Sm; (c), (g), (k) have R = Gd; (d), (h), (l) have R = Gd + Y.)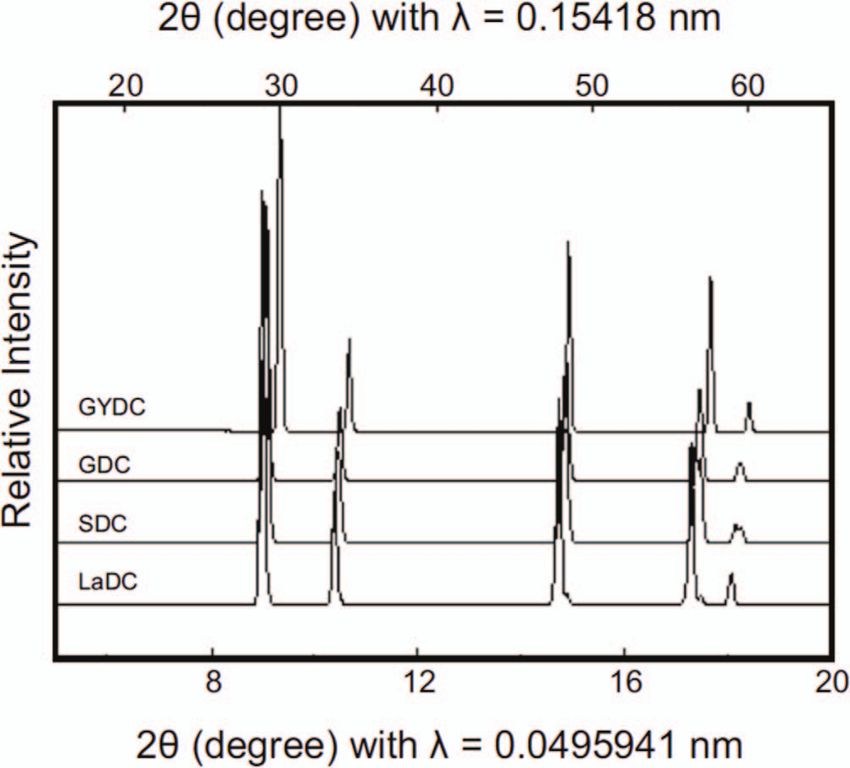
The Author(s): Science and Technology for Energy Transition 77, 4 (2022)                          7

Fig. 8. (- – -) Ce(NO3)3, (‒) CeO2, (h) LaDC, (s) SDC, (D) GDC, and (e) GYDC samples with 1500–1600 °C (a), 1000 °C (b), and
composite samples with 500 °C (c) treatment, Ce L-edge XANES spectrum after normalization.

Fig. 9. Ce(NO3)3 and CeO2 reference standard, (h) LaDC, (s) SDC, (D) GDC, and (e) GYDC samples treated with 1500–1600 °C
(a), 1000 °C (b), and composite samples with 500 °C (c); valence plot of maximal first order differential values of Ce element.

circuit values, which adversely affect the operation power       Table 5. Ce(NO3)3, CeO2 and LaDC, SDC, GDC, and
density of the SOFC single cell. Therefore, this study           GYDC sample powders with 1500–1600 °C treatment: Ce
utilized typical high-temperature sintering densification         L-edge XANES spectrum single maximum differential
on the RDC oxides, low-temperature heat-treated samples,         energy shoulders and corresponding Ce valence.
and sample powders resulting from composite production,
                                                                 x                         Energy (eV)               Valence
with Ce(NO3)3 and CeO2 as reference standards to analyze
the average Ce valence.                                          Ce(NO3)3                     5724.3                      3
    The RDC series oxide measured by XANES spectrum              CeO2                         5727.7                      4
approached that of the CeO2 reference standard, exhibiting       LaDC-1600                    5727.5                    3.94
single maximum differential energy shoulders that were
                                                                 SDC-1600                     5727.5                    3.94
almost identical. Thus, this study used the strength “1”
position as the RDC series reference line, as shown by the       GDC-1500                     5727.4                    3.90
horizontal lines in Figure 8. Each energy shoulder at the        GYDC-1500                    5727.5                    3.94
intersection between each energy reference line and spec-        Average                                              3.93(2)
trum was used to infer the Ce element valence of each sam-
ple, as shown in Figure 9. The analysis results indicated
that the RDC samples that underwent high temperature
treatments exhibited lower Ce valences with an average           to the RDC oxides treated at 1000 °C. The Ce valence
of 3.93(2), whereas the RDC samples treated at 1000 °C           in the RDC oxides with different heat-treated temperature
temperatures exhibited higher Ce valences with an average        and in the carbonate-oxide composites measured by
of 3.96(1). Thus, a multi-valence element, like Ce, might        XANES are listed in Tables 5–7. As seen in the results,
tend to reduce its state during higher heat-treated temper-      the Ce valence in the RDC oxide would not be affected
atures. The RDC oxides were first sintered at 1000 °C to          by combining with carbonate. In other words, using the
get a porous sample bulk, followed by 500 °C treatments          LNCO carbonate and RDC oxide to form a composite
with the LNCO carbonate mixture. The resultant average           creates a stable electrolyte material that can be applied in
valence of Ce in the composite was 3.96(1), which is similar     low temperature SOFCs.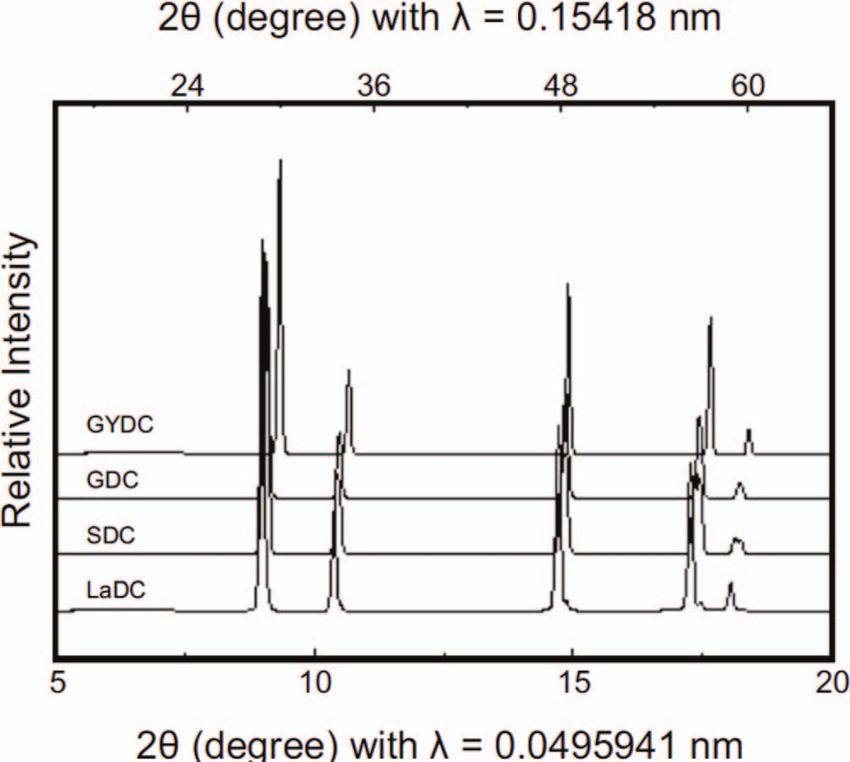
8                        The Author(s): Science and Technology for Energy Transition 77, 4 (2022)

Table 6. Ce(NO3)3, CeO2 and LaDC, SDC, GDC, and                carbonate-oxide composite is a stable electrolyte material
GYDC sample powders with 1000 °C treatment: Ce                 for manufacturing under lower temperatures to further
L-edge XANES spectrum single maximum differential              inhibit the development of Ce4+/Ce3+ mixed-valence situa-
energy shoulders and corresponding Ce valence.                 tions. The composite electrolyte has potential for low tem-
                                                               perature SOFC operation under 500 °C. This can increase
x                       Energy (eV)               Valence      the working performance and decrease the degradation rate
Ce(NO3)3                   5724.3                      3       of the peripheral components. Thus, the fabrication cost
                                                               can be further decreased to improve market acceptance.
CeO2                       5727.7                      4
LaDC                       5727.7                    3.97
SDC                        5727.6                    3.96      Conflicts of interest
GDC                        5727.6                    3.96
                                                               The authors declare that they have no conflict of interest.
GYDC                       5727.7                    3.97
Average                                            3.96(1)
                                                               Data availability

Table 7. Ce(NO3)3, CeO2 and LaDC, SDC, GDC, and                The datasets used and/or analysed during the current
GYDC composite sample powders with 500 °C treatment:           study are available from the corresponding author on rea-
Ce L-edge XANES spectrum single maximum differential           sonable request.
energy shoulders and corresponding Ce valence.
x                       Energy (eV)               Valence      Authors’ contributions
Ce(NO3)3                   5724.3                      3
                                                               Conceptualization, Yong-Xin Liang, Xin Wu, L.C. Wen,
CeO2                       5727.7                      4       and Gengyu Cao; methodology, Yong-Xin Liang, L.C.
LaDC–C                     5727.6                    3.96      Wen, and Ze-Rong Ma; software, Yong-Xin Liang, Rui-
SDC–C                      5727.7                    3.97      Sen Huang, and Si-Ting Yu; validation, Xin-Yue He, L.C.
GDC–C                      5727.6                    3.96      Wen, and H.M. Liu; formal analysis, Yong-Xin Liang,
GYDC–C                     5727.7                    3.97      L.C. Wen, and Xu-Yang Ke; investigation, Yong-Xin
                                                               Liang, Ze-Rong Ma, L.C. Wen, and Ri-Feng Yan; resources,
Average                                            3.96(1)
                                                               Yong-Xin Liang, L.C. Wen, and Xiao-Xian Liang; data
                                                               curation, L.C. Wen and Gengyu Cao; writing – original
                                                               draft preparation, Yong-Xin Liang, L.C. Wen; writing –
4 Conclusion                                                   review and editing, Yong-Xin Liang, Ze-Rong Ma, L.C.
                                                               Wen, and Gengyu Cao; visualization, Yong-Xin Liang,
The XRD structure appraisal and Rietveld refinement             L.C. Wen; supervision, L.C. Wen; project administration,
results indicated that the RDC oxide samples produced          L.C. Wen and Gengyu Cao; funding acquisition, Gengyu
through the solid-state synthesis method possess a single-     Cao. All authors have read and agreed to the published
phase fluorite phase. When the samples were assembled into      version of the manuscript.
bulk materials, sintering them at 1500–1600 °C achieved
relative densities exceeding 98.3%, whereas sintering at       Acknowledgments. This research was funded by the Develop-
1000 °C for 10 h maintained densities between 63.6(2)%         ment and Testing of ITSOFC Single Cell, which belongs to the
and 68.4(5)%, indicating porosities between 31.6% and          Skilled Personnel Recommend Programme of Guangdong
36.4%. The bath method was used to heat porous oxide           University of Petrochemical Technology, grant number 702-
bulk materials with a carbonate mixture, LNCO, to              519150.
500 °C for 12 h, then allowing the melted carbonate to fill
the oxide pores and produce a dense carbonate-oxide com-
posite electrolyte. Boiling water was used to remove the       Funding
carbonate. Then, structural refinement was used to obtain
the lattice parameters for the pore and oxide volume calcu-    This research was funded by the Development and Testing
lations. The volume of LNCO used to fill the pores              of ITSOFC Single Cell, which belongs to the Skilled Person-
approached the volume of the pores of the RDC oxide sin-       nel Recommend Programme of Guangdong University of
tered at 1000 °C, indicating that the melted carbonate per-    Petrochemical Technology, grant number 702-519150.
meated and filled the oxide pores. This result was supported
by the SEM observations. The XANES spectrum analysis
results indicated that the RDC samples sintered at 1500–       References
1600 °C exhibited a lower average Ce valence of 3.93(2),
while samples treated at 1000 °C exhibited a higher aver-       1 Lara C., Pascual M.J., Durán A. (2007) Chemical compati-
age Ce valence of 3.96(1), which is identical to that of          bility of RO–BaO–SiO2 (R = Mg, Zn) glass-ceramic seals with
the composite samples. These results illustrate that a            SOFC components, J. Glass Sci. Technol. B 48, 218–224.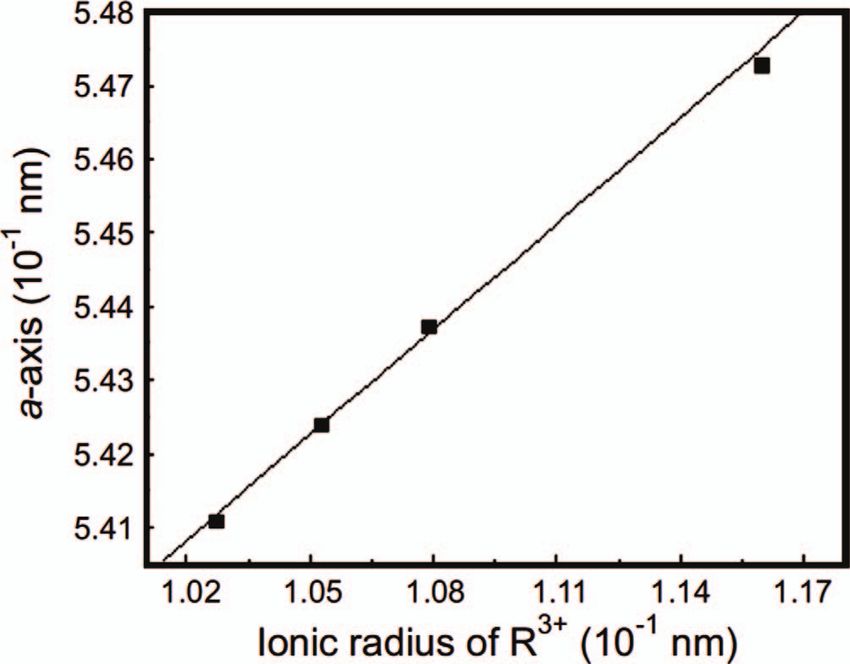
The Author(s): Science and Technology for Energy Transition 77, 4 (2022)                              9

 2 Lashtabeg A, Skinner S.J. (2006) Solid oxide fuel cells – a          the properties of Ln0.2Ce0.8O2 d (Ln = Gd, Sm, La) solid-
   challenge for materials chemists, J. Mater. Chem. 16, 3161–          state electrolyte, J. Power Sources 181, 199–206.
   3170.                                                           11   Steele B.C. (1994) Oxygen transport and exchange in oxide
 3 Gao H., Liu J., Chen H., Li S., He T., Ji Y., Zhang J. (2008)        ceramics, J Power Sources 49, 1–4.
   The effect of Fe doping on the properties of SOFC electrolyte   12   Steele B.C. (1995) Interfacial reactions associated with
   YSZ, Solid State Ion. 179, 1620–1624.                                ceramic ion transport membranes, Solid State Ion. 75,
 4 Singhal S.C., Kendall K. (2003) High temperature solid oxide         157–165.
   fuel cells: Fundamentals, design and applications, 1st edn.,    13   Steele B.C. (2000) Appraisal of Ce1 yGdyO2 y/2 electrolytes
   Elsevier, Oxford, UK.                                                for IT-SOFC operation at 500 °C, Solid State Ion. 129,
 5 West A.R. (1999) Basic solid state chemistry, Wiley, New             95–110.
   York, USA.                                                      14   Xia C., Chen F., Liu M. (2001) Reduced-temperature solid
 6 Tang Z., Lin Q., Mellander B.E., Zhu B. (2010) SDC–LiNa              oxide fuel cells fabricated by screen printing, Electrochem.
   carbonate composite and nanocomposite electrolytes, In. J.           Solid-State Lett. A 4, 52–54.
   Hydrogen Energy 35, 2970–2975.                                  15   Wen L.C., Hsieh C.Y., Tsai Y.I., Lin H.K., Chang S.C., Kao
 7 Zhu B., Yang X.T., Xu J., Zhu Z.G., Ji S.J., Sun M.T., Sun           H.C., Sheu H.S., Lee M.C., Lee Y.S. (2013) Electrical
   J.C. (2003) Innovative low temperature SOFCs and                     properties of Sm-doped Ceria (SDC) and SDC carbonate
   advanced materials, J. Power Sources 118, 47–53.                     composite, J. Chin. Chem. Soc. 60, 1359–1364.
 8 Mat M.D., Liu X., Zhu Z., Zhu B. (2007) Development of          16   Zhu W., Xia C., Ding D., Shi X., Meng G. (2006) Electrical
   cathodes for methanol and ethanol fuelled low temperature            properties of ceria-carbonate composite electrolytes, Mater.
   (300–600 °C) solid oxide fuel cells, Int. J. Hydrogen Energy         Res. Bull. 41, 2057–2064.
   32, 796–801.                                                    17   Larson A.C., von Dreele R.B. (2003) General structure
 9 Zhu B., Liu X., Schober T. (2004) Novel hybrid conductors            analysis system. Report La-UR-86-748. Los Alamos National
   based on doped ceria and BCY20 for ITSOFC applications,              Laboratory, Los Alamos.
   Electrochem. Commun. 6, 378–383.                                18   Shannon R.T. (1974) Revised effective ionic radii and
10 Pikalova E.Y., Maragou V.I., Demina A.N., Demin A.K.,                systematic studies of interatomic distances in halides and
   Tsiakaras P.E. (2008) The effect of co-dopant addition on            chalcogenides, Acta Crystallogr. A 32, 751–767.
You can also read